• Información general
  • Comentarios
  • Discusión

MultiSymbol and TF Chart Integrated

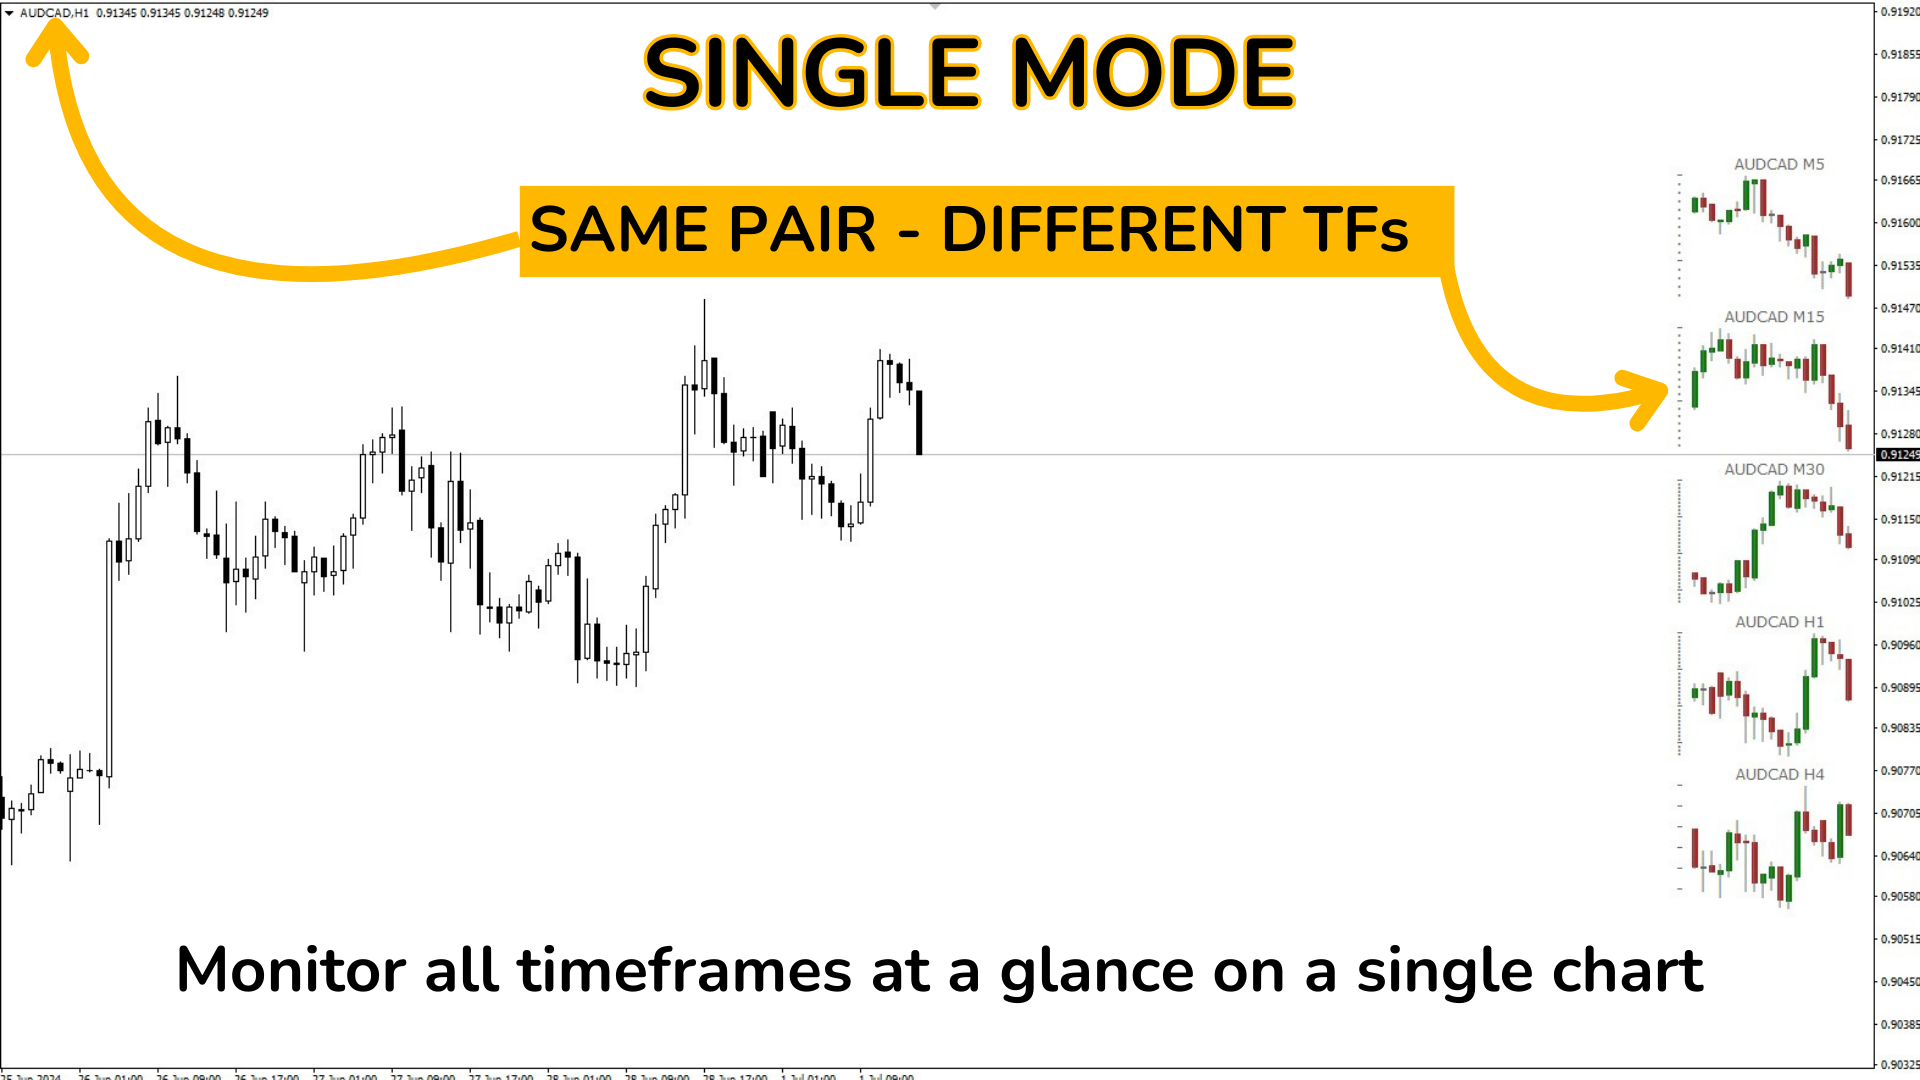
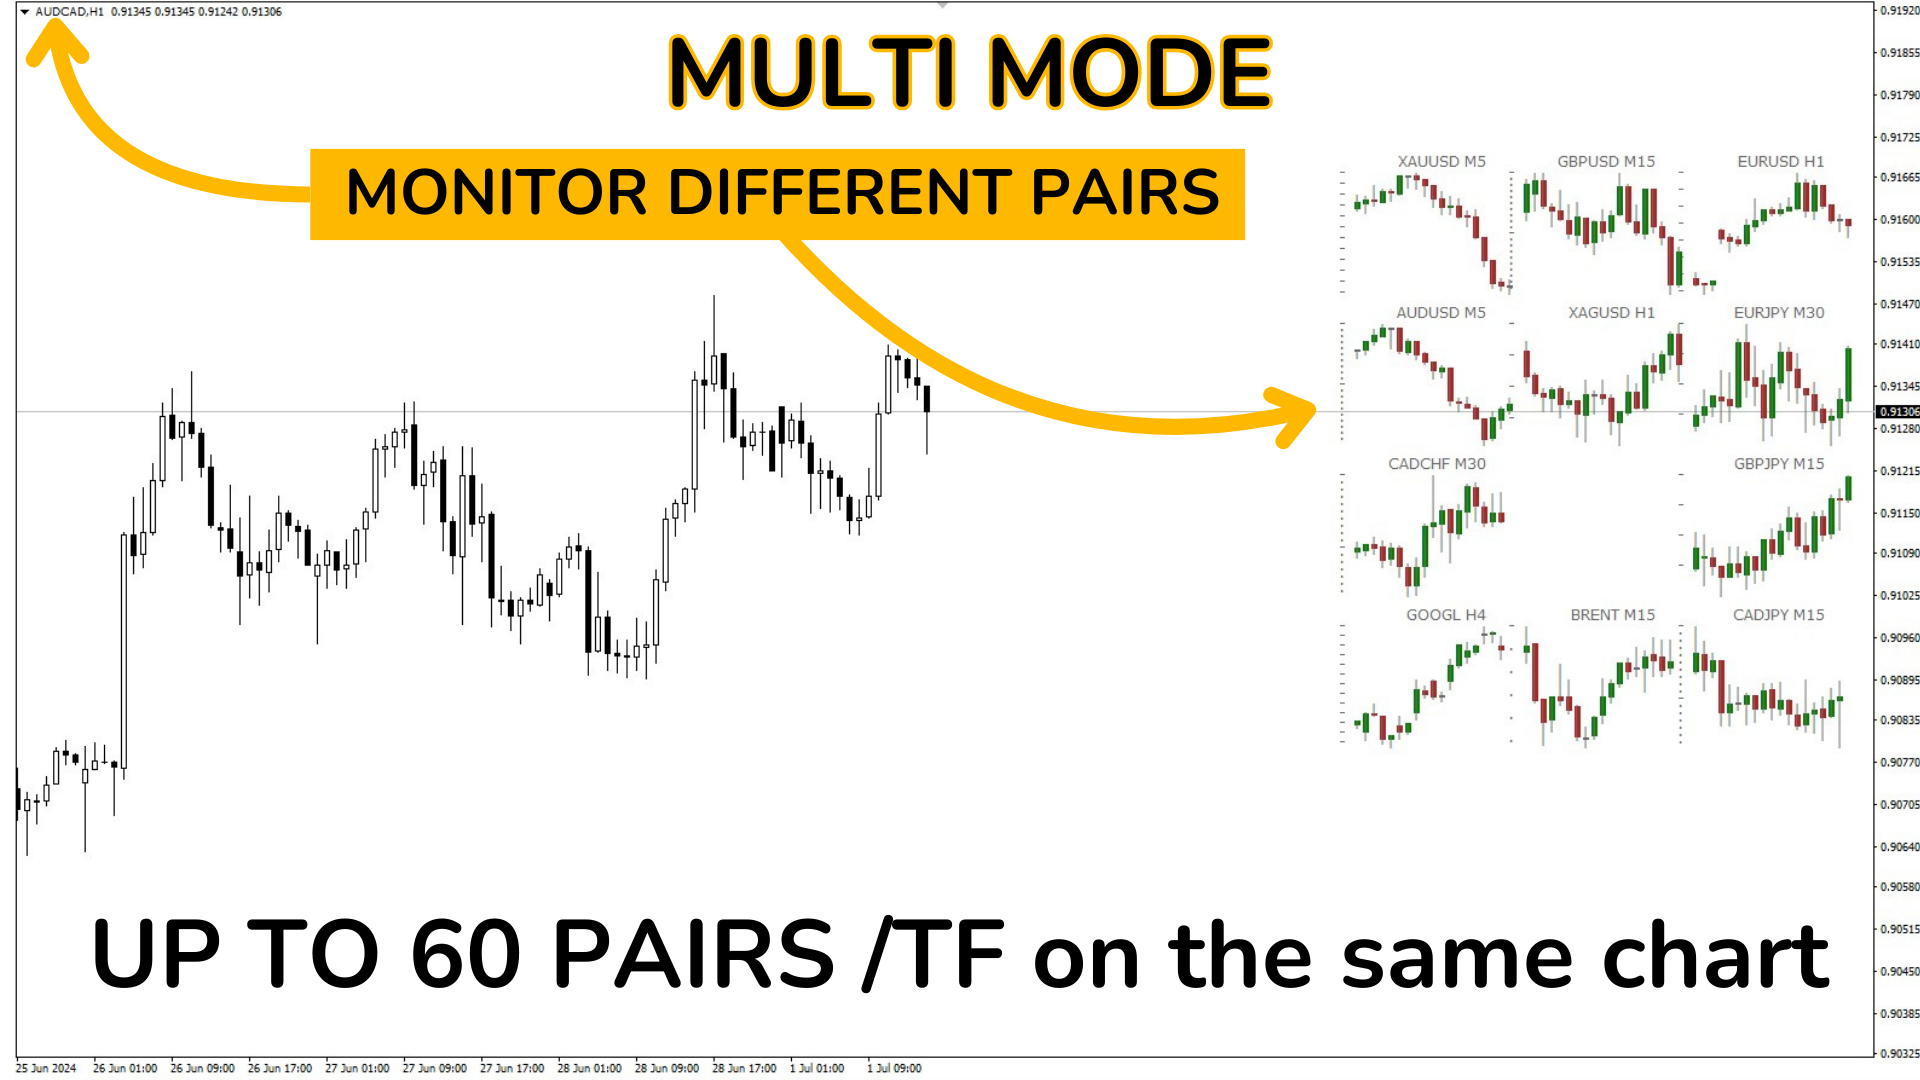
El indicador "MultiSymbol & TF Chart Integrated" está diseñado para proporcionar una visión completa del mercado rápidamente, permitiéndote monitorear hasta 60 pares de divisas en los marcos de tiempo que prefieras en un solo gráfico (modo multiple) o ver el par en el que estamos operando en todos los TF (modo simple).

Ventajas Principales:

  • Monitoreo Completo: Permite monitorear en tiempo real y de un vistazo todos los pares deseados en un solo gráfico.
  • Ahorro de Tiempo: Evita la necesidad de intercambiar entre gráficos, viendo en tiempo real el comportamiento de cada par.
  • Análisis de Tendencias: Perfecto para traders que operan a favor de la tendencia, permitiendo ver marcos de tiempo superiores para confirmar tendencias antes de tomar decisiones.
  • Personalización Extrema: Ajusta cada aspecto del indicador según tus necesidades específicas.


Personalización Extrema:

Parámetros altamente Configurables del Indicador:

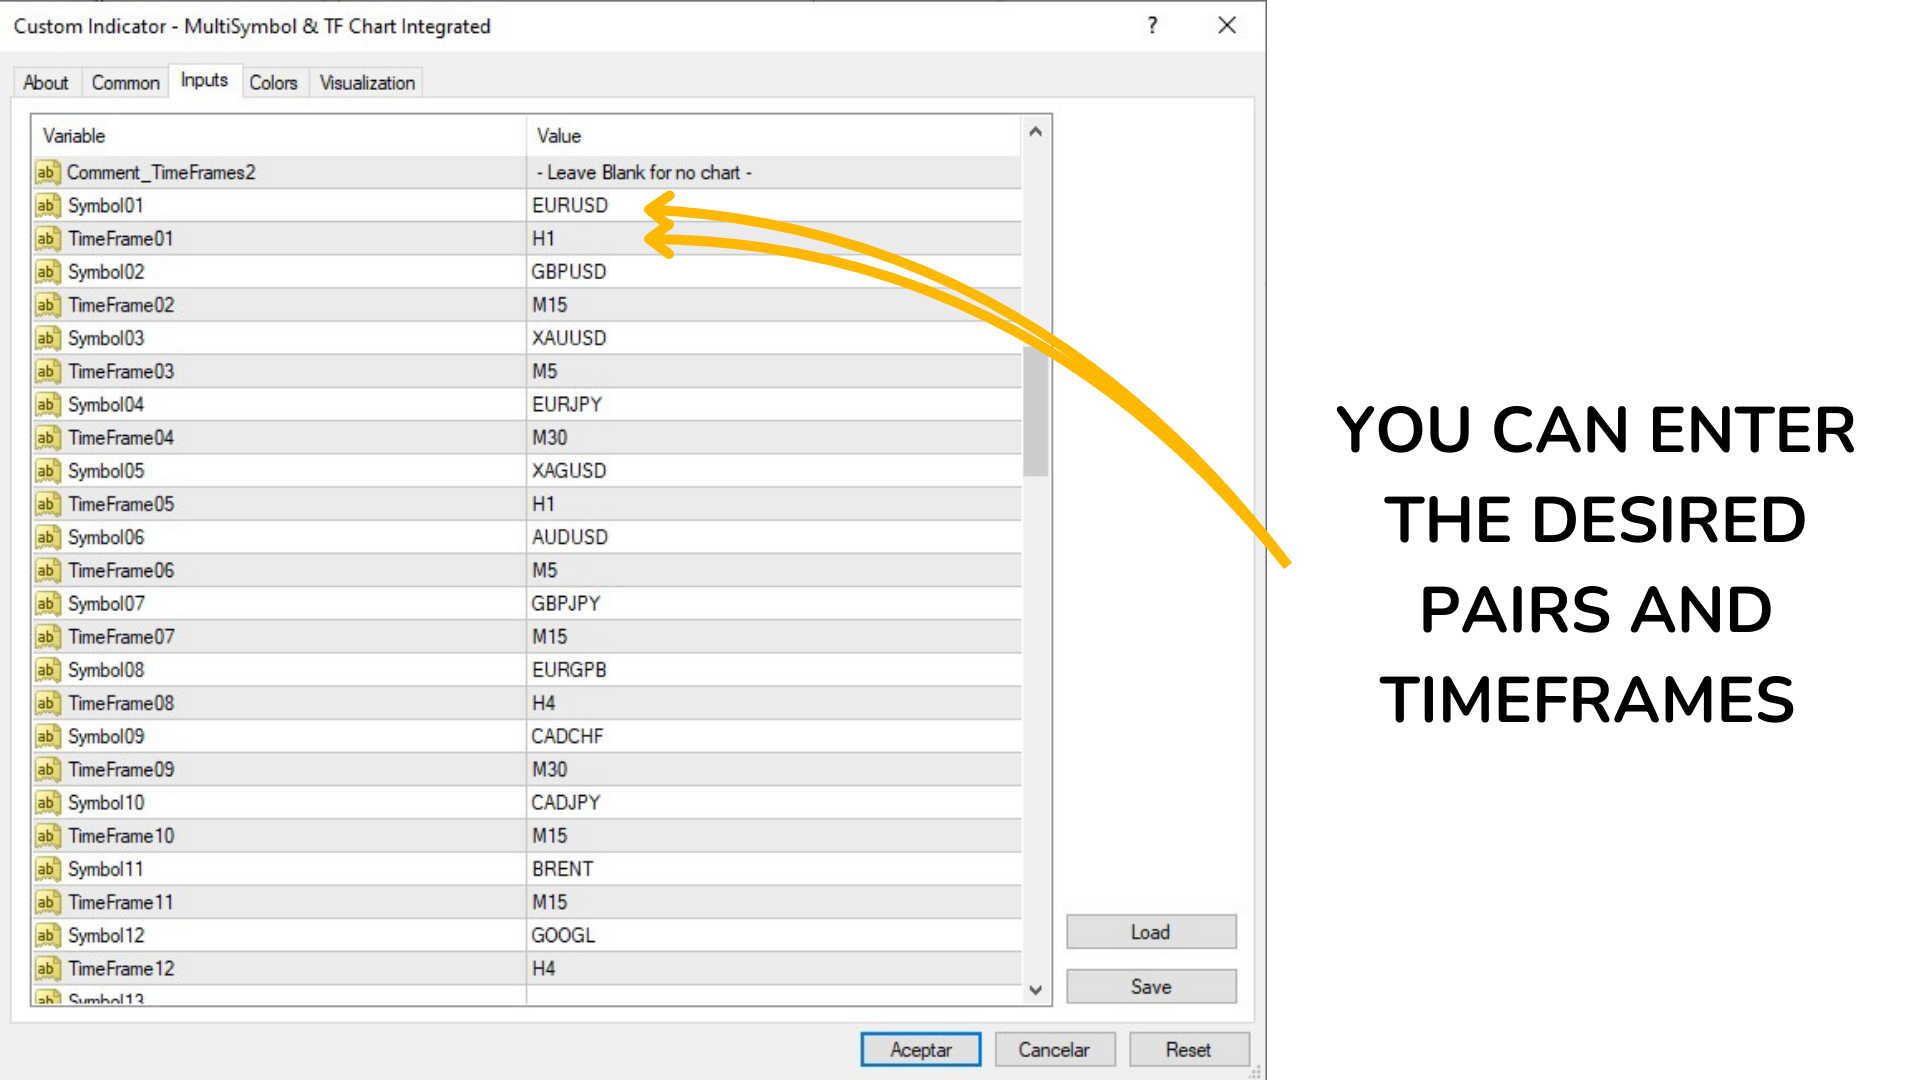
  1. Símbolos y Marcos de Tiempo:

    • Permite configurar hasta 60 símbolos diferentes.
    • Cada símbolo puede tener su propio marco de tiempo (por ejemplo, M1, M5, M15, M30, H1, H4, D1, W1, MN1).
  2. Modo de Visualización:

    • Modo Simple: Configura un solo gráfico con un marco de tiempo específico.
    • Modo Múltiple: Configura múltiples gráficos con diferentes símbolos y marcos de tiempo.
  3. Configuración de Colores:

    • Colores personalizables para velas alcistas y bajistas.
    • Colores de las mechas de las velas.
    • Color de la escala de precios.
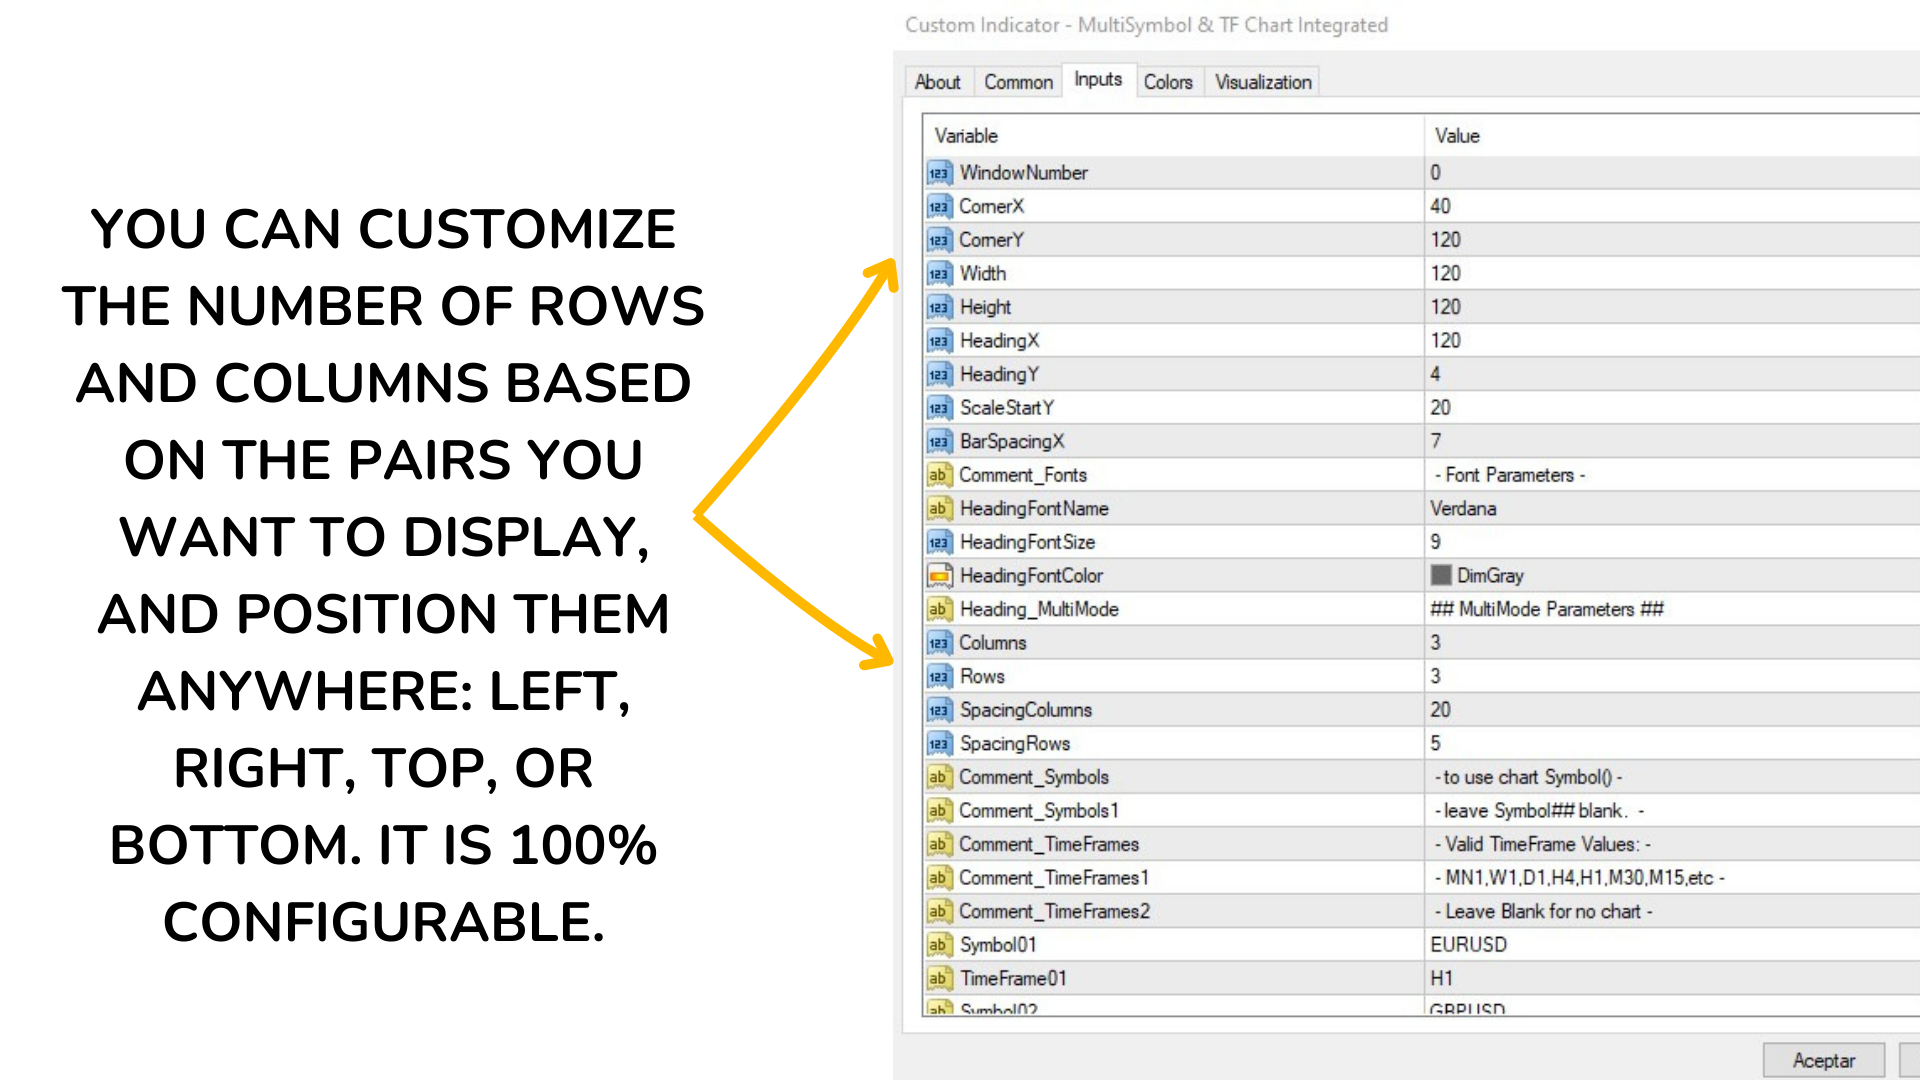
  4. Escalado y Posicionamiento:

    • Autoescalado de gráficos basado en el rango de precios y el ATR.
    • Posicionamiento de los gráficos mediante parámetros de píxeles.
    • Número de filas y columnas para la disposición de los gráficos.
    • Espaciado entre columnas y filas.
    • Posición inicial (X, Y) en la ventana del gráfico.
    • Tamaño del gráfico en píxeles (ancho y alto).
  5. Configuración de Fuentes:

    • Nombre y tamaño de la fuente para los encabezados y etiquetas.
    • Color de la fuente de los encabezados.
  6. Configuración de Barras:

    • Número de barras a mostrar en cada gráfico.
    • Distancia en píxeles entre las barras.
El indicador "MultiSymbol & TF Chart Integrated" es una herramienta imprescindible para cualquier trader que busque maximizar su tiempo, dando un vistazo veloz a todos los pares que desee y operando en el que mas le convenga segun su estrategia. Su alta personalización y facilidad de uso lo convierten en una opción ideal para traders de todos los niveles.  


Utiliza la guía para ajustar los parámetros según tus necesidades específicas:


Descripcion detallada de los parametros externos del Indicador:

Modo Simple

  1. Heading_SingleMode: ## Single Mode Parameters ##

    • Descripción: Título para los parámetros del modo simple (un solo gráfico).

  2. Comment_TimeFrame: - MN1,W1,D1,H4,H1,M30,M15,etc -

    • Descripción: Comentario que indica los marcos de tiempo válidos.

  3. TimeFrame: H4

    • Descripción: Define el marco de tiempo para el gráfico en modo simple. Puedes usar valores como MN1 (mensual), W1 (semanal), D1 (diario), H4 (4 horas), etc.

  4. Comment_Corner: - TopLeft=0,TR=1,BL=2,BR=3 -

    • Descripción: Comentario que explica los valores para la posición del gráfico en la ventana.

  5. Corner: 1

    • Descripción: Define la esquina de la ventana donde se ubicará el gráfico. Valores posibles: 0 (Esquina superior izquierda), 1 (Esquina superior derecha), 2 (Esquina inferior izquierda), 3 (Esquina inferior derecha).

Modo Múltiple

  1. Heading_ChartParam: ## Chart Parameters ##

    • Descripción: Título para los parámetros del modo múltiple (varios gráficos).

  2. MultiMode: true

    • Descripción: Habilita ( true ) o deshabilita ( false ) el modo múltiple.

  3. CandleMode: false

    • Descripción: Define si se muestran velas ( true ) o barras ( false ).

  4. BarsToDisplay: 18

    • Descripción: Número de barras o velas a mostrar en cada gráfico.

  5. AutoScale: true

    • Descripción: Habilita ( true ) o deshabilita ( false ) el autoescalado de los gráficos basado en el rango de precios y el ATR (Average True Range).

  6. ATRBars: 20

    • Descripción: Número de barras a considerar para el cálculo del ATR.

  7. ATRPixelsY: 30

    • Descripción: Número de píxeles verticales asignados al ATR para el escalado.

Configuración de Colores

  1. WickColor: DimGray

    • Descripción: Color de las mechas de las velas.

  2. BullBarColor: Green

    • Descripción: Color de las velas o barras alcistas.

  3. BearBarColor: FireBrick

    • Descripción: Color de las velas o barras bajistas.

  4. ScaleColor: DimGray

    • Descripción: Color de la escala de precios.

Posicionamiento

  1. Comment_Positioning: - Positioning (in Pixels) -

    • Descripción: Comentario que indica que los siguientes parámetros son para posicionamiento en píxeles.

  2. WindowNumber: 0

    • Descripción: Número de la ventana donde se mostrará el gráfico. Generalmente, 0 es la ventana principal.

  3. CornerX: 40

    • Descripción: Posición X inicial del gráfico en píxeles.

  4. CornerY: 120

    • Descripción: Posición Y inicial del gráfico en píxeles.

  5. Width: 120

    • Descripción: Ancho del gráfico en píxeles.

  6. Height: 120

    • Descripción: Altura del gráfico en píxeles.

Configuración de Fuentes

  1. HeadingFontName: Verdana

    • Descripción: Nombre de la fuente utilizada para los encabezados y etiquetas.

  2. HeadingFontSize: 9

    • Descripción: Tamaño de la fuente para los encabezados y etiquetas.

  3. HeadingFontColor: DimGray

    • Descripción: Color de la fuente de los encabezados.

Configuración de Modo Múltiple

  1. Heading_MultiMode: ## MultiMode Parameters ##

    • Descripción: Título para los parámetros específicos del modo múltiple.

  2. Columns: 3

    • Descripción: Número de columnas para los gráficos.

  3. Rows: 3

    • Descripción: Número de filas para los gráficos.

  4. SpacingColumns: 20

    • Descripción: Espaciado en píxeles entre columnas de gráficos.

  5. SpacingRows: 5

    • Descripción: Espaciado en píxeles entre filas de gráficos.

Símbolos y Marcos de Tiempo (60 en total)

  1. Symbol01: EURUSD

    • Descripción: Símbolo del primer gráfico. Puedes configurar hasta 60 símbolos diferentes.

  2. TimeFrame01: H1

    • Descripción: Marco de tiempo del primer gráfico. Cada símbolo puede tener su propio marco de tiempo.


      Estos parámetros se repiten hasta Symbol60 y TimeFrame60 , que por defecto estarán vacíos y cada trader podrá configurarlos según sus necesidades


El indicador "MultiSymbol & TF Chart Integrated" es altamente configurable y permite a los traders personalizar completamente la visualización de múltiples símbolos y marcos de tiempo en un solo gráfico, facilitando el análisis técnico y mejorando la eficiencia en la toma de decisiones.


Productos recomendados
Gold Venamax : este es el mejor indicador técnico de acciones. El algoritmo del indicador analiza el movimiento del precio de un activo y refleja la volatilidad y las posibles zonas de entrada. Características del indicador: Este es un súper indicador con Magia y dos bloques de flechas de tendencia para un comercio cómodo y rentable. El botón rojo para cambiar de bloque se muestra en el gráfico. La magia se establece en la configuración del indicador, por lo que puede instalar el indicador
El indicador construye un semáforo de tres periodos y un patrón de inversión 123 desde el extremo. La señal se produce en la apertura de la segunda vela. Este patrón se puede negociar de diferentes maneras (punto de prueba 3, ruptura y otros). La salida del canal o la ruptura de la línea de tendencia es el principal desencadenante para encontrar un punto de entrada. Los iconos están coloreados según los niveles de Fibonacci. Los iconos amarillos indican una prueba de un nivel en el que la señal
Very Accurate Market Trend Indicator! Advantages easy, nice visual and effective trend detection given Always opportunities works on all pairs Forex, Crypto, Commodities, Stocks, Indicies works on all timeframes, but higher TF 1-4Hr is more effective !!!! WARNING !!!! This is trend indicator, it searching for trends in the market! You need patience and you may see loosing trades in a row but that is normal! Do not panick! Once you detect the trends and its confirmed there will be plenty of pi
The Netsrac Correlation Trade Indicator (NCTI) was created to trade correlations between different assets. NCTI offers five different strategies to do this. Five different correlation trading strategies with two or three assets Fast access your assets with one click via asset buttons Your profit/loss at a glance Configurable alerts via screen or mobile You can use the indicator with every timeframe. Higher timeframes give fewer but better signals. If you have some questions or suggestions - ple
RSI Currency Strength Meter uses RSI (Relative Strength Index) to monitor how strong a currency is, or in other words, if it's being bought or sold by the majority compared to the other currencies. It displays the strength-lines of the currencies of the pair (base and counter currency of the chart) with changeable solid lines. Also, you can add up to five additional currencies to the "comparison pool". If you want to look and compare, for example, EUR, USD and JPY, it will only look at the EURUS
¡Actualmente 20% OFF ! ¡La mejor solución para cualquier novato o trader experto! Este software funciona con 28 pares de divisas. Se basa en 2 de nuestros principales indicadores (Advanced Currency Strength 28 y Advanced Currency Impulse). Proporciona una gran visión general de todo el mercado de divisas. Muestra los valores de Advanced Currency Strength, la velocidad de movimiento de las divisas y las señales para 28 pares de divisas en todos los (9) marcos temporales. Imagine cómo mejorar
MA Alignment Scanner
Benedict Jamora
5 (1)
This indicator scans and displays currency pairs that have recently aligned moving averages on a given timeframe. You can configure which pairs the indicator will scan. It also includes all types of alert options. Bullish MA Alignment =  MA1>MA2>MA3>MA4>MA5 Bearish MA Alignment =  MA1<MA2<MA3<MA4<MA5 Features Attach to one chart and scans all the currency pairs configured and visible in the Market Watch Window It can monitor all the available timeframes from M1 to MN1 and sends alerts on ever
Market Meeter
Hapu Arachchilage Tharindu Lakmal
Market Meter is designed for explore various trends in current trading symbol.  with Market Meter  you can get a clear idea about the trends running on different time frames of current symbol. This indicator uses separate window to display its data. Every time when a new trend occurred, Indicator shows it with displaying an arrow on related text area. It's very important to identify the trends of higher time frames when you trading lower time frames. Let the Market Meter  to do the work for you.
BinaryPRO- is a multi-currency and multi-timeframe signal indicator, created according to the author's algorithm. It produces high-quality and timely trading signals in the form of arrows on any financial assets traded on Meta Trader 4. It is a good alternative to paid signal services. The indicator can be used with any broker (with 4/5-digit quotes). The received trading signals can and should be used when trading binary options and cryptocurrency. Advantages of BinaryPRO: accurately shows th
Master Scalping M1 es un indicador innovador que utiliza un algoritmo para determinar la tendencia de forma rápida y precisa. El indicador calcula el tiempo de apertura y cierre de posiciones, los algoritmos del indicador le permiten encontrar los momentos ideales para ingresar a una operación (comprar o vender un activo), lo que aumenta el éxito de las transacciones para la mayoría de los comerciantes. Beneficios del indicador: Fácil de usar, no sobrecarga el gráfico con información innecesari
Forex Gump
Andrey Kozak
2.83 (6)
Forex Gump is a fully finished semi-automatic trading system. In the form of arrows, signals are displayed on the screen for opening and closing deals. All you need is to follow the instructions of the indicator. When the indicator shows a blue arrow, you need to open a buy order. When the indicator shows a red arrow, you need to open a sell order. Close orders when the indicator draws a yellow cross. In order to get the most effective result, we recommend using the timeframes H1, H4, D1. There
Multiple Indicators for Major Currencies The purpose of this indicator is to save time to detect more good trading opportunities by scanning all 28 cross currency pairs of AUD, CAD, CHF, EUR, GBP, JPY, NZD and USD in the same time. There are 5 indicators included in this indicator which are CCI, RSI, Stochastic, MACD and the different between plusDI and minusDI of ADX (PlusDI-MinusDI). The indicator can help in determining the following properties of each currency depending on which indicator
PZ Trend Trading
PZ TRADING SLU
4.8 (5)
Trend Trading es un indicador diseñado para sacar el máximo provecho posible de las tendencias que tienen lugar en el mercado, mediante el cronometraje de retrocesos y rupturas. Encuentra oportunidades comerciales al analizar qué está haciendo el precio durante las tendencias establecidas. [ Guía de instalación | Guía de actualización | Solución de problemas | FAQ | Todos los productos ] Opere en los mercados financieros con confianza y eficiencia Aproveche las tendencias establecidas sin s
El indicador MTF Qristalium Arrows es un sistema de comercio semiautomático terminado. Funciona en todos los pares de divisas.  En el indicador están involucrados tres reglas: 1) operar sólo por la tendencia, 2) "comprar, cuando todo el mundo vende y vender, cuando todo el mundo compra", 3) el Precio siempre va en contra de la multitud.  El indicador MTF Qristalium Arrows filtra los datos de la regla en varios Marcos de tiempo con indicadores integrados. Si coincide con la tendencia en la
Blahtech Market Profile
Blahtech Limited
4.61 (18)
Was: $249  Now: $99   Market Profile defines a number of day types that can help the trader to determine market behaviour. A key feature is the Value Area, representing the range of price action where 70% of trading took place. Understanding the Value Area can give traders valuable insight into market direction and establish the higher odds trade. It is an excellent addition to any system you may be using. Blahtech Limited presents their Market Profile indicator for the MetaTrader community. Ins
Think of the rarest pair you can think of. And I assure you that this indicator can compute it's strength. This Currency Meter will literally calculate any currency pairs, either it is the Major Pairs, Metals, CFD's, Commodities, Crypto Currency like Bitcoin/BTC or Ethereum/ETH and even stocks. Just name it and you will get it! There is no currency pair this Currency Meter can solve. No matter how rare or exotic is that currency, it will always be solved by this Currency meter which on a real-ti
Currency Power Meter
Vu Trung Kien
4.74 (19)
Currency Power Meter shows the power of major currencies against each other. The indicator shows the relative strength of currency/pair at the current moment in a period of time (H4, daily, weekly, monthly). It is useful for day traders, swing traders and position traders with suitable period options. Currency power is the true reason of market trend: The strongest currency against the weakest currency will combine into a most trending pair. As we know, trend makes money and all traders love tre
VR Cub
Vladimir Pastushak
VR Cub es un indicador para obtener puntos de entrada de alta calidad. El indicador fue desarrollado para facilitar los cálculos matemáticos y simplificar la búsqueda de puntos de entrada a una posición. La estrategia comercial para la cual se diseñó el indicador ha demostrado su eficacia durante muchos años. La simplicidad de la estrategia comercial es su gran ventaja, que permite que incluso los operadores novatos negocien con éxito con ella. VR Cub calcula los puntos de apertura de posiciones
Gann Square of 144
Taras Slobodyanik
4.33 (6)
Gann Box (o Gann Square) es un método de análisis de mercado basado en el artículo "Fórmula matemática para predicciones de mercado" de W.D. Gann. Este indicador puede trazar tres modelos de cuadrados: 90, 52 (104), 144. Hay seis variantes de cuadrículas y dos variantes de arcos. Puede trazar varios cuadrados en un gráfico simultáneamente. Parámetros Square — selección de un modelo cuadrado: 90 — cuadrado de 90 (o cuadrado de nueve); 52 (104) — cuadrado de 52 (o 104); 144 — cuadrado univer
Cloud Eyes is an advanced moving average alert that   will easily monitor the price action based on set moving averages to multiple open charts.  Objective: To monitor multiple open charts and notify traders conveniently in a single display panel when using the moving averages to enter/exit a trades. Features: Monitor price action in two timeframes at the same time Supports simple, exponential, smoothed, linear weighted moving averages Trigger an alert based on candle size (full/body length) Ca
CCI Currency Strength Meter uses CCI (Commodity Channel Index) to monitor how strong a currency is, or in other words, if it's being bought or sold by the majority compared to the other currencies. If you load this indicator on a chart, it will first display the strength-lines of the currencies (base and counter currency of the chart) with changeable solid lines. Also, you can add up to five additional currencies to the "comparison pool," that already has the base and the profit (counter) curren
Marketfx Profile
Mahmoud Helmy Sedik Mohamed Mansour
A   Market Profile   is an intra-day charting technique (price vertical, time/activity horizontal) devised by J. Peter Steidlmayer, a trader at the   Chicago Board of Trade   (CBOT), ca 1959-1985. Steidlmayer was seeking a way to determine and to evaluate   market value   as it developed in the day time frame. The concept was to display price on a vertical axis against time on the horizontal, and the ensuing graphic generally is a bell shape--fatter at the middle prices, with activity trailing o
El indicador construye cotizaciones actuales, que se pueden comparar con las históricas y, sobre esta base, hacer un pronóstico de movimiento de precios. El indicador tiene un campo de texto para una navegación rápida a la fecha deseada. Opciones: Símbolo - selección del símbolo que mostrará el indicador; SymbolPeriod - selección del período del cual el indicador tomará datos; IndicatorColor - color del indicador; HorisontalShift: cambio de cotizaciones dibujadas por el indicador
Daily Average - Retracement Dashboard   is an indicator that allows you to monitor more than one currency pairs at one time. This indicator is mainly for strategy that trade price retracement based on Resistance3/4 or Support 3/4. After apply this indicator to the chart window, it will hide the chart and display the currency pairs in a table form. There are several data shown on the table that will help trader know when to analyze the currency and do trade using retracement. The indicator will s
This multicurrency indicator is the Lite version of the Cosmic Diviner Reversal Zone Pro indicator. The indicator is based on original formulas for analyzing the volatility and price movement strength. This allows determining the overbought and oversold states of instruments with great flexibility, as well as setting custom levels for opening buy or sell orders when the overbought or oversold values of the instruments reach a user-defined percentage. A huge advantage of Reversal Zone Lite is the
Currency Strength Meter is the easiest way to identify strong and weak currencies. This indicator shows the relative strength of 8 major currencies + Gold: AUD, CAD, CHF, EUR, GBP, JPY, NZD, USD, XAU. Gold symbol can be changed to other symbols like XAG, XAU etc. By default the strength value is normalised to the range from 0 to 100 for RSI algorithm: The value above 60 means strong currency; The value below 40 means weak currency; This indicator needs the data of all 28 major currency pair
Trendiness Index
Libertas LLC
5 (3)
"The trend is your friend" is one of the best known sayings in investing, because capturing large trendy price movements can be extremely profitable. However, trading with the trend is often easier said than done, because many indicators are based on price reversals not trends. These aren't very effective at identifying trendy periods, or predicting whether trends will continue. We developed the Trendiness Index to help address this problem by indicating the strength and direction of price trend
Signal Strength Meter
Naim El Hajj
4.17 (6)
The Signal Strength Meter is a Multi-Currency, Dual Timeframe Interactive Indicator, which calculates the strength of buy and sell signals, and displays a score for each symbol on a display board. Get a 7-Day Free Trial Version:  Click  Here  (Full Access to The Indicator for 7 Days) Check Video Below For Complete Demonstration, and User Manual here . Key Features: Allows you to see multiple currency signals from one chart Analyses the signals from more than a dozen classic indicators Identi
Fisher Yur4ik Indicator - Unlock Precise Trading Insights Explore a world of precision in trading with the "Fisher Yur4ik Indicator." This advanced tool is designed to provide traders with accurate insights into price trends, allowing for well-informed decisions and enhanced profitability. Basic Details : Indicator Type : Fisher Yur4ik Indicator Key Metrics : Real-time analysis of price trends and potential turning points. Customization : Fully customizable settings to align with your unique tra
The indicator displays the data of the Stochastic oscillator from a higher timeframe on the chart. The main and signal lines are displayed in a separate window. The stepped response is not smoothed. The indicator is useful for practicing "manual" forex trading strategies, which use the data from several screens with different timeframes of a single symbol. The indicator uses the settings that are identical to the standard ones, and a drop-down list for selecting the timeframe. Indicator Parame
Los compradores de este producto también adquieren
TPSpro RFI Levels
Roman Podpora
4.86 (21)
Reversal First Impulse levels (RFI)    INSTRUCTIONS        RUS       -       ENG              R ecommended to use with an indicator   -   TPSpro  TREND PRO -  Version MT5 A key element in trading is zones or levels from which decisions to buy or sell a trading instrument are made. Despite attempts by major players to conceal their presence in the market, they inevitably leave traces. Our task was to learn how to identify these traces and interpret them correctly. Main functions: Displaying activ
Atomic Analyst
Issam Kassas
5 (3)
En primer lugar, vale la pena enfatizar que este Indicador de Trading no repinta, no redibuja y no se retrasa, lo que lo hace ideal tanto para el trading manual como para el automatizado. Manual del usuario: configuraciones, entradas y estrategia. El Analista Atómico es un Indicador de Acción del Precio PA que utiliza la fuerza y el impulso del precio para encontrar una mejor ventaja en el mercado. Equipado con filtros avanzados que ayudan a eliminar ruidos y señales falsas, y aumentan el poten
Indicator : RealValueIndicator Description : RealValueIndicator is a powerful tool designed specifically for trading on the EURUSD pair. This indicator analyzes all EUR and USD pairs, calculates their real currency strength values, and displays them as a single realistic value to give you a head start on price. This indicator will tell you moves before they happen if you use it right. RealValueIndicator allows you to get a quick and accurate overview of the EURUSD currency pair tops and bottoms,
TrendMaestro
Stefano Frisetti
5 (3)
note: this indicator is for METATRADER4, if you want the version for METATRADER5 this is the link:  https://www.mql5.com/it/market/product/108106 TRENDMAESTRO ver 2.4 TRENDMAESTRO recognizes a new TREND in the bud, he never makes mistakes. The certainty of identifying a new TREND is priceless. DESCRIPTION TRENDMAESTRO identifies a new TREND in the bud, this indicator examines the volatility, volumes and momentum to identify the moment in which there is an explosion of one or more of these data a
JULY OFFER 80% OFF next price for unlimited version will be 17000$. This is the only time you can get this institutional and professional indicator at this price for unlimited version. Don't dare to miss this. The tool I am about to introduce to you you can't compare it with other tools due to its strategy and accuracy level in predicting the next price directional movement . This tool is designed for serious traders who have decided to make a difference through trading. Be the next person to wi
Cycle Sniper
Elmira Memish
4.41 (37)
NEW YEAR SALE PRICE FOR LIMITED TIME!!! Please contact us after your purchase and we will send you the complimentary indicators to complete the system Cycle Sniper is not a holy grail but when you use it in a system which is explained in the videos, you will feel the difference. If you are not willing to focus on the charts designed with Cycle Sniper and other free tools we provide, we recommend not buying this indicator. We recommend watching the videos about the indiactor and system before pu
AT Forex Indicator MT4
Marzena Maria Szmit
5 (2)
The AT Forex Indicator MT4 is a sophisticated trading tool designed to provide traders with a comprehensive analysis of multiple currency pairs. This   powerful indicator   simplifies the complex nature of the forex market, making it accessible for both novice and experienced traders. AT Forex Indicator uses   advanced algorithms   to detect trends, patterns and is an essential tool for traders aiming to enhance their forex trading performance. With its robust features, ease of use, and reliabl
NAM Order Blocks
NAM TECH GROUP, CORP.
5 (1)
Indicador de detección de Order Blocks multitimeframe para MT4. Características - Panel de control totalmente personalizable, proporciona una interacción completa. - Oculta y muestra el panel de control donde quieras. - Detecta OB en múltiples marcos de tiempo. - Permite seleccionar la cantidad de OB para mostrar. - Interfaz de usuario de diferentes OBs. - Diferentes filtros de OBs (regulares, rejection y sin capitalizar). - Alerta de proximidad de OBs. - Líneas ADR High y Low. - Servicio de not
Enigmera
Ivan Stefanov
5 (4)
ENIGMERA: El núcleo del mercado https://www.enigmera.com Introducción Este indicador y sistema de negociación es un enfoque extraordinario de los mercados financieros. ENIGMERA utiliza los ciclos fractales para calcular con precisión los niveles de soporte y resistencia. Muestra la auténtica fase de acumulación y proporciona dirección y objetivos.  Un sistema que funciona tanto si estamos en una tendencia como en una corrección.  ¿Cómo funciona? ENIGMERA consta de tres líneas: la línea de s
ZeusArrow Smart Liquidity Finder  Smart Liquidity Finder is Ai controlled indicator based on the Idea of Your SL is My Entry. It scan and draws the major Liquidity areas on chart partitioning them with Premium and Discount Zone and allows you find the best possible trading setups and help you decide the perfect entry price to avoid getting your Stop Loss hunted . Now no more confusion about when to enter and where to enter. Benefit from this one of it's kind trading tool powered by Ai an trade
Welcome to the world of SMC (Smart Money Concepts) Trading, where we empower traders with the tools and knowledge to make smarter trading decisions. Our latest addition to our suite of trading tools is the SMC Trading Pro indicator, version 1.0. Key Features: Major Market Structure Identification with BODY break. Order Block must be in Major Swing ( not Small Swing ). Order Block with Fair Value Gap Detection. Order Block in Discount | Premium zone. Filter for only Bullish, Bearish or All Order
A. ¿Qué es A2SR ?   * Es un indicador técnico líder (sin repintado, sin retraso). -- Guía : -- en https://www.mql5.com/en/blogs/post/734748/page4#comment_16532516 -- y https://www.mql5.com/en/users/yohana/blog A2SR tiene una técnica especial para determinar los niveles de Soporte (demanda) y Resistencia (oferta). A diferencia de la forma ordinaria que vimos en la red, A2SR tiene un concepto original para determinar los niveles reales de SR. La técnica original no se tomó de Internet y tampoco
This indicator uses support and resistance, volume and some special formula to calculate the volume to filter the candles. If the volume reaches a specific value, And at the same time, Candle breaks the support/resistance line, There would be a signal and we can enter the market. Signals appear when the current candle closes. then you can enter the trade when a new candle appears. Please don't forget to follow your money management plan. MT5 Version Support/Resistance Breakout MT5 :   https:
Beast Super Signal
Dustin Vlok
4.76 (101)
¿Está buscando un potente indicador de compraventa de divisas que pueda ayudarlo a identificar oportunidades comerciales rentables con facilidad? No busque más allá de Beast Super Signal. Este indicador basado en tendencias fácil de usar monitorea continuamente las condiciones del mercado, buscando nuevas tendencias en desarrollo o saltando sobre las existentes. Beast Super Signal da una señal de compra o venta cuando todas las estrategias internas se alinean y están en 100% de confluencia entr
FxBears Powers
Rachid Lafhil
3 (2)
️️ Attention:      The price will soon be raised to what it was before ($500).      No more losses with this indicator, test it for years ago and see if there is losses in one day results. but before testing it please see the explaining video down here.    FxBears Powers is working on all forex pairs, metals, commodities, futures, indices, energies, crypto, and everything...and on all timeframes from M1 to MN.   It's based on supply and demand zones, price action, and some internal indicators,
Por supuesto, aquí tienes la traducción al español: Presentamos el Indicador de Astronomía para MT4: Tu Compañero Celestial Definitivo en el Trading ¿Estás listo para elevar tu experiencia de trading a alturas celestiales? No busques más allá de nuestro revolucionario Indicador de Astronomía para MT4. Esta innovadora herramienta trasciende los indicadores de trading tradicionales, aprovechando el poder de algoritmos complejos para proporcionarte una visión astronómica sin igual y cálculos de pre
Gold Channel is a volatility-based indicator, developed with a specific timing algorithm for the XAUUSD pair, which consists of finding possible corrections in the market. This indicator shows two outer lines, an inner line (retracement line) and an arrow sign, where the theory of the channel is to help identify overbought and oversold conditions in the market. The market price will generally fall between the boundaries of the channel. If prices touch or move outside the channel it is a tra
Please send me Direct message on MQL5 CHAT after purchasing the Indicator for Training and Installation Support There are some additional files that is important to use with the Indicator . So be sure to contact me after purchasing the Indicator So that I can add you for training and support . If you find any difficulty with installation then send me Direct message here So that I can connect with you via Anydesk or Teamview for the product installation. " Smart Order Block Indicator " to find
ECM Channel MT4
Paulo Rocha
5 (1)
ECM Elite Channel is a volatility-based indicator, developed with a specific time algorithm, which consists of finding possible corrections in the market. This indicator shows two outer lines, an inner line (retracement line) and an arrow sign, where the channel theory is to help identify overbought and oversold conditions in the market. The market price will generally fall between the boundaries of the channel. If prices touch or move outside the channel, it's a trading opportunity. The
Introduction to Fractal Pattern Scanner Fractal Indicator refers to the technical indicator that makes use of the fractal geometry found in the financial market. Fractal Pattern Scanner is the advanced Fractal Indicator that brings the latest trading technology after the extensive research and development work in the fractal geometry in the financial market. The most important feature in Fractal Pattern Scanner is the ability to measure the turning point probability as well as the trend probabi
XQ Indicator MetaTrader 4
Marzena Maria Szmit
3.67 (3)
Step into the realm of Forex trading with confidence and precision using XQ, a cutting-edge Forex indicator designed to elevate your trading game to unprecedented heights. Whether you're a seasoned trader or just stepping into the world of currency exchange,   XQ Forex Indicator   empowers you with the insights and signals needed to make informed trading decisions. The signal conditions are a combination of three indicators, and XQ Forex Indicator only display  medium and long-term trends . The
Gann Signal
Kirill Borovskii
Gann Signal is a very simple indicator at first glance, but hidden inside is many years of experience in studying W.D.Ganna methods. The indicator gives accurate BUY/SELL signals, without redrawing. The indicator is very easy to use. All you need to do is attach it to your chart and follow its recommendations. The indicator constantly analyzes the market for entry opportunities. When such an opportunity appears, the indicator gives a signal in the form of an arrow. I repeat, all signals are NOT
Presentamos el Indicador Milagroso de Forex: Desata el Poder del Trading Preciso ¿Estás cansado de buscar el mejor indicador de Forex que realmente ofrezca resultados excepcionales en todos los marcos temporales? ¡No busques más! Ha llegado el Indicador Milagroso de Forex para revolucionar tu experiencia de trading y llevar tus ganancias a nuevas alturas. Construido sobre una base de tecnología de vanguardia y años de desarrollo meticuloso, el Indicador Milagroso de Forex se erige como el pinácu
Shepherd Gann Squares
Abdullah Alrai
4.9 (10)
Este indicador es un método de análisis de mercado basado en el artículo "Fórmula matemática para predicciones de mercado" escrito por W.D. Gann según los métodos del cuadrado de nueve y el cuadrado de 144. Manual de usuario: Add Your review And contact us to get it Puede comprar la versión MT5 completa en: https://www.mql5.com/en/market/product/28669 Puede probar en MT4 gratis: https://www.mql5.com/en/market/product/15320?source=Site +Profile+Seller#!tab=reviews Este producto
Dragon Multi Indicator MT4
Mansour Babasafary
5 (4)
3 Indicators in 1 indicator Strategy based on price action Made specifically for the best forex currency pairs Can be used in the best time frame of the market at a very reasonable price This indicator is basically 3 different indicatos . But we have combined these 3 indicators in 1 indicator so that you can use 3 indicators at the lowest price. All three strategies are based on price action. But based on different trends. Long term, medium term and short term Attributes : No repaintin
Introduction to X3 Chart Pattern Scanner X3 Cherart Pattern Scanner is the non-repainting and non-lagging indicator detecting X3 chart patterns including Harmonic pattern, Elliott Wave pattern, X3 patterns, and Japanese Candlestick patterns. Historical patterns match with signal patterns. Hence, you can readily develop the solid trading strategy in your chart. More importantly, this superb pattern scanner can detect the optimal pattern of its kind. In addition, you can switch on and off individu
System Trend Pro - This is the best trend trading indicator!!! The indicator no repaint!!!   The indicator has   MTF   mode, which adds confidence to trading on the trend (   no repaint   ). How to trade? Everything is very simple, we wait for the first signal (big arrow), then wait for the second signal (small arrow) and enter the market in the direction of the arrow. (See screens 1 and 2.) Exit on the opposite signal or take 20-30 pips, close half of it, and keep the rest until the oppo
Max Paynex
Abdulkarim Karazon
Max Payne es un indicador de señal de reversión/tendencia que proporciona señales en forma de flecha, este indicador da su señal al cerrar la misma barra, este indicador puede aparecer varias veces en el gráfico con diferentes períodos para obtener confirmación doble/triple de las señales. El indicador es altamente ajustable para adaptarse a cualquier estilo comercial y nunca se repinta ni se vuelve a pintar. Obtendrá el sistema completo en capturas de pantalla después de la compra junto con la
SNR LEVEL INDICATOR Accurate Snr level indicator will only display Fresh Levels that are close to the Current Market Price. This indicator is very accurate in mapping Support & resistance levels. there is an alert feature when the price TOUCHES the SNR LEVEL, WHEN CLOSE CANDLE BREAK/REJECT SNR LEVEL. INDICATOR MARKING : - SUPPORT LEVEL = V SHAPE - RESISTANCE LEVEL = APEX LEVEL - GAP RESISTANCE & GAP SUPPORT = OPEN CLOSE CANDLE - SUPPORT BECAME RESISTANCE & RESISTANCE BECAME SUPPORT INDICATOR
Presentamos ON Trade Waves Patterns Harmonic Elliot Wolfe, un indicador avanzado diseñado para detectar diversas formas de patrones en el mercado mediante métodos tanto manuales como automáticos. A continuación, te explicamos cómo funciona: Patrones Armónicos: Este indicador puede identificar patrones armónicos que aparecen en tu gráfico. Estos patrones son esenciales para los traders que practican la teoría del trading armónico, tal como se popularizó en el libro de Scott Carney "Harmonic Tradi
Otros productos de este autor
BullsEye Signal NoRepaint
Martin Alejandro Bamonte
BullseyeSignal –NoRepaint es una señal que, como su nombre lo indica, no repinta nunca, bajo ninguna circunstancia. La señal se emite en la misma vela que se observa en la imagen. Es ideal para mercados con alta volatilidad, como forex, criptomonedas, acciones, indices y futuros. Usted solo verá una flecha verde para comprar y una roja para vender, pero debajo de ellas hay muchos indicadores trabajando conjuntamente para poder brindale un trading mas simplificado. Está diseñada específicamente p
Aurum Apex Mt4 EA
Martin Alejandro Bamonte
Descripción de Aurum Apex EA Aurum Apex EA es una herramienta de trading automatizada robusta al 100%, diseñada para la plataforma MT4. Realiza análisis de mercado en tiempo real, detectando diversas oportunidades de trading. Apto para traders de todos los niveles, Aurum Apex EA ofrece tres modos de riesgo, ajustables a través del parámetro de Riesgo: Riesgo = 0.1 (Bajo Riesgo): Ideal para nuevos traders que no están familiarizados con los movimientos del oro. Esta configuración minimiza las so
Indicador NextCandlePredictor NextCandlePredictor, una indicador del tipo señal con alerta que no repinta, no cambia su color, no se mueve, no desaparece y no tiene lag. Te ayudará a identificar la dirección de la próxima o próximas velas en cualquier marco temporal. Es altamente recomendado para mercados de alta volatilidad, como Nueva York, Londres o incluso el solapamiento de ambos. Características Principales: Versatilidad en Timeframes : Proporciona señales rápidas y precisas en cualquie
El indicador MTFMA (Multi-Timeframe Moving Averages) utiliza múltiples medias móviles (MA) en diferentes marcos de tiempo para proporcionar señales de compra y venta (que no repintan) en una ventana separada del gráfico principal. Es versátil y fácil de interpretar, adecuado tanto para scalping en marcos de tiempo pequeños como para trading a más largo plazo en marcos de tiempo mayores. ¿Por qué es Multiframe? El término multiframe se refiere a la capacidad del indicador de utilizar y comb
Scalping Signal NO Repaint NO Lag
Martin Alejandro Bamonte
5 (1)
El "Scalping Signal No Repaint No Lag" es el único indicador en el mercado que, al arrastrarlo a cualquier gráfico, carga automáticamente todos los indicadores necesarios sin necesidad de cargar ningún template ni otros indicadores. Autoconfigura el gráfico para que se vea exactamente como en la imagen proporcionada. Este indicador garantiza señales sin repintado ni retrasos, lo que lo hace ideal para estrategias de scalping en todos los pares y en todos los marcos de tiempo (TF). Funcionalidade
Clear Breakout
Martin Alejandro Bamonte
El indicador "Breakout Buy-Sell" está diseñado para identificar y resaltar posibles oportunidades de compra y venta basadas en rupturas de precios durante diferentes sesiones del mercado (Tokio, Londres y Nueva York). Este indicador ayuda a los traders a visualizar claramente las zonas de compra y venta , así como los niveles de toma de ganancias (TP) y stop loss (SL). Estrategia de Uso El indicador se puede utilizar de la siguiente manera: Configuración Inicial : Selecciona la sesión del merc
GbpUsd Pip Hunter EA
Martin Alejandro Bamonte
Español GBPUSD Pip Hunter EA Características principales: Optimizado para GBPUSD en M15: Diseñado y probado específicamente para el par GBPUSD en un gráfico de 15 minutos. Tamaño mínimo de cuenta recomendado: Requiere un saldo mínimo de $1000 para asegurar bajos drawdowns. Compatibilidad con spreads: Mejor utilizado con cuentas de spread bajo o ECN para maximizar la rentabilidad. Gestión de riesgos: Incluye una opción para desactivar la función de Lote Exponencial configurándola en 1.0, según tu
Pairs and TF Changer
Martin Alejandro Bamonte
¿Estás cansado de cambiar entre múltiples gráficos para monitorear diferentes pares de divisas y marcos de tiempo? ¡El indicador Pairs and TF Changer está aquí para revolucionar tu experiencia de trading! Una vez que hayas cargado todos los indicadores para tu estrategia, agrega Pairs and TF Changer al gráfico. Si es necesario, puedes ajustar su posición, colores o el número de columnas que muestra. Características principales: Integración sin interrupciones: Integra este indicador en tu estrate
GO Trend MultiTimeFrame
Martin Alejandro Bamonte
El indicador "GoTrend Multi-Timeframe" es una herramienta imprescindible para los traders que buscan una forma rápida y eficiente de evaluar la tendencia general y específica de un par de divisas en diferentes marcos de tiempo. Este indicador permite a los traders obtener una visión clara y completa de la dirección del mercado con tan solo un vistazo, optimizando así su toma de decisiones y mejorando la efectividad de sus estrategias de trading. Características Principales: Análisis Multimarcos
Filtro:
No hay comentarios
Respuesta al comentario