=== > Que fait cet indicateur ?
Comme beaucoup de mes codes, il est multi timeframe.
Ils permettent d’afficher le tracé d’un daily en H1 par exemple.
Recherchez tous mes codes (codebase et marketplace ) avec William210
Il trace une seule moyenne VEMA avec le choix du timeframe.
La moyenne mobile exponentielle pondérée en volume (VEMA) est une moyenne mobile qui accorde plus de poids aux données récentes et aux barres de volume élevé.
Cela signifie que les fluctuations de prix sur les barres à volume élevé auront un impact plus important sur VEMA.
Il trace une seule moyenne WWMA avec le choix du timeframe
Vous déposez cet indicateur sur vos graphiques autant de fois que vous avez besoin de moyenne.
Choisissez les paramètres et les caractéristiques de votre moyenne et c’est tout !!!
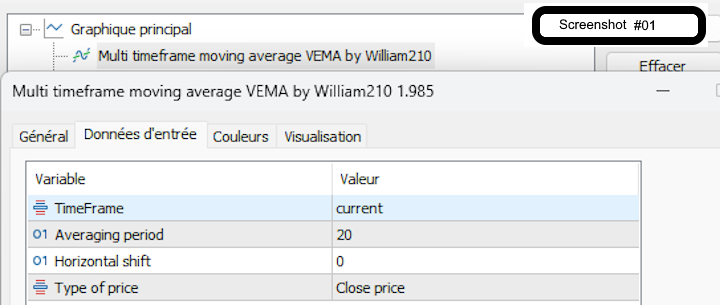
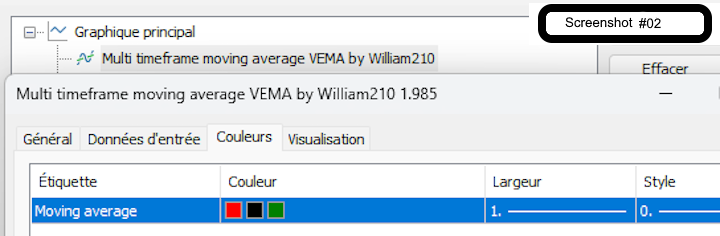
**** Voir screenshot 01 à 02
N'hésitez pas à me demander le code iCustom pour intégrer facilement cette moyenne à vos propres codes, autre indicateur ou EA
Choisissez
La timeframe cible
Le nombre de période
Le décalage
L’OHLC désiré
La couleur de tendance
Vous pouvez retrouver toutes mes publications sur Codebase et maintenant sur Marketplace sous le nom "William210".
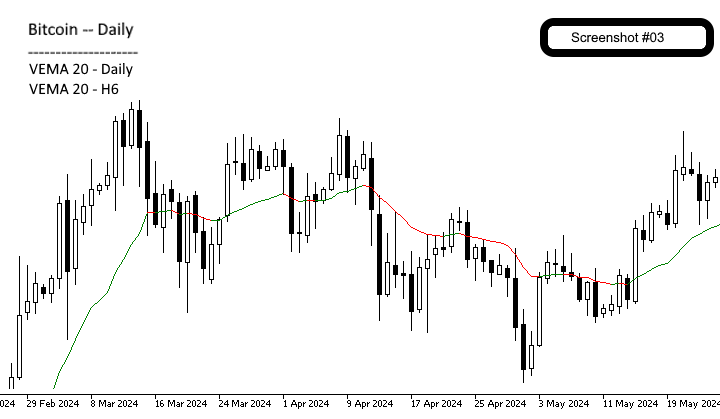
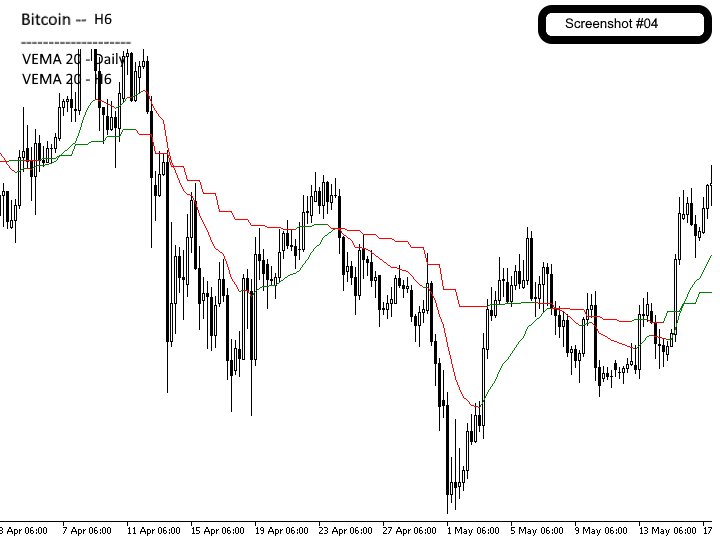
=== > Quelques exemples
Voici quelques exemples simples d'utilisation de la moyenne mobile multi timeframe
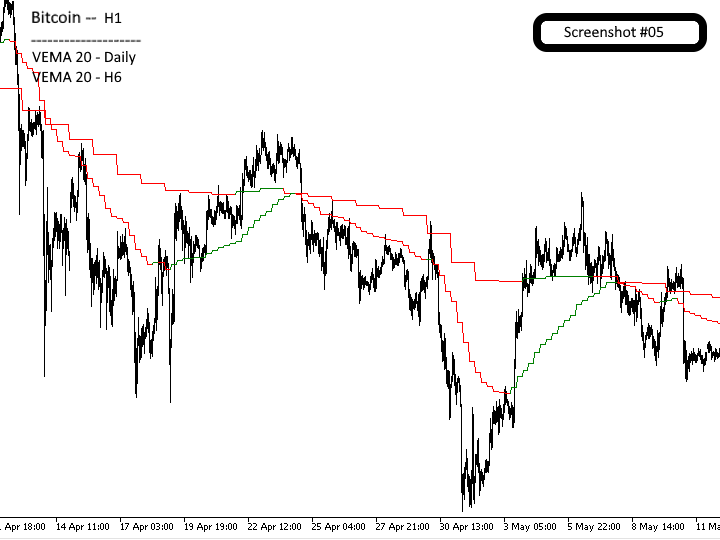
Exemple sur le Bitcoin
Ajoutez 2 moyennes mobiles 20, une sur le timeframe Daily et une sur le H6 et voyez en H1
**** Voir screenshot de 3 à 5
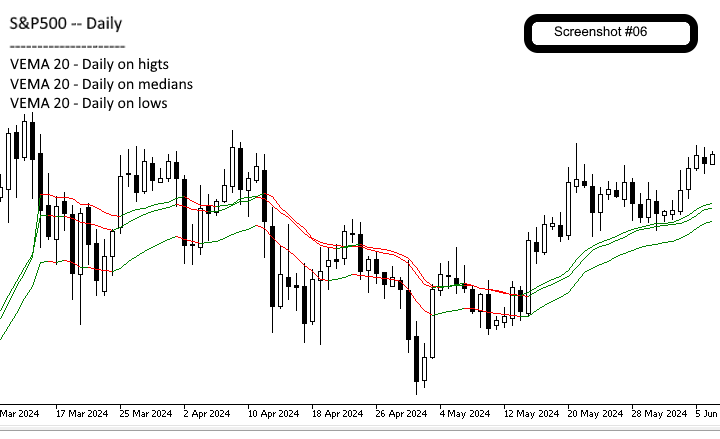
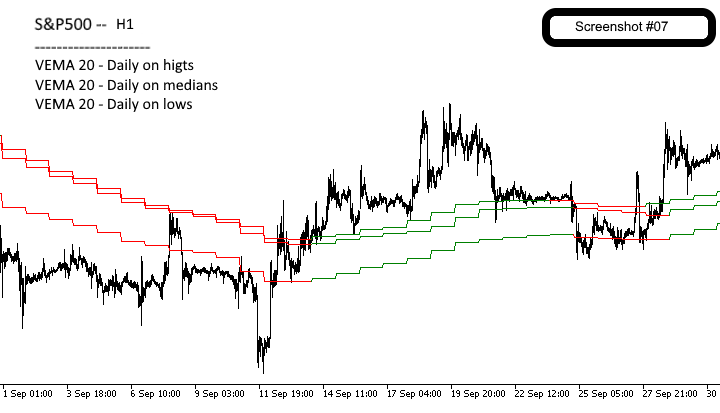
Exemple sur le S&P500
Ajoutez 3 moyennes mobiles 20 périodes sur le daily appliquées sur les prix high, median et regardez en H1
**** Voir screenshot de 6 à 7
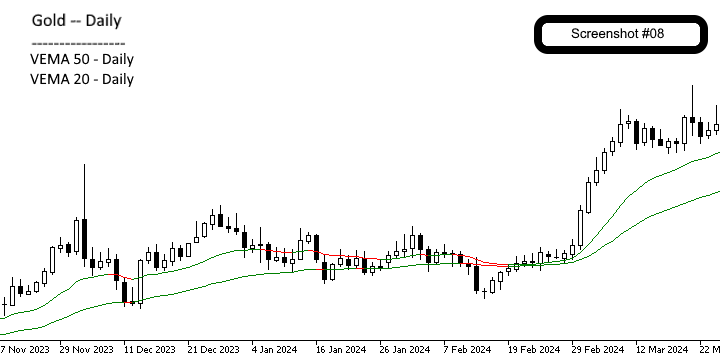
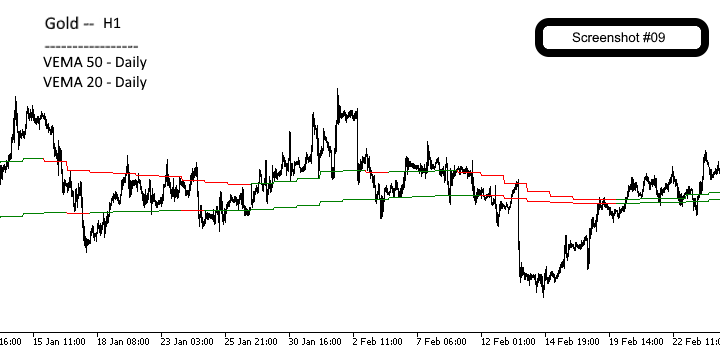
Exemple sur le Gold
Ajoutez 2 moyennes mobiles 50 et 20 périodes sur le Daily et regardez en H1
**** Voir screenshot de 8 à 9
Les vôtres
Partagez vos paramètres d'utilisation et découvrez comment d'autres traders exploitent cet indicateur pour optimiser leurs stratégies !
=== > Pour qui ?
Que vous soyez trader discrétionnaire, trader algorithmique ou développeur, l’indicateur est conçu pour répondre à vos besoins. Je comprends l'importance de la fiabilité et de l'efficacité lorsque de l'argent est en jeu, et je prends cette responsabilité très au sérieux.
L’indicateur consomme peu de ressources sur vos PC ou VPS. Pour les traders algorithmiques et les développeurs, j'offre un accès complet aux deux buffers : le buffer 1 pour les valeurs de la moyenne et le buffer 2 pour l'orientation de la moyenne.
=== > Pourquoi ?
Les moyennes mobiles sont utilisées depuis longtemps. Elles servent principalement à définir la tendance et les ranges.
Pour vos Expert Advisors (EA), vos indicateurs, ou vous-même pourrez alors prendre des décisions plus facilement et de manière plus éclairée.
=== > Les règles de développement appliquées
Nommage des variables : Toutes les variables sont nommées de manière cohérente et descriptive, facilitant la compréhension et la maintenance du code.
Utilisation minimale de variables globales : Très peu de variables globales sont utilisées.
Faible consommation de mémoire : L'indicateur est conçu pour consommer peu de mémoire, garantissant une performance optimale.
Initialisation des variables : Toutes les variables sont initialisées, ce qui minimise les comportements inattendus et renforce la stabilité du code.
Optimisation des boucles : Toutes les boucles sont optimisées pour assurer un parcours efficace, augmentant ainsi la rapidité des calculs.
Limitation du nombre de boucles : Le nombre de boucles a été réduit en combinant plusieurs traitements.
Gestion des erreurs : Tous les retours de fonctions sont soigneusement gérés pour détecter et traiter les erreurs éventuelles, assurant ainsi une fiabilité maximale.
Limitation de la taille des logs : Une procédure limite l’écriture des messages répétitifs, évitant ainsi la surcharge des journaux et facilitant le débogage.
=== > Un code robuste
Il est essentiel d'avoir un code robuste qui fonctionne en permanence. En cas de problème, des messages d'erreurs clairs sont fournis. Malgré ces contrôles systématiques, l'indicateur reste rapide grâce à l'optimisation des parcours de données.
=== > Comment a-t-il été fait ?
Pas basé sur la fonction native ima() : L'indicateur est construit indépendamment de la fonction native ima().
Principes de la POO appliqués : Bien que non écrits en POO, les principes de la programmation orientée objet sont appliqués pour les appels de fonctions.
Fonctionnement hors marché : Il fonctionne même sur des symboles hors marché. Un clic sur un autre timeframe peut être nécessaire pour le rafraîchissement de l’affichage.
Gestion des coupures : En cas de coupure internet ou de problème serveur, l’indicateur le signale, recharge tout l’historique et refait tous les calculs.
Réactivité : Très réactif, sans redessiner, l’indicateur se met à jour au tick près, crucial pour les cryptomonnaies ou les symboles très volatiles.