Multi timeframe moving average VEMA by William210
- Indicators
- Gerard Willia G J B M Dinh Sy
- Version: 1.966
- Activations: 5
===> What does this indicator do?
Like many of my codes, it is multi timeframe.
They allow you to display the plot of a daily in H1 for example.
Search all my codes (codebase and marketplace) with William210
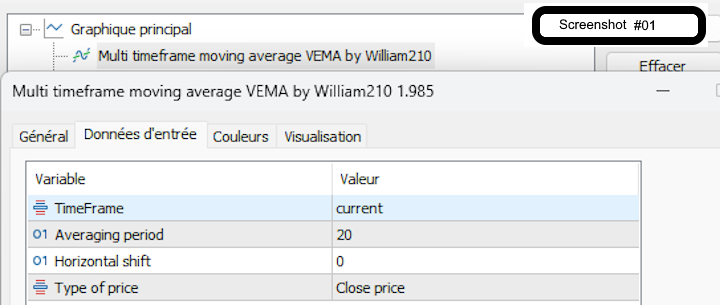
It plots a single VEMA average with the choice of timeframe.
The volume-weighted exponential moving average (VEMA) is a moving average that places more weight on recent data and high volume bars.
This means that price fluctuations on high volume bars will have a greater impact on VEMA.
You drop this indicator on your charts as many times as you need to average.
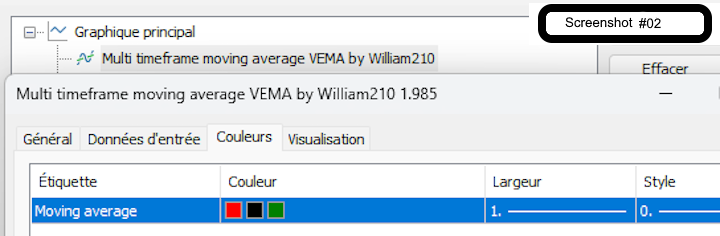
Choose the parameters and characteristics of your average and that's it!!!
**** See Screenshot 01 to 02
Do not hesitate to ask me for the Icustom code to easily integrate this average into your own codes, another indicator or EA
Choose
The target timeframe
The number of periods
The lag
The desired ohlc
Trendy color
You can find all my publications on Codebase and now Marketplace under the name "William210".
===> Some examples
Here are some easy examples to use the Multi Timeframe Mobile Average
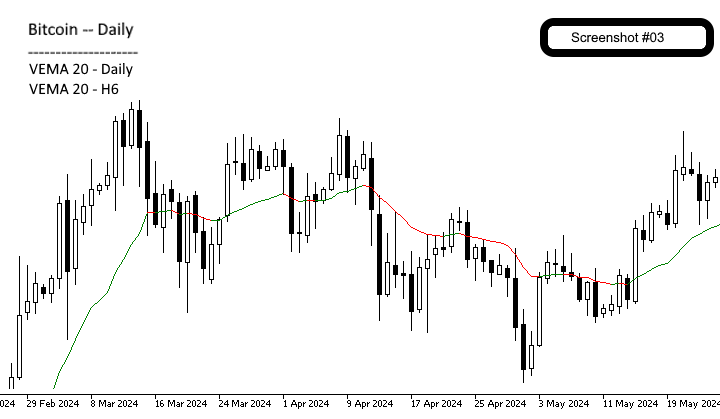
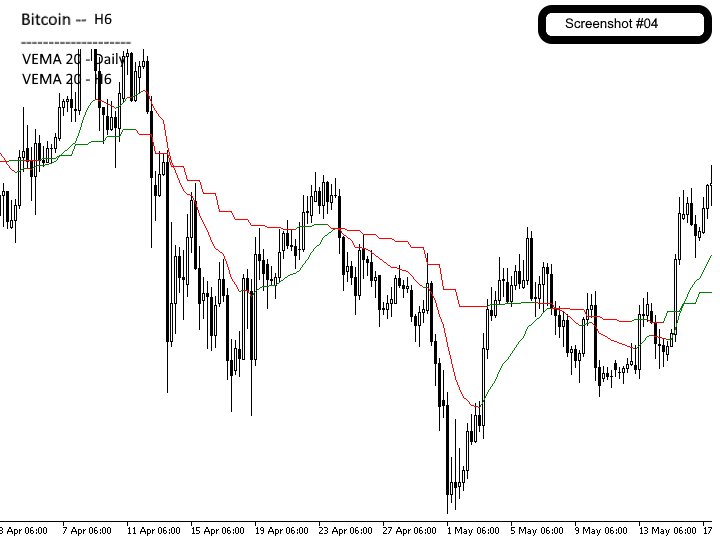
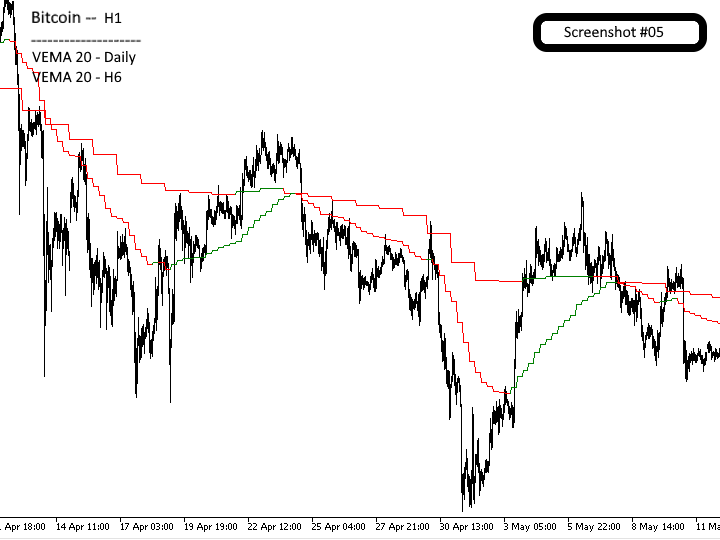
Example on bitcoin
Add 2 mobile averages 20, one on the Timeframe Daily and one on the H6 and see in H1
**** See Screenshot from 3 to 5
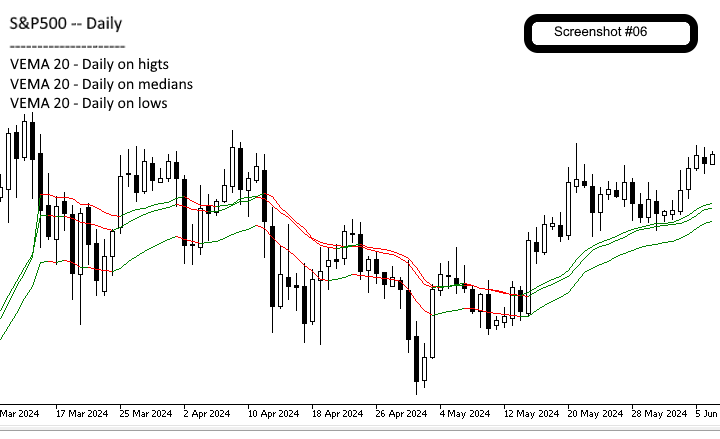
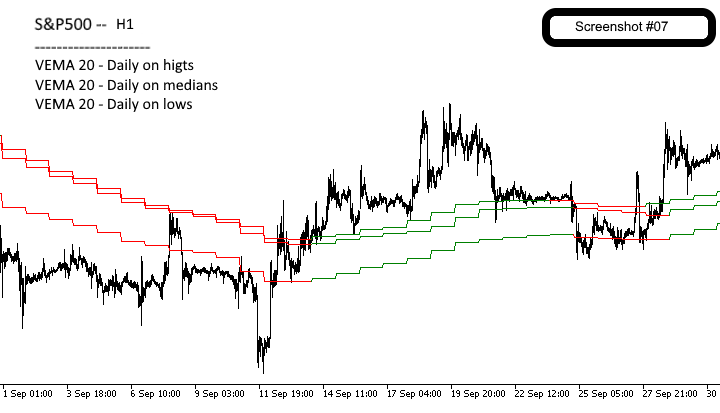
Example on the S & P500
Add 3 mobile averages 20 periods on the Daily applied to High, Median prices and look in H1
**** See Screenshot from 6 to 7
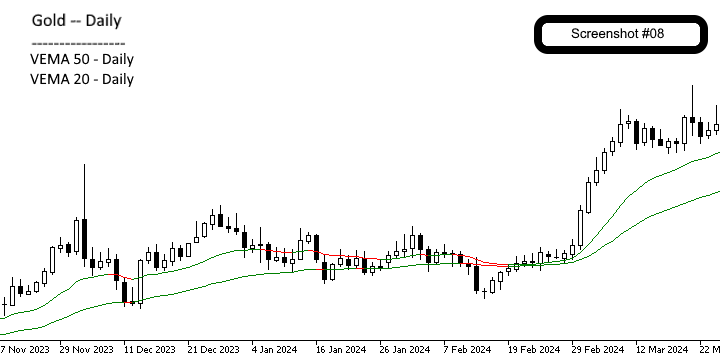
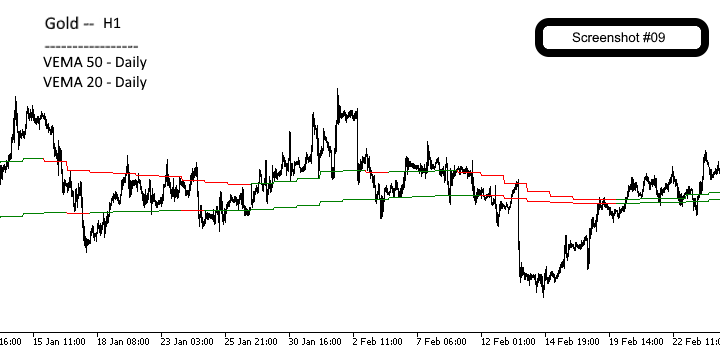
Example on gold
Add 2 mobile averages 50 and 20 periods on the Daily and look in H1
**** See Screenshot from 8 to 9
Yours
Share your use settings and find out how other traders use this indicator to optimize their strategies!
===> for whom?
Whether you are a discretionary trader, algorithmic trader or developer, the indicator is designed to meet your needs. I understand the importance of reliability and efficiency when money is at stake, and I take this responsibility very seriously.
The indicator consumes few resources on your PCs or VPS. For algorithmic traders and developers, I offer full access to the two buffers: the Buffer 1 for the average values and the Buffer 2 for the orientation of the average.
===> Why?
Mobile averages have been used for a long time. They mainly serve to define the trend and the ranges.
For your Advisors (EA) experts, your indicators, or you can then make decisions more easily and more enlightened.
===> The development rules applied
Naming of variables => All variables are named in a coherent and descriptive manner, facilitating the understanding and maintenance of the code.
Minimum use of global variables => very few global variables are used.
Low memory consumption => The indicator is designed to consume little memory, guaranteeing optimal performance.
Initialization of variables => All variables are initialized, which minimizes unexpected behavior and reinforces the stability of the code.
Optimization of Boucles => All loops are optimized to ensure an effective course, thus increasing the speed of calculations.
Limitation of the number of loops =>: the number of loops has been reduced by combining several treatments.
Error management => All feedback is carefully managed to detect and process any errors, thus ensuring maximum reliability.
Limitation of the size of the logs => a procedure limits the writing of repetitive messages, thus avoiding the overload of newspapers and facilitating debugging.
===> a robust code
It is essential to have a robust code that works permanently. In the event of a problem, clear errors messages are provided. Despite these systematic controls, the indicator remains rapid thanks to the optimization of data paths.
===> How was it done?
Not based on the native IMA function (): the indicator is built independently of the native IMA () function.
Principles of the Applied POO: Although not written in POO, the principles of object -oriented programming are applied for functions of functions.
Operation outside the market: it even works on symbols outside the market. One click on another timeframe may be necessary for the refreshment of the display.
Department management: in the event of an internet cut or server problem, the indicator indicates it, recharges all history and redo all calculations.
Reactivity: very reactive, without redrawing, the indicator is updated to the nearest tick, crucial for cryptocurrencies or very volatile symbols.