Regardez les tutoriels vidéo de Market sur YouTube
Comment acheter un robot de trading ou un indicateur
Exécutez votre EA sur
hébergement virtuel
hébergement virtuel
Test un indicateur/robot de trading avant d'acheter
Vous voulez gagner de l'argent sur Market ?
Comment présenter un produit pour qu'il se vende bien
Expert Advisors et indicateurs pour MetaTrader 4 - 47
This is a general purpose indicator that displays colored lines at fixed and customizable price intervals, entered as parameters. It offers universal, constant, and familiar price ranges that allow quick and precise price analysis of a currency pair. With default parameters, this indicator implements The Quarters Theory , as described originally by Ilian Yotov . [ Installation Guide | Update Guide | Troubleshooting | FAQ | All Products ] Easy to use No optimization needed Customizable price inte
FREE
After purchasing, you can request and receive any two of my products for free!
После покупки вы можете запросить и получить два любых моих продукта бесплатно! The trading robot is designed for trading in the Forex market. Safety in trading: constant stop loss, take profit, protection from increased spread. The advantage of the advisor is trading Money Management (money management system) automatic lot calculation based on the size of your deposit, automatic installation and movement of Fibona

This BetMarsEA2 can trade BTCUSD and XAUUSD. It can trade one of them individually or both at the same time.
When two currency pairs trade, a hedging strategy is used. Use trend strategy when trading separately. The parameters are as follows:(these parameters are reserved. Please do not modify them. What can be changed is CurrentSymbolFlag. MaximumRisk =0.02; DecreaseFactor=3; MovingPeriod =12; MovingShift =6; CurrentSymbolFlag=true When the parameter CurrentSymbolfFlag = true, only the

Real Trade négocie sur des délais inférieurs à 1 heure. Tradez dans les directions haussières et baissières. Négociez avec les directions de tendance temporelle les plus élevées et négociez la première bougie. Utilisez le contraire pour sortir ou utilisez le ratio pour sortir 1:1 ou plus avec des arrêts de fuite. Négociez les tendances réelles pendant les heures actives et avec une direction de tendance plus élevée pour obtenir les meilleurs résultats. Indicateur de charge dans le testeur pour

The EasyTrend is a seemingly simple but quite powerful trend indicator. Everyone has probably come across indicators or Expert Advisors that contain numerous input parameters that are difficult to understand. Here you will not see dozens of input parameters, the purpose of which is only clear to the developer. Instead, an artificial neural network handles the configuration of the parameters.
Input Parameters The indicator is as simple as possible, so there are only 2 input parameters: Alert -

The Stoch_bot Expert Advisor is a simple robot for trading from overbought/oversold levels based on the Stochastic indicator.
For the convenience of traders, many features have been added to make trading more comfortable and secure.
The Expert Advisor has a built-in author's indicator of protection against unidirectional grid.
Recommended tools : USDCHF; GBPUSD;
EURUSD;
USDJPY;
USDCAD;
AUDUSD;
EURJPY;
recommended minimum mm and settings: usdchf, deposit = $ 1000 , lot = 0.01 ,
FREE

Advantages: Based on classic indicators - ATR, Moving Average Determines the trend / flat in the market by coloring the histogram with the appropriate color Arrows indicate confirmed signals It is an excellent filter for channel strategies (by extremes)
Settings:
Наименование Описание настройки Period of Flat Detector Number of bars / candles for analysis Period of EMA Period of EMA (Moving Average) Period of ATR Period of ATR (current timeframe) Coefficient of deviation Coefficient of devia
FREE

YOU CAN NOW DOWNLOAD FREE VERSIONS OF OUR PAID INDICATORS . IT'S OUR WAY OF GIVING BACK TO THE COMMUNITY ! >>> GO HERE TO DOWNLOAD
Momentum channel is a simple momentum based system yet with a great degree of accuracy in detecting turning points. The market momentum are defined by Average True Range Channels . When price breaks these channels most times , it is an indication of a shift in market momentum and thus a possible new trend formation. The system can be traded on any time frame an
FREE
Tipu Trader is a part of Tipu Panel ecosystem that was developed out of need for quick and simple trading. Tipu Trader is an easy to use trade panel for commonly used trade functions. Create you own signals with Tipu Panel and trade along with Tipu Trader, a simple and easy to use trade panel.
Features An easy to use trade panel for most commonly used trade functions. Create your own personal trade signals with Tipu Panel , and trade with Tipu Trader. Customizable Panel. The panel can be moved
FREE

"The trend is your friend" is one of the best known sayings in investing, because capturing large trendy price movements can be extremely profitable. However, trading with the trend is often easier said than done, because many indicators are based on price reversals not trends. These aren't very effective at identifying trendy periods, or predicting whether trends will continue. We developed the Trendiness Index to help address this problem by indicating the strength and direction of price trend
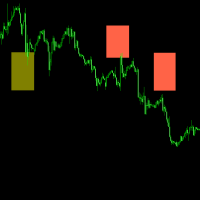
The indicator is very effective in currency exchange, for example EURUSD GBPUSD AUDUSD NZDUSD USDCHF USDCAD and it is very easy to identify the position of top and bottom. Suggest using it on the MT4 platform of SwissQuote Bank.
SwissQuote Link: https://trade.swissquote.ch/signup/public/form/full/fx/com/individual?lang=cn&partnerid=daf9af43-2f95-443e-86c5-89ce1ab2bd63#full/fx/com/individual/step1
Exness Link: https://one.exness.link/a/t2v0o2v0
With a little understanding of trading and the
FREE

The utility places a grid of pending orders. You can select the number of orders in the grid, the step between orders, multiplier for the order size, SL and TP levels and the magic number. MT5 version of the utility is avaliable by the link - https://www.mql5.com/en/market/product/73489 If you like this utility, take a look at my other products - https://www.mql5.com/en/users/nina_yermolenko/seller
FREE

As the title says, this is an indicator that shows the current open market (session). It has 4 sessions with customizable schedule : 1. London session, 2. New York session, 3. Sydney session, 4. Tokyo session.
Indicator inputs: - The color of each session. - The open time and close time of the sessions. - The line width.
The objective of the indicator, is to follow each sessions, observe at what times are multiple sessions open, and thus take the chance of the high market movements.
FREE
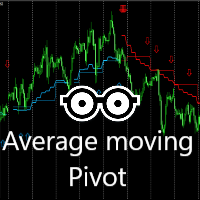
This indicator is very effective for trading everyday. A combination of moving averages and 2X Pivots calculation to produce a very convincing signal everyday. Blue colour signals a buy opportunity. Follow the arrows for possible buy points. The Blue pivots and average line, serves as possible support. Red colour signals a sell opportunity. Follow the arrows for possible sell points. The Red pivots and average line, serves as possible resistance. Best use on the 15 minutes, 30 minutes or 1 hour
FREE

Advanced Currency Strength Indicator
The Advanced Divergence Currency Strength Indicator. Not only it breaks down all 28 forex currency pairs and calculates the strength of individual currencies across all timeframes , but, You'll be analyzing the WHOLE forex market in 1 window (In just 1 minute) . This indicator is very powerful because it reveals the true movements of the market. It is highly recommended to analyze charts knowing the performance of individual currencies or
The Symbol Changer Indicator for MT4 is an amazing tool to switch and display any desired currency pair chart and any time frame. Forex traders can display the desired charts with the click of a mouse directly from any open chart. The symbol changer indicator for Metatrader is an essential tool for trend traders working with a top-down approach.
The symbol changer indicator shows all the available trading instruments in the market watch window. It also displays all the currency pairs as butto
FREE
This EA opens a buy sell order based on the H4 trend. When the price goes over 100 pips ea keep opening orders against the price until the profit is positive and EA will close all orders and continue the new round. Requirement - Flatform: MT4 - Symbol: XAUUSD. - Time frame: M15 - Minimum deposit: >500$ - Leverage: 1:500 and higher - ECN broker - Virtual Private Server hosting (VPS) Parameters
FREE

There is a very simple and surprisingly effective indicator called Pi Cycle, which starts to give the first warning. It is worth a look, so as not to miss the giant elephant in the living room!))
What is Pi Cycle?
Pi Cycle is a very simple indicator created by analyst Philip Swift . It takes into account two (DMA biased moving averages ): 350-day average x 2 111-day average Both can be considered long-term indicators. The second one is obviously more sensitive to current market changes, sin
FREE

The Buffer Reader will help you to check and export the custom indicators buffers data for your current chart and timeframe. You can select the number of buffer and historical bars to read/export. The data can be exported in a CSV format and the files will be stored in the folder: \MQL4\Files .
How it works Put the number of buffers to read in the Buffers_Total input parameter. Put the number of rows to display in the Rows_Total. Choose the CSV separator in the parameter. Copy the correct name
FREE

The panel has the most intuitive interface that every beginner can handle. In the SLp column – you need to specify the SL size in pips. If the value turns gray and at the same time the Bay / Sell buttons are also inactive, then you have specified a SL value that is less than that allowed before it was set by your broker. In the TP% column – you indicate TP in% of the account balance. In the settings, you can choose on the basis of what this indicator will be calculated, by equity, balance or
FREE
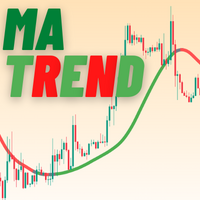
MATrend indicator makes the directional trend of the current market easily recognizable. Settings: MA Period : The amount of candles taken into consideration for the calculation of the moving average; MA Method : The method used for the calculation of the moving average. Selectable methods are: Simple averaging;
Exponential averaging;
Smoothed averaging;
Linear-weighed averaging; Usage: The color of the indcator will change based on the slope of the MA. Green : The indicator has a bullish
FREE

This scanner shows the trend values of the well known indicator SuperTrend for up to 30 instruments and 8 time frames. You can get alerts via MT4, Email and Push-Notification as soon as the direction of the trend changes. This is the FREE version of the indicator: SuperTrend Scanner The free version works only on EURUSD and GBPUSD!
Important Information How you can maximize the potential of the scanner, please read here: www.mql5.com/en/blogs/post/718074
With the following FREE indicator you
FREE
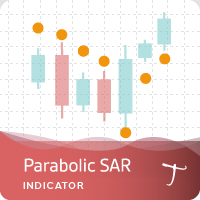
Tipu Parabolic SAR Panel is the modified version of the original Parabolic SAR indicator published by MetaQuotes here . Dashboard Panel (multi symbol) version for this indicator is available here .
Features An easy to use Panel that shows the Parabolic SAR trend and signals of selected timeframe. Customizable Buy/Sell alerts, push alerts, email alerts, or visual on-screen alerts. Customizable Panel. The panel can be moved to any place on the chart or minimized to allow more space. To enable th
FREE

'Circle Rising Point' is an indicator based on the cycle theory. No matter whether your trading cycle is short or long, you can use this indicator to find the rise and fall points of different cycles and different bands. Therefore, the signals displayed to you on charts of different cycles are different, and applicable to left side transactions. This indicator is recommended to be used together with the multi cycle window for analysis. Indicator introduction Applicable products This indicato
FREE

This indicator applies the biquad high pass filter to the price-chart data, and displays the filter output for the OHLC as candlesticks. The candlesticks corresponds to the actual calculations of the filter value during the formation of each price bar (not from all historical highs lows or closes). The shape of the bars therefore corresponds directly to the shape of each price bar. High pass filters are an underappreciated type of oscillator that are seldom used in technical analysis in the st
FREE

Big summer sale. Save up to 40% on my products. ADR dashboard - save 9$! The intention of the dashboard is to provide a quick overview of the daily, weekly and monthly range of configured assets. In "single asset mode" the dashboard shows you possible reversal points directly in the chart, thus making statistics directly tradable. If a configured threshold is exceeded, the dashboard can send a screen alert, a notification (to the mobile MT4) or an email. There are various ways of using this inf

Multicurrency and multitimeframe modification of the Commodity Channel Index (CCI) indicator. You can specify any desired currencies and timeframes in the parameters. Also, the panel can send notifications when crossing overbought and oversold levels. By clicking on a cell with a period, this symbol and period will be opened. This is MTF Scanner. The key to hide the dashboard from the chart is "D" by default.
Parameters CCI Period — averaging period.
CCI Applied price — price type.
Clear

Vertical time lines. A simple indicator that draws on the graph vertical lines of time. 1,3,5,10,12,15,20,30,60 minutes. You can change the line color, line style, select a time period from 1 to 60 minutes. Applies to any chart, timeframe. Incoming parameters: Minute_Num = 20; // step 3,5,12,10,20,15,30,60 minutes color Line_Color = clrYellow; // color line Line_Dash = 2; //0,1,2,3,4... solid, dash, dot, dash dot,dash dot dot
FREE

The indicator is a 15-minute signal indicator for all types of traders. Meaning, you could make lots of profits trading two different signals in one indicator.
NOTE: Both indicators are channels for achieving the same result. RED ARROW -- Sell Signal BLUE ARROW -- Buy Signal
Purchase now to be part of our community. We offer standard chart setups for both novice and intermediate traders. Trade with ease!
FREE

Forex trading support timer: - This is an indicator that supports a trader's trading process. - Before placing a BUY or SELL order, it is advisable to observe what the current time is like, to get the best position when trading. Function of indicator: - Display information about candle closing time of different timeframes (M1,M5,M15,H1), best used when Scalping. - Show market spreads. - Show TimeZone Trading. - Displays the remaining time of a session.
FREE

THIS FREE INDICATOR ALLOWS YOU TO SET THE TIMEFRAME OF THE MA YOU WANT ON YOUR CHART For example, it's very useful if you want to trade the H4 200 SMA using a lower timeframe chart, to identify price reactions such as reversals, Wyckoff schematics, etc. ***Please comment, rate and share it to your friends if you like it*** ------------------------------------------------------------------------- Moving averages are popular technical indicators used to identify trends, support and resistance leve
FREE

Discover: The Quantum Forex Trading System _Mastering the Market with Advanced Algorithms & Multifaceted Strategies_ ---This system requires you to install https://www.mql5.com/en/market/product/104637 for trading signals to be generated. Redefining Forex Trading: In the vast realm of forex, where uncertainty is the only certainty, what if you had a tool that seamlessly combined the best trading strategies into one efficient system? Enter the Quantum Forex Trading System — a harmonious blend
FREE

Manually backtesting your strategy or trading system on MT4 Strategy Tester like you do on TradingView, but with free offline history data provided by MT4 or your broker, which means more resposive and much more lower timeframe data available. Because MT4 Strategy Tester doesn't detect mouse events, we will use the MT4 Horizontal Line tool and Arrows tool to modify the TP/SL/Entry and etc. on the screen.
Features:
70% TradingView backtesting user experience, due to the Strategy Tester's li
FREE

Necessary for traders: tools and indicators Waves automatically calculate indicators, channel trend trading Perfect trend-wave automatic calculation channel calculation , MT4 Perfect trend-wave automatic calculation channel calculation , MT5 Local Trading copying Easy And Fast Copy , MT4 Easy And Fast Copy , MT5 Local Trading copying For DEMO Easy And Fast Copy , MT4 DEMO Easy And Fast Copy , MT5 DEMO Fibo: from KTrade 1. Automatically calculate and analyze the band. -> Get the desired band 2.
FREE
The Expert Advisor tool has been developed for NQ (Nasdaq), based on break logic and trend filter. The stop loss is based on fixed pips. It has been backtested on more than 10-year long on M1 data with high quality of modeling. The enclosed screenshots demonstrate the complexity and coverage of the test by Monte Carlo analysis with 200 simulations. The Expert Advisor passed via Cluster Analysis, Optimization profile, System parameter Permutation . There is no need to set up parameters - al
FREE

VANEXIO USES THE TREND WAVE INDICATOR AND IT CAN IDENTIFY THE BEGINNING AND THE END OF A NEW WAVE TREND MOVEMENT.
AS AN OSCILLATOR, THE INDICATOR IDENTIFIES THE OVERBOUGHT AND OVERSOLD ZONES.
IT WORKS GREAT TO CATCH THE SHORT TERM PRICE REVERSALS AND USES A MARTINGALE STRATEGY TO CLOSE ALL TRADES IN PROFIT.
USE DEFAULT SETTINGS ON H1 OR HIGHER TIME FRAME ON ANY PAIR FOR MORE ACCURATE TRADES
WHY THIS EA :
Smart entries calculated by 5 great strategies The EA can be run on even a $20000
FREE

This indicator helps you to find overbought and oversold prices based on William %R. Input Description: Wperiod: Period for %R indicator. OverBoughtLevel: Define the overbought level for %R. Must in between 0 and -50. OverSoldLevel: Define the oversold level for %R. Must in between -50 and -100. middle_value: When true, indicator also draw the middle points between upper and lower line. shift: Set an additional offset to the indicator.
Several Notes: Set 0 and -100 as Overbought and Oversold le
FREE

Overview No Nonsense ATR is a tool designed to help the No Nonsense Forex Traders backtest strategies and trading in real time.
The indicator calculates the value of the Stop Loss and the Take Profit (SL/TP) based on the ATR (Average True Range) allowing to verify the historical data in a simple and practical way, showing not only the SL/TP values but also the place where they would be and if it was a gain or loss. The No Nonsense ATR also calculates the trading volume required for each trade
FREE

This is an implementation of the market cycle indicator described by Raghee Horner in the book "Forex Trading for Maximum Profit" . The current state of the market can be determined by analyzing the inclination angle of the exponential moving average (EMA) running on a period of 34 bars. If the EMA inclination is defined as the direction of the hour hand on the dial from 12 to 2 hours, then an uptrend is considered to be present; from 2 to 4 hours, the market consolidates; from 4 to 6 hours, a d
FREE

EA will trade base on manual entry. It will do martingale if your position in losses. There are no backtests available. This is a semi-automated EA that requires human intervention or initial order to be triggered by user. The main purpose of this EA is to open trade in the same direction with bigger lot size when initial trade losses. It is barely impossible for human being to trade like this 24 hours a day. This technique is well known to many trades and many use it to recover their losses. Ho
FREE
Arrow Indicator Trade EA is an Expert Adviser who trades based on custom indicators. When the indicator shows an arrow up, EA will enter into an OP BUY order. Likewise, when the indicator shows an arrow down, EA will make an OP SELL entry. Features: 1. Stop Loss and Manual and Auto TP based on the ATR indicator. 2. Auto Lot and Fixed Lot. 3. Close By Loss and Close By Profit features. 4. Target Profit Balance and Minimum Stop Balance 5. Easy to use. EA does not generate its own signals but gener
FREE

NearTheMarket is a fully automated trading EA with an excelent predicting criteria to enter into Market. First it opens market orders, buy or sell, with a predefined Take Profit. If after a specified time the trade is still open, the robobot deletes the Take Profit and opens a limited order with a lots amount equal to a multiple of lots of the market order. The mission of the robot is to get the PayOffPrice (average price of the net position) closer to market price. Again, if open orders are on
FREE
The purpose of this new version of the MT4 standard indicator provided in your platform is to display in a sub-window multiple timeframes of the same indicator. See the example shown in the picture below. But the display isn’t like a simple MTF indicator. This is the real display of the indicator on its timeframe. Here's the options available in the FFx indicator: Select the timeframes to be displayed (M1 to Monthly) Define the width (number of bars) for each timeframe box Alert pop up/sound/ema
FREE

IceFX Heatmap is a special indicator that shows the places where the price has been staying and ranging over the past few days. These sites will be displayed in a "Heatmap style", with which you can clearly see the main formed bands. The main rates (where the price has "lingered/stayed" much) are indicated in bright colors (in case of black-and-white view) or red color (in case of color view).
Settings Days - the number of days the heat(map) is calculated for. Resolution - resolution rate. 10
FREE

Diversify the risk in your trading account by combining our Expert Advisors. Build your own custom trading system here: Simple Forex Trading Strategies
The expert advisor opens trades when EMAs cross and the Average Directional Index is above 25. The Stop Loss, Take Profit, and Trailing Stop are calculated based on the ATR indicator. The recommended currency pair is GBPAUD. The recommended timeframe to operate and to do backtests is D1. This Expert Advisor can be profitable in any TimeFrame
FREE
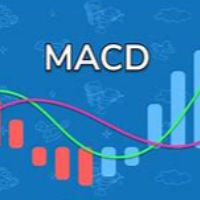
This is a custom indicator based on the Exponential Moving Average (EMA) angle, typically used to measure the trend angle of EMA lines. Here are the main parameters and functions of this indicator: Main Parameters: md1: Fast period for EMA, default value is 12. md2: Slow period for EMA, default value is 26. md3: Period for the MACD signal line, default value is 9. Functions: The indicator calculates the MACD indicator and categorizes data into different buffers based on the direction and angle o
FREE

A reversed engineered and improved version of the extremely popular AFSID scalper ( afs-id.com ). Includes re-modeled versions of these 2 well received scalping programs: " AF-Fibo ", and " AF-TrendKiller". Take note that this is a high risk scalper Though improvements have been made to mitigate some of the risks, the risks inherent to martingale scalpers still exists, so use it at your own risk.
afsida Scalper (improved AFSID)
This is a simple martingale scalper which works on any pair
FREE

Everyone knows that the best way to make money in the markets is by knowing the future.
Have you ever wished to know the future price of something in advance?
Even if it were just a few days, hours, or minutes ahead?
What if it were possible to know it but with less than a second of advance notice? That's precisely what the PZ Latency Arbitrage EA robot does. PZ Latency Arbitrage EA is your personal time machine: but it can only travel into the past by less than a second. The robot is like Bi

Expert description
The Expert Advisor's trading system is based on entry and exit at a certain deviation of the asset price from the moving average value. The Expert Advisor has a number of parameters, by manipulating which you can implement different trading systems and also get different results when trading on different assets, keep this in mind when setting up an Expert Advisor and do not use standard settings on all instruments and time frames.
Recommendations for use
The EA working t
FREE

Telegram Notifier is a simple and powerful utility which sends notification, news from MT4 to Telegram channel and group. Official Telegram Group: https://t.me/ezforex_telegram_notifier WHO WILL NEED THIS UTILITY 1. EA Sellers who want to manage automatically their private channel and chat group.
2. Signal Providers who want to send the signals, reports and news to the channel or chat group. CORE FEATURES
1. Can use with View Account and not need to enable the Auto Trading button.
2. Track
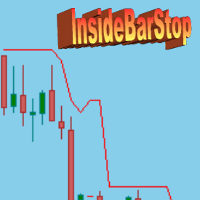
This indicator can be used to show and evaluate the trailing stop algorithm "Trailing Stop with Inside Bars" that was proposed by the famous German trader and author Michael Voigt ("Das grosse Buch der Markttechnik") to capture robust gains when trading strong price moves. The trailing stop price is shown as a red line. You can start the trailing stop anywhere on your chart (bars or candles) by setting the "initialBarDateTime" input parameter to the open time of an arbitrary candle You can speci
FREE

Hello. Another free indicator from Sepehr! ;) You can determine the trend with this tool. Using crosses of two Moving averages, you can say that the trend is going to be bullish or bearish; A fast-moving average and a slow one. When the fast-moving crosses up the slow-moving, it's going to be an uptrend and when it crosses down the slow-moving, it means that you are going to have a downtrend. That's easy ;) Hope to enjoy it Sepehr(Faran)
FREE
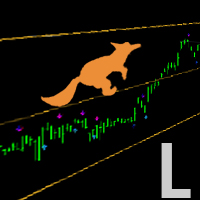
Simple but powerfull Trend and Hedge EA for Lisek Levels and Channels Indicator . 1. Download Lisek Levels and Channels Indicator . 2. Backtest and optimize in Strategy Tester. 3. For Agressive Tick Mode set your Chart to M1 Time Frame. 4. To speed up Strategy Tester, set "Show Info" to false ! 5. After backtesting, it’s important to analyse the test results (best profit and smallest drawdown). 6. Test your EA settings on Demo Account. Happy Trading !!!
FREE

Il nostro Indicatore Combinato RaysFX CCI-RSI è uno strumento unico che combina due dei più popolari indicatori di analisi tecnica: l’Indice di Forza Relativa (RSI) e l’Indice del Canale delle Materie Prime (CCI). Caratteristiche : Combinazione di CCI e RSI : L’indicatore calcola la differenza tra i valori di CCI e RSI per ogni barra del grafico. Media Mobile Semplice (SMA) : L’indicatore calcola una SMA su queste differenze e traccia due linee sul grafico. Segnali di trading : Ogni volta che qu
FREE

This indicator shows the strength of each currency compared to the US dollar by calculating the rate of change in price over a specified time period. When you open the indicator, you'll see a list of different currencies on the price chart. Each currency will have a numerical value indicating its strength level compared to the US dollar, where: If the value is higher than the US dollar, it will be displayed in green, meaning that currency is stronger than the dollar. If the value is lower than
FREE

The Expert Advisor of the Forex Fraus family, the system is designed for scalping the EUR/USD pair on the M1 timeframe (for five digit quotes), and adapted for the accounts with fast execution of orders.
Operation Principle Buys at the extreme Lows and sells at the extreme Highs of the Stochastic indicator values. When a signal is received the orders are opened by injection, using tick data. Positions are closed by Trailing Stop Not closed positions are closed at the opposite trade Built-in ad
FREE

The Stochastic RSI indicator (StochRSI) is essentially an indicator of an indicator. It is used in technical analysis to provide a stochastic calculation to the RSI indicator. This means that it is a measure of RSI relative to its own high/low range over a user defined period of time. The Stochastic RSI is an oscillator that calculates a value between 0 and 1 which is then plotted as a line. This indicator is primarily used for identifying overbought and oversold conditions.
FREE

Check my p a id tools they work perfect please r ate Adjustable PIN BAR indicator is usefull tool alowing to search for pin bars you wish to find on the price chart, it has 2 parameters to filter out what type of pin bars you wish to search for: 1) MinTailProc 75% (default) which means to show pin bars that has minimum size of the Nose (Tail) as 75% of full candle size. If Upper Nose (Tail) size of the candle is minimum 75% of the candle size fully than candle is painted in RED. If Lower Nose
FREE

Moving Average Dashboard Bars ago is a unique multi currency, multi time frame dashboard. The dashboard is very simple. You select two moving averages, the instruments and timeframes The Moving Average Dashboard Bars ago then shows how how many bars ago the moving averages made a bullish or bearish crossover. It also shows you in real time when there is a bullish or a bearish crossover. The indicator plots in a subwindow. The Moving Average Dashboard Bars ago can be beneficial if you are trading
FREE

1. Compound Drawings (1) Line segment with arrow (2) Continuous line segment (broken line) (3) Parallelogram (4) Polygon (5) Profit and loss ratio measurement tools
2. Backtracking By the Z key in the process of drawing the line Line types that support Z-key backtracking: continuous line segments (broken line) ,channels,parallelograms,polygons, and fibo extensions.
3.Automatic Adsorption (1) Click the "Lock-Button" to switch the automatic adsorption switch before drawing the line (2)

A signal indicator consisting of several well-known indicators that process data sequentially. 2 options - for schedule and basement. In the settings it is possible to enable alerts about the change of trend (alerts) sound, by e-mail and push. It is possible to change the colors and thickness of the lines, the colors and codes of the arrows, the number of calculation bars and separately configure the parameters included in the indicators.
FREE

Expert advisor based on your own personal moving average strategy. Whatever your strategy is, it's him. You can use it on all parities. No restrictions. Settings : Buy Settings 1.Moving Average Period 1.Moving Average Method 2.Moving Average Period 2.Moving Average Period Buy Lot Size Buy Stop Loss Level Buy Take Profit Level
Sell Settings 3.Moving Average Period 3.Moving Average Method 4.Moving Average Period 4.Moving Average Period Sell Lot Size Sell Stop Loss Level Sell Take Profit Level
FREE
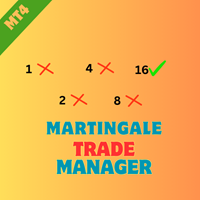
Product Name: Martingale Trade Manager Description:
The "Martingale Trade Manager" EA is designed to manage trades using a Martingale strategy. It checks the result of the last trade and, if it was a loss, immediately places an opposite trade. This process is repeated until a profitable trade is achieved. The initial trade can be placed either manually or by another EA. If the trade is placed by an EA, the magic number check should be enabled. General Settings: EA Name (EA_NAME): Name of the E
FREE

The " Multi Kernel Regression " is a versatile trading indicator that provides graphical interpretations of market trends by using different kernel regression methods. It's beneficial because it smoothes out price data, creating a clearer picture of price movements, and can be tailored according to the user's preference with various options.
What makes this indicator uniquely versatile is the 'Kernel Select' feature, which allows you to choose from a variety of regression kernel types, such
FREE

*This is tradingview indicator converted to mql4*
The Chandelier Exit Indicator is a popular technical analysis tool developed by Chuck LeBeau. It is designed to help traders identify potential exit points for their trades based on market volatility and the concept of trailing stops. The Chandelier Exit Indicator consists of three main components: Average True Range (ATR): The indicator utilizes the Average True Range, which measures market volatility. The ATR calculates the average range bet
FREE

The MP Andean Oscillator is used to estimate the direction and also the degree of variations of trends. It contains 3 components: Bull component, Bear component and Signal component. A rising Bull component indicates that the market is up-trending while a rising Bear component indicates the presence of down-trending market. Settings: Oscillator period: Specifies the importance of the trends degree of variations measured by the indicator. Signal line per: Moving average period of the Signal line
FREE

In the world of finance, correlation is a statistical measure of how two securities move in relation to each other. Correlations are used in advanced portfolio management. This indicator measures how different securities move in relation to a reference one, thus making portfolio management easier. [ Installation Guide | Update Guide | Troubleshooting | FAQ | All Products ] Avoid concurrent trades in highly correlated instruments Find trading opportunities among highly correlated instruments Cor
FREE

This EA can't run in the same account. If you want an Expert Advisor that trades daily this is not because it requires patience to wait for a few days or weeks on the right opportunity for it to trade. It takes advantage of the volatility of the price movement.
This is a fully automated scalping Expert Advisor that can be run successfully using EURUSD currency pair at H1 timeframe.
FREE

FuturePriceM15 - один из немногих индикаторов, который делает прогноз цены прямо на ценовом графике. Алгоритм расчета индикатора основан на быстром преобразовании Фурье. Имея колебательное поведение цены, функция Фурье прогнозирует ее поведение в дальнейшем. Индикатор устанавливается обычным образом на график с торговым инструментом указанным в переменной symbol с периодом M15 , данный временной период является самым оптимальным для работы с любыми торговыми символами. После установки, индикато
FREE
En s'adaptant à la volatilité, les positions de trading de Risque potentiel pour récompenser sont affichées sur la base de la Fourchette réelle moyenne. Les cases Risque-Récompense sont affichées lorsque le bouton "Acheter ou Vendre" est cliqué! Une utilité du calcul de l'ATR, réjouissez-vous d'une question qui ne fait pas partie d'une décision difficile pour savoir quand fermer une transaction. Cette question aiderait votre décision de gestion des risques.
Spécification La fourchette vraie
FREE
Le MetaTrader Market est un magasin unique de robots de trading et d'indicateurs techniques.
Lisez le mémo de l'utilisateur de MQL5.community pour en savoir plus sur les services uniques que nous offrons aux traders : copie des signaux de trading, applications personnalisées développées par des freelancers, paiements automatiques via le système de paiement et le MQL5 Cloud Network.
Vous manquez des opportunités de trading :
- Applications de trading gratuites
- Plus de 8 000 signaux à copier
- Actualités économiques pour explorer les marchés financiers
Inscription
Se connecter
Si vous n'avez pas de compte, veuillez vous inscrire
Autorisez l'utilisation de cookies pour vous connecter au site Web MQL5.com.
Veuillez activer les paramètres nécessaires dans votre navigateur, sinon vous ne pourrez pas vous connecter.