Regardez les tutoriels vidéo de Market sur YouTube
Comment acheter un robot de trading ou un indicateur
Exécutez votre EA sur
hébergement virtuel
hébergement virtuel
Test un indicateur/robot de trading avant d'acheter
Vous voulez gagner de l'argent sur Market ?
Comment présenter un produit pour qu'il se vende bien
Expert Advisors et indicateurs pour MetaTrader 4 - 41

C'est le secret pour gagner des transactions OR grâce à "20 ans d'expérience de trader senior" === Ces 5 exemplaires ne valent que 1$ par jour et doubleront à la dixième vente. === Aperçu de l'OR. Dans sa grande tendance, l’OR a toujours enregistré des hausses et a toujours battu son plus haut historique à plusieurs reprises. Cette clé de trading GOLD nous a été révélée par un trader senior qui a plus de 20 ans d'expérience sur le marché. Ensuite, nous avons conçu cette EA et voilà. === Cette EA
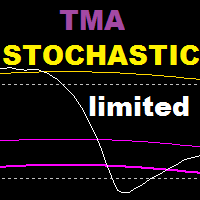
TMA Stochastic is an indicator based on stochastic oscillator and tma bands indicator , this indicator is based on a reversal strategy . Recommended time frame : 15 and above Recommended settings : lower values for scalping , higher values for swing trading WORKS ONLY ON EURUSD , GET THE FULL VERSION : https://www.mql5.com/en/market/product/108378 ======================================================================= Parameters : tma history : how many bars back to show tma bands on stochas
FREE

RaysFX EMA Crossover Scopri i potenziali punti di inversione del mercato con l’indicatore di Crossover EMA di RaysFX. Questo indicatore utilizza una combinazione di due medie mobili esponenziali (EMA) - una più veloce e una più lenta - per identificare i possibili punti di ingresso e uscita. Caratteristiche principali : Due EMA : Utilizza una EMA più veloce e una più lenta per catturare i movimenti di mercato a breve e lungo termine. Segnali di crossover : Genera un segnale quando l’EMA più v
FREE
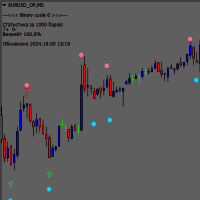
L'indicateur Binary Cucle 6 est un oscillateur puissant pour le trading d'options binaires sur la plateforme MetaTrader 4. Il est conçu pour fonctionner sur des délais à partir de M5 et peut également être utilisé sur n'importe quelle paire de devises.
L'indicateur Binary Cucle 6 fournit des signaux précis pour entrer dans une transaction sous la forme de flèches bleues et rouges qui apparaissent sur le graphique avant la fermeture de la bougie actuelle. Cela permet aux traders de prendre des
REMIS DE 77,90 USD À 37,90 USD VALABLE JUSQU'AU DIMANCHE 1ER SEPTEMBRE Qu'est-ce que "Forex Scanner"? "Forex Scanner" est un outil de trading puissant conçu pour vous fournir une vue d'ensemble complète du marché des changes en temps réel. Cet indicateur avancé recueille des données clés à partir de multiples indicateurs techniques et horizons temporels, vous permettant d'identifier rapidement les opportunités de trading. Si vous souhaitez surveiller de nombreux actifs et paramètres sans avoir à

All patterns from Encyclopedia of Chart Patterns by Thomas N. Bulkowski in one indicator. It draws an up or down arrow whenever a pattern is identified. Patterns are selected in the drop-down list of the Pattern variable (located at the beginning of the properties window). The indicator has numerous external parameters, some of them apply to all patterns, while others are selective. To see more information on the parameters used for the selected pattern, enable the ShowHelp variable (located at

L'indicateur technique Currency Heat Wave Ultimate est un outil précieux qui fournit aux traders des informations en temps réel sur la force des principales devises. Avec son analyse de 28 paires de devises, il offre un aperçu complet de la force des devises directement sur le graphique, ce qui le rend incroyablement pratique à utiliser. En changeant dynamiquement les couleurs, il permet aux traders d'identifier rapidement les positions des devises et de prendre des décisions éclairées. L'un

Le tableau de bord de la force monétaire moyenne mobile est un indicateur puissant et complet qui fournit un aperçu approfondi de la dynamique des devises sur plusieurs symboles et périodes. Cet outil robuste utilise des moyennes mobiles pour identifier les derniers points de croisement et suit efficacement la force des devises jusqu'au prix actuel. Avec sa conception intuitive et son interface conviviale, ce tableau de bord offre une mine d'informations aux commerçants qui cherchent à pren
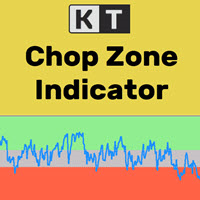
Il est bien connu que les marchés financiers évoluent en tendance seulement 30 % du temps, tandis qu’ils se déplacent dans une plage de consolidation les 70 % restants. Pourtant, la plupart des traders débutants ont du mal à savoir si le marché est en tendance ou bloqué dans une phase latérale. KT Chop Zone résout ce problème en mettant en évidence la phase du marché à travers trois zones distinctes : zone baissière, zone haussière et zone neutre (Chop Zone).
Fonctionnalités
Améliorez instantan
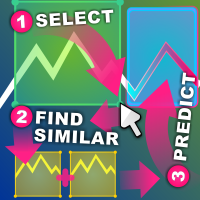
Indicateur d'action de prix similaire L'action de prix similaire trouvera des séquences passées de modèles de chandeliers aussi similaires que possible à une zone du graphique que vous avez sélectionnée.
L'indicateur effectuera une recherche en commençant juste avant le premier chandelier de la région d'action de prix que vous avez sélectionnée jusqu'à la toute première barre la plus ancienne du graphique.
Il existe plusieurs critères pour évaluer la similarité entre 2 séquences : Les séquenc
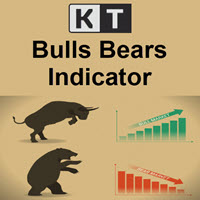
Cet indicateur affiche le régime haussier/baissier du marché en fonction du nombre de barres situées au-dessus et en dessous des zones de surachat/survente du RSI. L'histogramme vert représente la force des haussiers, tandis que le rouge représente la force des baissiers.
Caractéristiques
Peut être utilisé pour ouvrir de nouvelles positions ou pour valider des trades basés sur d'autres stratégies ou indicateurs. Comprend un scanner multi-unité de temps qui analyse la force des haussiers et des
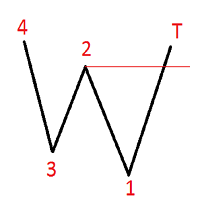
ZigZag Alert The indicator is based on the standard ZigZag.
Displays on the chart and signals the emergence of a certain formed pattern.
At the user's choice, the indicator signals are displayed in the terminal, or an e-mail to the address,
or sends a notification to the mobile terminal. Pattern conditions for the upward movement signal:
the price at point 4 must be higher than the price at point 2, the price at point T must be higher than the price at point 2.
When moving down, on the contrar
The KT Trade Manager is a powerful tool to enhance trade execution and position management. With its user-friendly interface, traders can easily oversee and control their trades. This comprehensive solution encompasses various aspects of trading, including risk management and position management. Integrating these crucial elements enables traders to navigate the financial markets more effectively, making informed decisions and optimizing their trading strategies. As global markets evolve, effic
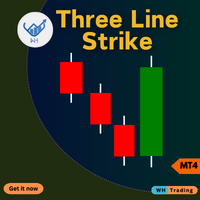
Indicateur de frappe à trois lignes pour MetaTrader 4 (MT4). Cet outil avancé est conçu pour vous aider à identifier les retournements potentiels du marché avec précision et facilité.
Que vous soyez débutant ou trader expérimenté, cet indicateur peut améliorer vos décisions de trading et maximiser vos profits. Contact me after purchase for guidance Principales caractéristiques: Signaux d'inversion précis : Détectez les inversions de tendance potentielles sur la base du modèle de frappe à

Scalp Master Pro. Scalp Master Pro is a cutting-edge Expert Advisor (EA) designed for traders who want to scalp the markets with precision and confidence. Built with advanced ATR-based strategies, this EA dynamically adjusts to market conditions, ensuring optimal managing risk effectively. Whether you're a beginner or an experienced trader, this EA simplifies managing trades and incorporating smart spread adjustments for better execution. Advantages of Scalp Master Pro: Risk Management : Inco
FREE
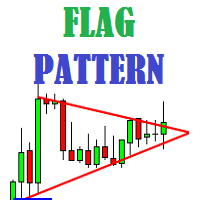
Flag Pattern indicator is an indicator designed to find flag patterns. Bullish and bear find flag patterns. It finds these patterns by its own algorithm. The display is easy to use and simple.
Features Bullish and bear find flag patterns. Draw patterns on the graphic screen. invalid flag patterns. alert the user with the alert feature. Flag patterns have the ability to change colors. Parameters MinSplashHeight - Min. height of splash setting MaxBarsDuration - Max bars before crossing setting

L'indicateur construit un éventail de lignes de tendance (après avoir cliqué sur une certaine bougie), similaire aux angles de Gann classiques. La particularité de l'indicateur est qu'il construit des angles non seulement sur une échelle fixe, mais utilise également le prix moyen d'un certain nombre de barres (facultatif).
Il existe deux façons de calculer le prix moyen des cornières dans l'indicateur (facultatif) :
1) calcul du mouvement de prix moyen (pour un certain nombre de barres) du plu

This outside bar indicator is the opposite of the inside bar. So what this MT4 outside bar indicator does is identifies outside bars for you as they form on your charts. Outside bar is a famous trading pattern in which the bar carry higher high and lower low compared with the previous bar, also known as mother bar. To trade based on Outside Bars, simply place buy stop order above the high price level of a bullish Outside Bar, and sell stop order should be placed below the low price level of a be
FREE

Véritable indicateur de l'offre et de la demande - vous permettra de déterminer rapidement l'emplacement des niveaux de résistance et de support sur toutes les périodes. L'indicateur sera utile pour ceux qui utilisent l'analyse technique dans leur trading. L'indicateur est facile à utiliser, il suffit de glisser-déposer sur le graphique et l'indicateur vous montrera les niveaux de support et de résistance les plus probables. Lorsque vous changez de période, vous verrez les niveaux de la n

Code PTS Demand Index par Precision Trading Systems
Le Demand Index a été créé par James Sibbet et utilise un code complexe pour faciliter l'interprétation du volume et du prix en tant que combinaison.
Comprendre les volumes n'est jamais une tâche facile, mais ce magnifique morceau de programmation simplifie certainement les choses.
Il existe plusieurs façons dont cet indicateur peut bénéficier aux traders et aux investisseurs.
Divergences (en tant qu'indicateur de premier plan) Après avo
Le pyramidage est une méthode permettant d'augmenter la taille d'une position en utilisant les bénéfices non réalisés des transactions réussies comme marge pour les nouvelles. Cet Expert Advisor pyramidera vos transactions sans votre intervention. [ Guide d'installation | Guide de mise à jour | Dépannage | FAQ | Tous les produits ] Pyramidez facilement vos transactions réussies Tirez le meilleur parti de vos transactions gagnantes Comportement pyramidal entièrement configurable Le pyramidage es

Le convertisseur de fuseau horaire convertit automatiquement l'heure d'un graphique en votre heure locale et l'affiche pour vous . Instructions pour le chargement automatique d'un fichier prédéfini :
Cette fonctionnalité est utile si vous ne souhaitez pas que l'indicateur continue de fonctionner, mais que vous souhaitez tout de même le personnaliser et que ces personnalisations s'appliquent lorsque vous ajoutez l'indicateur. Chargez l'indicateur, allez dans les propriétés de l'indicateur et cliq

The Moving Average Crossover Dashboard indicator is a technical tool that displays the crossovers of 2 selected moving averages on the price chart indicating whether it is a bullish or bearish crossover. In addition, as its name indicates, it shows a signal dashboard that indicates in which market and time frame a crossover of the two moving averages occurs. In the setting window the user can select the markets and time frames that can be displayed on the dashboard. You also have the option

SignalPinner is a trend line Indicator which can detect market trends early by including three types of signal arrows. Non repaint and trend following. Signals on the strong trend, signals in the beginning of trend and signals with multiple market analysis algorithm as the main signals. Supported by alert notification message to keep you getting signals while on the go. Symbols: Any Timeframes: Any
Features Histogram buffers as a sign the trend is started. It can help the trader knowing the mar
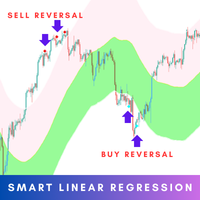
The Smart Linear Regression indicator is a powerful, non-repainting tool designed for traders looking for enhanced accuracy in market analysis. Unlike the typical linear regression channels that often repaint, this indicator provides reliable insights without changing past values, making it more trustworthy for forecasting future price movements. MT5 Version - https://www.mql5.com/en/market/product/124894/ Overview: The Smart Linear Regression Indicator goes beyond the basic linear regression c

NOTE!: The trend vote and the buy sell option shall match to the same direction before you put a trade!!
Indicator that uses Kalman filters (same as used on autonomous vehicles for data fusion between different sensors / technologies such as RADAR, LIDAR and Camera with Artificial Intelligence for object detection) by using the high and low price in order to identify buy and sell signals as indicated on the graph.
This indicator can be used on any timeframe with any currency or symbol.
This i
FREE

Average daily range, Projection levels, Multi time-frame ADR bands shows levels based on the selected time-frame. Levels can be used as projections for potential targets, breakouts or reversals depending on the context in which the tool is used. Features:- Multi time-frame(default = daily) Two coloring modes(trend based or zone based) Color transparency
FREE
Expert Advisor Description EA TugOfWar will open both buy and sell positions at different times according to the triggered signal, the most positions and in accordance with the market direction that will win and profit. Profit target per war is 1% to 5%. Warmode normal = Longterm strategy Warmode extreme = Shortterm strategy
Parameter Description StartTrade = Time to start trading / open position EndTrade = Time to end trading / open position WarMode = 1 -> Normal, 2 -> Extreme (lots of tr
FREE

The "MACD Trend Follower" is an indicator based on the MACD oscillator. It serves to spot the trend direction by giving it a fixed color until the trend changes (the trend direction colors are customizable). The default MACD settings for the indicator has been changed to adapt to the fast moving Forex market, but they can be changed to suit the trader.
Recommended settings for the indicator : - MACD Fast EMA : 8 Periods. - MACD Slow EMA : 13 Periods. - MACD SMA : 5 Periods.
Indicator inputs :
FREE
XE Forex Strengh Indicator MT4 displays visual information about direction and strength of a signal for current pair and chosen timeframes (M5, M15, M30 and H1). Calculations are based on multiple factors and results are shown as a colored panel with scale bar, numerical values and arrows. There are also displayed values of current price and spread on the pair. There can be activated an alert (as a mail or pop-up window with sound) for each available timeframes which send a message when the dir
FREE
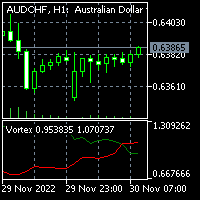
To download MT5 version please click here . - This is vortex indicator. - It is used to detect trend strength and direction. - It consists of two line(buffers). ==> VIM and VIP - There are three types of signals related to this indicator: 1. crossing VIM and VIP 2. threshold on distance between VIP and VIM 3. VIP above VIM vice versa. - This is a non-repaint indicator with light processing.
FREE
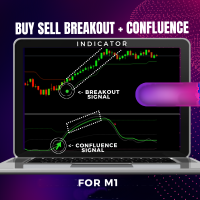
Veuillez ME CONTACTER après l'achat pour obtenir mes conseils de trading.
ACHETER VENDRE Breakout Indicator + Confluence
Qu'est-ce que la stratégie de breakout ?
En termes de trading, une cassure signifie que le prix d'un actif financier, comme une action, se déplace en dehors de sa fourchette de négociation déterminée, qui est souvent indiquée par ses niveaux de support et de résistance. La stratégie de breakout se concentre sur l'identification des tendances du marché dès qu'elles se brise

MT4 Multi-timeframe Divergence and Overbougt/Oversold detection indicator.
Features - Fully customizable on chart control panel, provides complete interaction. - Hide and show control panel wherever you want. - Real time information about non-capitalized divergences. - Real time information about overbougt / oversold situations. - Real time information about regular divergences. - Real time information about hidden divergences. - Oscillators available for divergences detection: AO, RSI, CCI, MA

This trend scanner indicator is using two main indicators to identify trends. Frist the EMAs to provide a view on Bullish / Bearish momentum. When the shorter EMA (calculated off more recent price action) crosses, or is above, the slower moving EMA (calculated off a longer period of price action), it suggests that the market is in an uptrend. Second the Stochastic RSI, When RSI is < 20 it is considered oversold, and when > 80 it is overbought. These conditions suggests that momentum is very str
FREE
The ' MTF MA Cross ' indicator comes from the time tested 'Moving Average Cross' strategy with several options available. The strategy in itself is one that was derived from rigorous testing on what was profitable in a moving average cross.
Key Features This indicator contains a fast and slow Moving Average cross with MTF & filtering settings. There are additional settings to filter signals out with how many bars and how many points. Indicator can be no-repaint when set with open prices & NewBa

Free informative Indicator-helper. It'll be usefull for traders who trade many symbols or using grid systems (Averaging or Martingale). Indicator counts drawdown as percent and currency separate. It has a number of settings: Count deposite drawdown according equity value and send e-mail or notifications to user if DD more than set; Sending e-mail when max open orders reached; Shows price and remaining pips amount before MarginCall on current chart and Account generally; Display summary trade lot
FREE

The HedgeFund Experiment This is a basic version of the professional version; The HedgeFund Manager https://www.mql5.com/en/market/product/85241 It is a multi-currency EA that needs only to be loaded in one chart. It will access all Forex pairs or CFD provided by your broker and will only trade those with a spread less than or equal to MaxSpread specified in the settings. It uses standard Metatrader4 indicators to generate signals but with a customized trend filter to pick which pairs to includ
FREE

Chaque commerçant sait qu'il ne devrait jamais risquer plus de 5% (ou 7%) par transaction. Il s'agit d'une loi de gestion de l'argent et une taille de lot utilisable doit être calculée à chaque fois car un trader doit utiliser une valeur StopLoss différente pour différents niveaux de trading. Cet indicateur calculera un LotSize approprié pour le moment où vous le mettrez sur le graphique et chaque fois que vous ferez glisser la "Stop Loss Line" dans n'importe quelle direction.
OFFRE À DURÉE L
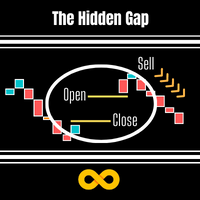
This Indicator is based on the Indice gaps between todays open price and yesturdays closing price. On Metatrader these are not shown as we only see a 24hr chart. If we want to know the gap between the open at 16:30 and yesturdays close at 23:30 on the SP500 this EA will reveal the gap. On Indices these types of Gap close approximately 60% of the time within the same day and is demonstrated on the panel which records previous gap closures and provides to the user a statistical proof of gaps clos
FREE
Binary Power Pinbar 2 pour MT4 Binary Power Pinbar 2 est un indicateur pour options binaires, compatible avec toutes les paires de devises et adapté à tous les intervalles de temps. Principe de fonctionnement L'indicateur détecte le modèle "Pin Bar" sur le graphique. Une fois détecté : Signal d'achat : Si le prix dépasse le sommet de la Pin Bar, un signal d'achat est généré. Signal de vente : Si le prix franchit le bas de la Pin Bar, un signal de vente est généré. Caractéristiques principales Ex

The RSI Arrows MTF indicator is based on the RSI indicator. Represents input signals in the form of arrows. It has 6 types of calculation. All signals are generated on the current bar of the selected period.
Signals do not redraw in the first 4 modes! But it is possible to redraw in cases of a sharp change in market movement.
All signals in MTF mode correspond to signals of the period specified in MTF. It is maximally simplified to use both for trading with only one indicator and for using t
FREE

The "Irisha" is an Expert Advisor, in which we attempted to implement the ability of trading on smaller timeframes (1-15 minutes). The main idea lies in opening frequent trades and in the ability to "cover" losing trades with profitable ones. However, we had to resort to the Martingale strategy to implement the idea. Due to this, it is recommended to have a large deposit and/or cent account for using this EA. Operation of the EA on a live account can be evaluated here: https://www.mql5.com/en/si
The indicator displays Gann lines for one day. It works only on the timeframes smaller than daily. Description of the indicator settings: Count_Bars - the number of daily bars to display the Gann lines. If set to 0, they are displayed for all the available history bars. scaleGann1 - scale for line #1 (number of points per bar) clrGann1 - color of line #1 styleGann1 - style of line #1 widthGann1 - width of line #1 scaleGann2 - scale for line #2 clrGann1 - color of line #2 styleGann2 - style of li
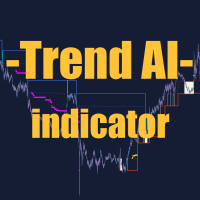
Trend AI Indicator Description:
Le Trend AI Indicator est un outil puissant d'analyse de marché qui utilise l'intelligence artificielle pour identifier les tendances et les niveaux clés. L'indicateur s'adapte automatiquement aux conditions changeantes du marché, fournissant des données précises pour la prise de décision. Fonctionnalités principales: Identification de la tendance: L'indicateur utilise des algorithmes d'apprentissage automatique pour déterminer avec précision la direction de la

The Expert Advisor is a risk manager helping users to control their trading. In the settings, it is possible to specify the parameters at which the risk manager force closes the opened trades and closes the terminal as well, if it is needed to prevent opening trades on emotions, which do not correspond to the trading strategy. Risk Manager settings Check limit to close - check the equity limit Limit to close (account currency) - equity limit that is checked when Check limit to close is act
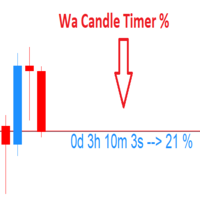
Wa Candle Timer Percentage MT4 est un indicateur qui montre à l'utilisateur combien de temps il reste avant l'ouverture de la prochaine bougie. Le pourcentage d'évolution de la bougie actuelle est aussi montré sur l'écran. L'utilisateur peut configurer le pourcentage auquel le candle timer changera de couleur. Voici les paramètres: 1 - Le pourcentage auquel le candle timer changera de couleur. 2 - couleur de la minuterie de la bougie, quand le pourcentage d'évolution de la bougie actuelle est
FREE
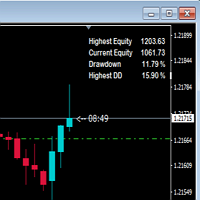
This indicator shows drawdown based on highest equity. Usually drawdown is used to show performance of a trading account especially when someone participate in a trading contest. If drawdown exceed a determined number, the contest account will be disqualified. So, I hope, this indicator will warn us in maintaining the drawdown and the account still be saved.
FREE

This indicator graphically displays profit ($),risk/reward and % of risk according SL&TP Open orders on Current Symbol. when you open orders on current symbol and set StoplLoss and TakeProfit this indicator automatically calculate Risk/Reward and calculate %risk Of Equity Account that your order get stop Loss. If you trade on several symbols at the same time, you can install the indicator on each one separately and see the relevant calculations on each one.
FREE

Note : New in 1.6: the indicator now exports the trade signal (but not displayed). Go long with light blue. Go short with red. Exit otherwise. Signal to be imported to your EA using iCustom. This indicator provides Best of the Best linear filter momentum oscillators that I am aware of (Low Pass Differentiators, LPD's) . All of them are recent developments by this developer, or other researchers. The oscillator line is the first buffer of the indicator, and can be called in other indicators or
FREE

Ultimate Double Top Scanner (Multi Pair And Multi Time Frame) : ---LIMITED TIME OFFER: NEXT 25 CLIENTS ONLY ---46% OFF REGULAR PRICE AND 2 FREE BONUSES ---SEE BELOW FOR FULL DETAILS Any major price level that holds multiple times, is obviously a level that is being defended by
the large institutions. And a strong double top pattern is a clear indication of institutional interest.
Double top patterns are widely used by institutional traders around the world. As they allow you to manage
yo

SmartStochasticMt4 is a universal indicator for making trading decisions. An indispensable tool for novice traders, as it has no settings and is ready to work after installation.
Advantages of the indicator:
1. Works with any trading symbol
2. Works on any time period
3. Has no configurable parameters
4. Provides a complete picture of the trading situation from different time periods
5. Not late
Working with the indicator
1. To set the indicator
2. To exclude from the time of the release of im
FREE

The Key level wedge indicator automatically draws rising wedge pattern and falling wedge pattern for you on the chart. This pattern is really good when used as a confirmation entry at key support & resistance, supply & demand and reversal zones.
Advantages
The Key level wedge block DOES NOT RE-PAINT, giving you confidence when a signal appears and also helps when looking back. The Key level wedge includes an on/off button on the chart to easily keep the charts clean after analysis by just o

Crosshair est un outil fantastique qui simplifie notre analyse graphique en alignant parfaitement les bougies de prix avec les valeurs des indicateurs dans les sous-fenêtres.
Vous pouvez l'activer et le désactiver par une simple pression sur la touche "C" de votre clavier, et il offre un mode règle pour des mesures précises qui peut être activé et désactivé par la touche "R" de votre clavier.
Veuillez regarder notre court tutoriel vidéo intégré ci-dessous pour voir comment il fonctionne.

The Simple ICT Concepts Indicator is a powerful tool designed to help traders apply the principles of the Inner Circle Trader (ICT) methodology. This indicator focuses on identifying key zones such as liquidity levels, support and resistance, and market structure, making it an invaluable asset for price action and smart money concept traders. Key Features Market Structure : Market structure labels are constructed from price breaking a prior swing point. This allows a user to determine t
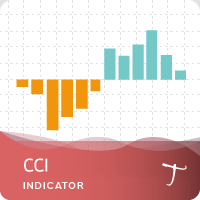
28 symbols, multi-time frame powerful Dashboard for the full market view Customizable Buy/Sell alerts, push alerts, email alerts, and visual on-screen alerts. Marked buy/sell signals Two color trend histogram. The commodity channel index (CCI) is an oscillator originally introduced by Donald Lambert in 1980. CCI measures current price level relative to an average price level over a given period of time. CCI is high when prices are above the average price, and low when the prices are below the a
FREE

Il nostro Indicatore Combinato RaysFX CCI-RSI è uno strumento unico che combina due dei più popolari indicatori di analisi tecnica: l’Indice di Forza Relativa (RSI) e l’Indice del Canale delle Materie Prime (CCI). Caratteristiche : Combinazione di CCI e RSI : L’indicatore calcola la differenza tra i valori di CCI e RSI per ogni barra del grafico. Media Mobile Semplice (SMA) : L’indicatore calcola una SMA su queste differenze e traccia due linee sul grafico. Segnali di trading : Ogni volta che qu
FREE
Highly configurable Macd indicator.
Features: Highly customizable alert functions (at levels, crosses, direction changes via email, push, sound, popup) Multi timeframe ability Color customization (at levels, crosses, direction changes) Linear interpolation and histogram mode options Works on strategy tester in multi timeframe mode (at weekend without ticks also) Adjustable Levels Parameters:
Macd Timeframe: You can set the lower/higher timeframes for Macd. Macd Bar Shift: you can set the o
FREE

Il utilise trois moyennes mobiles pour analyser le marché et générer des signaux d'achat et de vente. La première et la deuxième moyenne mobile sont de type simple et ont des périodes respectives de 20 et 50. Elles servent à déterminer les points d'entrée et de sortie.
La troisième moyenne mobile est de type simple et a une période de 200. Elle sert à indiquer la direction de la tendance, en fonction de sa position par rapport au prix. Le robot ne prend que les signaux qui sont cohérents avec
FREE

The EU_15_111517128_S_Op_CF_SQ3 is an algorithmic trading strategy for MetaTrader, tested on EURUSD using the M15 timeframe from April 1, 2004, to April 24, 2024. There is no need to set up parameters, all settings are already optimized and fine-tuned.
Recommended broker RoboForex because of EET timezone.
You can find the strategy source code for StrategyQuant at the link: https://quantmonitor.net/eurusd-bollinger-bands-breaker/
Key details are:
Main Chart: Current symbol and timeframe
FREE
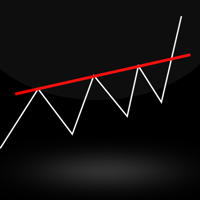
Free TrendLine EA opens trades whenever the price on the chart interacts with or crosses your trend line. You simply draw the trend line manually then let the EA do the trading automatically according to the rules you give it. The settings available in the EA are explained below: Lots : The lot size for trading. RiskPercentage : Set a value other than zero to activate lot sizing by use of percentage of margin. TrendLineName: The name of the line to track. You can either * rename the trend line t
FREE

Moving Along USES THE TREND WAVE INDICATOR AND IT CAN IDENTIFY THE BEGINNING AND THE END OF A NEW WAVE TREND MOVEMENT.
AS AN OSCILLATOR, THE INDICATOR IDENTIFIES THE OVERBOUGHT AND OVERSOLD ZONES.
IT WORKS GREAT TO CATCH THE SHORT TERM PRICE REVERSALS AND USES A MARTINGALE STRATEGY TO CLOSE ALL TRADES IN PROFIT.
USE DEFAULT SETTINGS ON M15 OR HIGHER TIME FRAME ON ANY PAIR FOR MORE ACCURATE TRADES
WHY THIS EA :
Smart entries calculated by 5 great strategies The EA can be run on even a $2000
FREE

This is a gamble Expert Advisor!!
It will open randomly trades on markets which are in your watchlist (left). You select how much you will risk. It uses the compound interest effect. Example: Starting with $10 1. Trade + $10 -> $20 2. Trade + $20 -> $40 3. Trade + $40 -> $80 4. Trade + $80 -> $160 5. Trade + $160 -> $320 6. Trade + $320 -> $640 .. and so on! If you reach the 17th trade sucessfully, you have over 1 Million Dollar!! (Starting with $10)
It risks max. 90% of your money stake, to
FREE

A combined indicator of two famous indicators: RSI , Bollinger Bands Can be used in all currency pairs Can be used in all time frames with many signals Very simple and fast to use
Description:
This indicator is made from the combination of RSI and Bollinger Bands indicators
As you can see, it shows good signals and is worth using and testing
We hope you are satisfied with this indicator
Settings: show past show candle: Displays the number of candles that the indicator calculates.
For example
FREE

This indicator is based on Zigzag. It shows the HH, HL, LL, LH counts. This helps in finding ongoing trends. Or ranges:
Features: Show symbols for: Higher-Highs, Higher-Lows Lower-Lows, Lower-Highs And show counter for each Non-repainting option Customize Color and horizontal/vertical labels Corresponding scanner dashboard: https://www.mql5.com/en/market/product/85346
Symbols Described: HH = Higher-Highs (Current price high is more than previous high) HL = Higher-Lows (Current price low is mo
FREE
L'Expert Advisor IT Moving RSI EA est un outil de pointe conçu pour donner aux traders de profondes connaissances sur les tendances du marché et les mouvements de prix. Cet Expert Advisor est un allié puissant, adapté aux traders débutants comme aux traders expérimentés, offrant la capacité de prendre des décisions éclairées en combinant la puissance des moyennes mobiles et de l'indice de force relative (RSI). Que vous débutiez dans le monde du trading ou que vous soyez un trader chevronné, cet
FREE
This indicator is an interpretation of the Average Directional Movement Index (ADX), which helps to determine the presence of a price trend. It was developed and described in detail in the book "New Concepts in Technical Trading Systems" by Welles Wilder. The presented indicator displays signals on the price chart when +DI and -DI cross and signals when the ADX value falls or rises in relation to the mutual arrangement of +DI and -DI. The indicator's buy signals also work as a support level, whi
FREE

VR Ticks est un indicateur spécial pour les stratégies basées sur le scalping. Grâce à cet indicateur, le trader peut voir le graphique des ticks directement sur le graphique principal de l'instrument financier. Un graphique à ticks vous permet d'entrer une position sur le marché ou de clôturer une position sur le marché aussi précisément que possible. VR Ticks trace les données des tiques sous la forme de lignes qui changent de couleur en fonction de la direction - cela vous permet de comprendr
FREE

Всем привет. Предлагаю на обозрения очень достойный индикатор входы очень четкие можно по мартину отрабатывать 30 мин до и после новостей не торгуем можно накинуть индикатор новостей больше вам не чего не надо есть сигнал стрелка за крепилась на следующую входим Экспирация любая валюта тоже любая. осцилляторы и авторский алгоритм.И еще можно через бот авто торговля на скрине.И еще друзья после приобретения или аренды пишем мне свои контакты я вам помогу все настроить что бы работало на авто то
FREE

This indicator is a histogram showing the trend based on 3 different moving averages. When all averages are set in ascending order, the indicator is green, and when in descending order, it is red. If the averages do not show a trend, the color is yellow. Additionally, each average can have different settings, such as Mode MA and Price MA. You can also set an alert and receive notifications on your phone.
To enable the alert and push notification, you need to activate them first in the MT4 settin
FREE

The free version of the Hi Low Last Day MT4 indicator . The Hi Low Levels Last Day MT4 indicator shows the high and low of the last trading day . The ability to change the color of the lines is available . Try the full version of the Hi Low Last Day MT4 indicator , in which additional indicator features are available : Displaying the minimum and maximum of the second last day Displaying the minimum and maximum of the previous week Sound alert when crossing max . and min . levels Selecting an arb
FREE
Le MetaTrader Market est un site simple et pratique où les développeurs peuvent vendre leurs applications de trading.
Nous vous aiderons à publier votre produit et vous expliquerons comment préparer la description de votre produit pour le marché. Toutes les applications de Market sont protégées par un cryptage et ne peuvent être exécutées que sur l'ordinateur de l'acheteur. La copie illégale est impossible.
Vous manquez des opportunités de trading :
- Applications de trading gratuites
- Plus de 8 000 signaux à copier
- Actualités économiques pour explorer les marchés financiers
Inscription
Se connecter
Si vous n'avez pas de compte, veuillez vous inscrire
Autorisez l'utilisation de cookies pour vous connecter au site Web MQL5.com.
Veuillez activer les paramètres nécessaires dans votre navigateur, sinon vous ne pourrez pas vous connecter.