Regardez les tutoriels vidéo de Market sur YouTube
Comment acheter un robot de trading ou un indicateur
Exécutez votre EA sur
hébergement virtuel
hébergement virtuel
Test un indicateur/robot de trading avant d'acheter
Vous voulez gagner de l'argent sur Market ?
Comment présenter un produit pour qu'il se vende bien
Indicateurs techniques payants pour MetaTrader 4 - 113
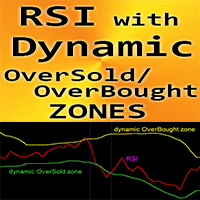
Forex Indicator "RSI with Dynamic OverSold/OverBought zones" for MT4. RSI is one of the most popular oscillators for trading - very good for Scalping. It is great to take Sell entries from dynamic OverBought zone and Buy entries from dynamic OverSold zone RSI oscillator also is very useful for divergence detection This indicator is excellent to combine with Price Action entries from OverSold/Bought areas as well D ynamic OverBought zone - above yellow line
D ynamic OverSold zo

El indicador "MR BEAST ALERTAS DE LIQUIDEZ" es una herramienta avanzada diseñada para proporcionar señales y alertas sobre la liquidez del mercado basándose en una serie de indicadores técnicos y análisis de tendencias. Ideal para traders que buscan oportunidades de trading en función de la dinámica de precios y los niveles de volatilidad, este indicador ofrece una visualización clara y detallada en la ventana del gráfico de MetaTrader. Características Principales: Canal ATR Adaptativo: Calcula
ARFX link: https://linktr.ee/ARFX_Auto_Trade I made this Alligator Indicator with the concept of multi time frame monitors where friends can directly use the signals that appear with reference If a Buy Signal appears from D1 to M1, then we just focus on buying using the Breakout Candle as a reference If a Sell Signal appears from D1 to M1, then we just focus on Sell using the Breakout Candle as a reference If you want to get this indicator for free then you have to join the ARFX IB line https:
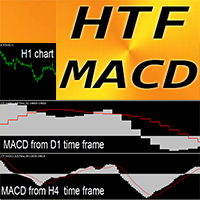
Forex Indicator HTF MACD Oscillator for MT4 HTF means - H igher Time Frame MACD indicator itself is one of the most popular indicators for trend trading This indicator is excellent for Multi-Time Frame trading systems with Price Action entries or in combination with other indicators HTF MACD Indicator allows you to attach MACD from Higher time frame to your current chart --> this is professional trading approach Indicator has built-in Mobile and PC alerts // More great Ex

Simple but great indicator to improve your trading. ----------------------------------------------------- Test it as it proves its value with its results.
Settings: AlertConfirmation: turns on and off alerts CalculatedBars: how many bars will be calculated Distance : arrow distance
Buffers: Buffer0 (Arrow Buy) Buffer1 (Arrow Sell) Buffer2 (Buy value 1) Buffer3 (Sell value 1)
Hello
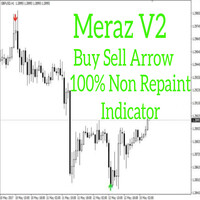
Alright. This indicator works on MT4 and is very easy to use. When you receive a signal from it, you wait for that candle with the signal to close and you enter your trade at the beginning of the next new candle. A red arrow means sell and a green arrow means buy. All arrows comes with a long dotted like for easy identification of trade signal. Are you okay with that? 100% non repaint Work All Major currency Pair, 1 minute time frame 1 minute expire, 5 minute timeframe 5 minute expire
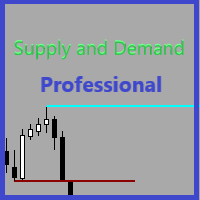
Supply and Demand Professional is a powerful tool suited for advanced traders! Easily see levels of supply and demand (or support and resistance) as they develop. *This is a NON-repainting indicator* How this can help you?
Levels can be used for stop loss and take profit targets Automatically identifying key levels in the market Spotting market imbalances Better entry levels and timing of trades Volume analysis Understanding market sentiment Predicting price movements Risk management Trend c
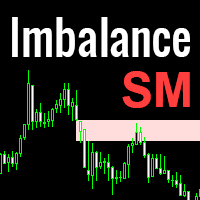
Imbalance is one of the important zones on the chart, to which the price will always strive to cover it. It is from the imbalance zone that the market most often makes significant reversals, rollbacks and gives entry points that you can successfully trade. In the Smart Money concept, the imbalance zone is used to find an entry point, as well as a place for take profit at the level of imbalance overlap by the price. Until the imbalance is overlapped, it is the closest target for the price. Ho
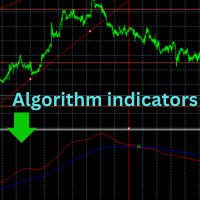
Bienvenue, merci de nous avoir choisi
Nous vous proposons les derniers indicateurs qui vous aideront à prendre des décisions après avoir créé votre propre analyse technique
Vous verrez le point d'entrée que vous utiliserez pour obtenir une bonne affaire
A chaque intersection, il y a une opportunité de transaction que l'indicateur vous montre à travers une marque
Il est recommandé d'utiliser l'indicateur uniquement sur de longues périodes de temps, plus d'une demi-heure, les opportunités
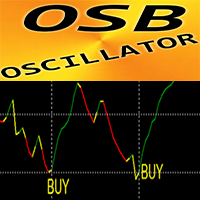
OSB Oscillator - is advanced custom indicator, efficient Price Action auxiliary tool! Advanced new calculation method is used. New generation of Oscillators - see pictures to check how to use it. OSB Oscillator is auxiliary tool to find exact entry points for Price Action, Divergence and Oversold/OverBought signals Oversold values: below 30 Overbought values: over 70 There are plenty of opportunities to upgrade even standard strategies with this indicator. It is much faster and more accurate
Bienvenue, merci de nous avoir choisi
Lisez attentivement avant de commencer
Lorsque vous allumez l'indicateur, laissez-le pendant environ une heure ou deux. Il collectera automatiquement les données, puis sa forme sera complète et il commencera à équilibrer les nouvelles données.
Nous vous proposons les derniers indicateurs qui vous aideront à prendre des décisions après avoir créé votre propre analyse technique
Vous verrez le point d'entrée que vous utiliserez pour obtenir une bonne a
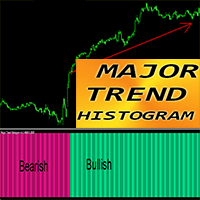
Forex Indicator "Major Trend Histogram" for MT4 Major Trend Histogram indicator designed to catch really huge trends Indicator can be in 2 colors: DeepPink for bearish trend and SpringGreen for bullish one (colors can be changed) It detects trends on the beginning stages - way more efficient than any standard MA cross M ajor Trend Histogram can be combined with any other trading methods: Price Action, VSA, other indicators Indicator has built-in Mobile and PC alerts
// More great Exper

This indicator is based on a leading version of the EURUSD proxy trade, such that the day's underlying direction can be inferred through the intraday volatility and market noise.
Market price action is deceptive, misleading, no one has ever profitted consistently by just following latest price action. This also fools single market and momentum based indicators, since the main data used is market price.
Intermarket analysis on the other hand can tell what the broader market action is, across
Day Trader Edge is a Range Breakout Correlation With Multi Symbol Lookup (NON-REPAINT Enhance your trading strategy with our cutting-edge Indicator! This versatile tool is designed to provide precise breakout signals and comprehensive analysis to help you make informed trading decisions. Discover the features that make our indicator a must-have for any forex trader: -INDEPENDENT COMPLETE DAY TRADING SYSTEM- Key Features: Range Breakout Time-Based Analysis: Accurately identifies breakout level
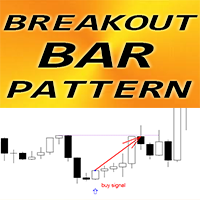
Forex Indicator " Breakout Bar pattern" for MT4 Indicator "Breakout Bar pattern" is very powerful indicator for Price Action trading: No repaint, No delays; Indicator detects Breakout Bar patterns on chart: Bullish Breakout Bar pattern - Blue arrow signal on chart (see pictures) Bearish Breakout Bar pattern - Red arrow signal on chart (see pictures) with P C, Mobile & Email alerts Indicator " Breakout Bar pattern" is excellent to combine with Support/Resistance Levels // Mor
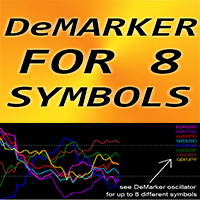
Forex Indicator "DeMarker for 8 Symbols" for MT4, No repaint DeMarker oscillator curve indicates the current price position relative to previous highs and lows during the indicator calculation period DeMarker provides the most efficient regular divergence signals among other oscillators It is great to take Sell entries with regular divergence in OverBought zone (above 0.7) and Buy entries with regular divergence in OverSold zone (below 0.3) "DeMarker for 8 Symbols" gives oppo
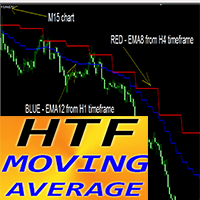
Forex Indicator HTF MOVING AVERAGE for MT4 Upgrade your trading methods with the professional HTF MA Indicator for MT4. H TF means - H igher Time Frame This indicator is excellent for Trend Traders with Price Action entries. HTF MA Indicator allows you to attach Moving Average from Higher time frame to your current chart. Indicator shows the trend from higher time frame --> this is always profitable method. HTF MA Indicator gives opportunity to get big profit with low risk. How to use
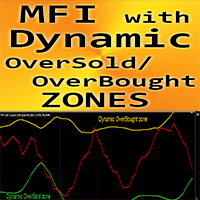
Forex Indicator " MFI with Dynamic OverSold/OverBought zones " for MT4. M oney Flow Index (MFI) is a technical oscillator which uses price and volume data for identifying oversold and o verbought zones It is great to take Sell entries from dynamic OverBought zone and Buy entries from dynamic OverSold zone MFI is very useful for divergence detection and it is great to combine with Price Action as well D ynamic OverBought zone - above yellow line
Dynamic OverSold zone - be
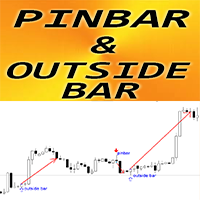
Forex Indicator " Pin Bar & Outside bar Patterns" for MT4 Indicator " Pin Bar & Outside Bar Patterns " is very powerful for Price Action trading Indicator detects Pin Bar and Outside bar Patterns on chart: Bullish pattern - Blue arrow signal on chart (see pictures) Bearish pattern - Red arrow signal on chart (see pictures) No repaint; No delays; with PC, Mobile & Email alerts Indicator "Pin Bar & Outside Bar Patterns " is excellent to combine with Support/Resistance Levels //

This indicator works on MT4 and is very easy to use. When you receive a signal from it, you wait for that candle with the signal to close and you enter your trade at the beginning of the next new candle . A red arrow means sell and a green arrow means buy. All arrows comes with Alert like for easy identification of trade signal. Are you okay with that?
1 minute candle
1 minute expire
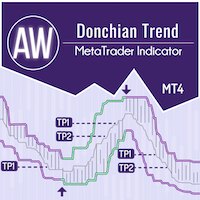
AW Donchian Trend est un indicateur de tendance basé sur le canal Donchian. L'indicateur peut calculer les niveaux TakeProfit et StopLoss, dispose de statistiques avancées sur le succès des signaux, ainsi que de trois types de notifications sur le signal reçu. Guide d'installation et instructions - Ici / Version MT5 - Ici Comment trader avec l'indicateur : Trader avec AW Donchian Trend ne nécessite que trois étapes simples : Étape 1 – Ouverture d’une position Un signal d'achat est reçu
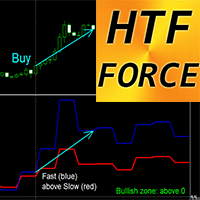
Forex Indicator HTF Force Oscillator for MT4 HTF Force is powerful indicator for Multi-Time Frame trading . HTF means - H igher Time Frame Force index is one of the top indicators that combines price and volume data into a single value Values from High time frame can show you the trend direction (downtrend - below 0; uptrend - above 0) Fast Force - Blue line, Slow Force - Red line Buy signal - Fast line crosses Slow line upward and both - above 0 (see picture) Sell signal - Fast line cr
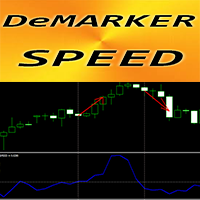
Forex Indicator " DeMarker Speed" for MT4 The calculation of this indicator is based on equations from physics. DeMarker Speed is the 1st derivative of DeMarker itself DeMarker oscillator curve indicates the current price position relative to previous highs and lows during the indicator calculation period
DeMarker Speed is good for scalping entries when standard DeMarker oscillator is in OverSold/OverBought zone (as on pictures) DeMarker Speed indicator shows how fast DeMarker itsel
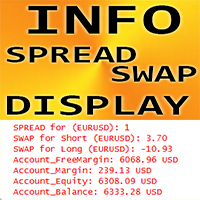
Forex Indicator "INFO Spread Swap Display" for MT4, Trading Support tool. INFO Spread Swap Display indicator shows current S pread and Swaps of forex pair where it is attached. It also indicates account Balance, Equity and Margins It is possible to locate indicator values in any corner of the chart: 0 - for top-left corner, 1 - top-right, 2 - bottom-left, 3 - bottom-right It is possible to set up color and font size as well // More great Expert Advisors and Indica
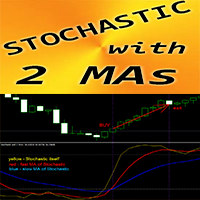
Forex Indicator " Stochastic and 2 Moving Averages" for MT4 Stochastic oscillator is one of the best indicators on the market - perfect tool for many traders. "S tochastic and 2 Moving Averages" Indicator allows you to see Fast and Slow Moving Averages of S tochastic oscillator OverBought zone - above 80; OverSold one - below 20 It is great to take Sell entries from above 80 zone and Buy entries from below 20 You can see Buy and Sell entry conditions on the pictures

Forex Indicator "Support Resistance Levels" for MT4 Indicator " Support Resistance Levels" is very useful auxiliary indicator for trading 'Support' and 'Resistance' are important zones on chart respected by price
Support level is where the price regularly stops falling and bounces back up
Resistance level is where the price normally stops rising and dips back down I ndicator " Support Resistance Levels" shows the recent levels: Resistance levels - red lines. S upport levels - blue lines

Adjustable Consecutive Fractals looks for 2 or more fractals in one direction and sends out a on screen alert, sound alert and push notification, for strong reversal points .
Adjustable Consecutive Fractals, shows the fractals on chart along with a color changing text for buy and sell signals when one or more fractals appear on one side of price.
Adjustable Consecutive Fractals is based Bill Williams Fractals . The standard Bill Williams fractals are set at a non adjustable 5 bars, BUT withe

The Binary Profit Maker,
This indicator works on MT4 and is very easy to use. When you receive a signal from it, you wait for that candle with the signal to close and you enter your trade at the beginning of the next new candle . A Up Purple arrow means Buy and a Down Purple arrow means Sell. All arrows comes with Alert like for easy identification of trade signal. Are you okay with that?
How To Enter Trade?
1 minute candle
1 minute expire
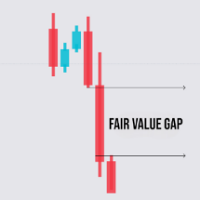
Le FVG Analyzer est un indicateur personnalisé pour MetaTrader 4, conçu pour détecter et mettre en évidence les Fair Value Gaps (FVG) sur les graphiques de prix. Cet outil permet aux traders d'identifier facilement les zones où des lacunes de valeur ont été créées, offrant ainsi des opportunités potentielles pour des stratégies de trading basées sur ces gaps. Fonctionnalités : Détection des FVG : FVG Haussier : Identifie les gaps haussiers lorsque le plus haut de la bougie suivante est inférieur

This indicator/dashboard , is place on a single symbol. It shows the percentage of movement withing all time frames from M1 to W1.The text will change green if all % are in the positive for a buy signal.The text will change red if all % are below zero and in negative for a sell signal. There are audible notifications, as well as on screen notifications along with push notifications that can be turned on and ON/OFF in the settings.
This is a sure way to Find trends quickly and efficiently, with

Volume Break Oscillator est un indicateur qui fait correspondre le mouvement des prix aux tendances des volumes sous la forme d'un oscillateur.
Je souhaitais intégrer l'analyse des volumes dans mes stratégies mais j'ai toujours été déçu par la plupart des indicateurs de volume, tels que l'OBV, le Money Flow Index, l'A/D mais aussi le Volume Weighted Macd et bien d'autres. J'ai donc écrit cet indicateur pour moi-même, je suis satisfait de son utilité, et j'ai donc décidé de le publier sur le m
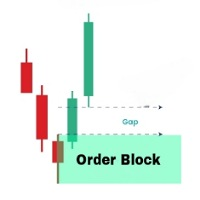
L'OrderBlock Analyzer est un indicateur personnalisé pour MetaTrader 4 (MT4) conçu pour détecter et mettre en évidence automatiquement les Order Blocks sur les graphiques de prix. Cet outil est idéal pour les traders qui utilisent les Order Blocks dans leur stratégie de trading, offrant une visualisation claire et précise de ces zones cruciales. Fonctionnalités principales : Détection des Order Blocks : Identifie automatiquement les Order Blocks haussiers et baissiers basés sur les configuration
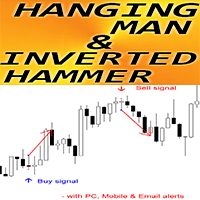
Forex Indicator " Hanging Man and Inverted Hammer pattern" for MT4 Indicator " Hanging Man and Inverted Hammer pattern " is very powerful indicator for Price Action trading : No repaint, No delays; Indicator detects bullish Inverted Hammer and bearish Hanging Man patterns on chart: Bullish Inverted Hammer - Blue arrow signal on chart (see pictures) Bearish Hanging Man - Red arrow signal on chart (see pictures) P C, Mobile & Email alerts are included Indicator " Hanging Man
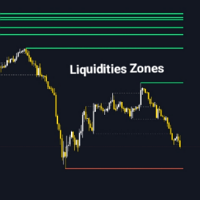
Le Liquidity Zone Detector est un indicateur technique avancé conçu pour identifier et tracer les zones de liquidité clés sur le marché en se basant sur l'indicateur ZigZag. Cet outil met en évidence les niveaux de prix où des liquidités importantes sont susceptibles d'être présentes, en dessinant des lignes de tendance sur les points hauts et bas capturés par le ZigZag. Le Liquidity Zone Detector aide les traders à repérer les zones potentielles de retournement ou de continuation des tendances
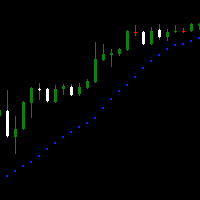
Доброго времени суток.
Вашему вниманию простой, но крайне удобный продукт для любителей индикатора Parabolic SAR . Он представляет собой окно осциллятора, на который выводится несколько тайм-фреймов в режими реального времени вместе с индикатором.
Настройки интуитивно понятные, что бы включать и отключать количество выбранных таймов - необходимо применять PERIOD_CURRENT, в таком случае дополнительный тайм не откроется.
Пишите в комментариях к продукту, что бы вы хотели увидеть в новых вер
Qu'est-ce que "Real Time MultiIndicator"? "Real Time MultiIndicator" est un outil de trading avancé conçu pour simplifier et optimiser votre analyse technique. Cet indicateur révolutionnaire recueille des signaux provenant de plusieurs timeframes et indicateurs techniques, les affichant dans un tableau unique, clair et facile à lire. Si vous souhaitez une vision complète et détaillée du marché sans avoir à changer constamment de graphique ou à analyser manuellement chaque indicateur, "Real Time
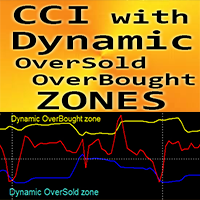
Forex Indicator " CCI with Dynamic OverSold/OverBought zones " for MT4. C ommodity Channel Index (CCI) is excellent for Momentum trading into the trend direction. It is great to take Sell entries from dynamic OverBought zone and Buy entries from dynamic OverSold zone into the direction of main trend T his indicator is excellent to combine with Price Action entries as well . D ynamic OverBought zone - above yellow line
Dynamic OverSold zone - below blue line
CCI oscill
MACD Indicator The Moving Average Convergence and Divergence (MACD) is a trend following momentum indicator which shows the relationship between two moving averages that we chose and configure them on the indicator. The MACD is calculated by subtracting the 26-period exponential moving average and the 12 period D.A.M. These are the default parameters when you put the MACD indicator on the charts, and the period is usually 9 which means the last 9 candles. DT-Oscillator This is Robert C. Miner's
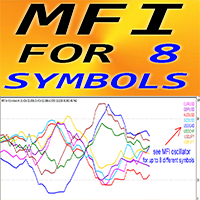
Forex Indicator "MFI for 8 Symbols" for MT4. M oney Flow Index (MFI) is a technical oscillator which uses price and volume data for identifying oversold and o verbought zones It is great to take Sell entries from Overbought when the MFI is above 80 and Buy entries from Oversold when it is below 2 0 MFI is very useful for divergence detection and it is great to combine with Price Action as well "MFI for 8 Symbols" gives opportunity to control MF I values of up to 8 diff

he "Super Trampoline" is an innovative trading indicator designed to simplify decision-making in financial markets. It analyzes chart data and provides clear and timely signals on when to buy or sell an asset, based on a proven strategy of candlestick pattern analysis. Product Advantages: Intuitive Interface : "Super Trampoline" integrates directly into your trading terminal, displaying signals as simple arrows on the chart. This means you don't need deep technical analysis knowledge to start us

Introducing "Super Transplant with Filter" — a game-changing tool for traders who value precision, reliability, and simplicity. This indicator combines advanced trend analysis techniques with intelligent signal filtering, allowing you to make decisions based on the most relevant data. Benefits of "Super Transplant with Filter": Accuracy in Every Trade : The indicator meticulously analyzes market data, identifying key trends while filtering out false signals. This enables you to make more informe
REMIS DE 77,90 USD À 37,90 USD VALABLE JUSQU'AU DIMANCHE 1ER SEPTEMBRE Qu'est-ce que "Forex Scanner"? "Forex Scanner" est un outil de trading puissant conçu pour vous fournir une vue d'ensemble complète du marché des changes en temps réel. Cet indicateur avancé recueille des données clés à partir de multiples indicateurs techniques et horizons temporels, vous permettant d'identifier rapidement les opportunités de trading. Si vous souhaitez surveiller de nombreux actifs et paramètres sans avoir à
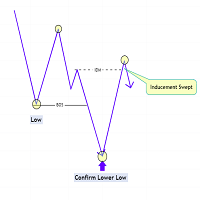
The Market Structure with Inducements & Sweeps indicator is a unique take on Smart Money Concepts related market structure labels that aims to give traders a more precise interpretation considering various factors.
Compared to traditional market structure scripts that include Change of Character (CHoCH) & Break of Structures (BOS) -- this script also includes the detection of Inducements (IDM) & Sweeps which are major components of determining other structures labeled on the chart.
SMC &
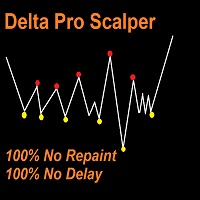
Delta Pro Scalper - Your Ultimate Trend Trading Solution, Delta Pro Scalper is a TREND indicator that automatically analyzes the market and provides information about the trend without redrawing or delay.
The indicator uses candlestick OHLC data and analyzing them to determine up trend or down trend, You MUST wait till closing candle, once the dot appear the next open candle you can open buy or sell position. Red Dot = Bearish Trend (Open SELL)
Yellow Dot = Bullish Trend (Open BUY) Here's th
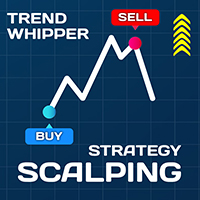
A Full Concept of BUY/SELL Scalping Strategy Trend detection is one of the basic challenges of every trader. Finding a way to tell when to enter a trade is very important, timing is a game changer, not too early and not too late. Sometimes, due to not knowing the market conditions, the trader closes his positions with a small profit or allows the losses to grow, these are the mistakes that novice traders make. Indicator Trend Whipper is a complete trading strategy and can improve the trader's tr
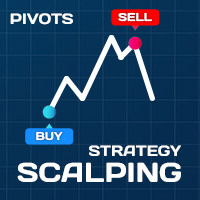
Scalping Strategy BUY SELL
Having a strategy in the market is one of the main conditions for trading. The presence of various and complicated indicators and tools sometimes makes trading difficult, and the user gets confused after trying various methods and gets stuck in a loss cycle, the result of which is usually clear. This indicator is a simple strategy based on the detection of pivots and short-term trends, which helps you to easily trade in trends. Sometimes a simple but efficient st
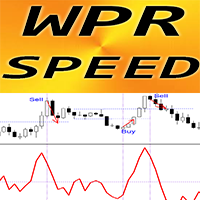
Forex Indicator "WPR SPEED" for MT4 - great predictive tool! The calculation of this indicator is based on equations from physics . WPR SPEED is the 1st derivative of WPR oscillator itself WPR SPEED is good for scalping entries on sideways and flat markets WPR SPEED indicator shows how fast WPR itself changes its direction - it is very sensitive It is recommended to use WPR SPEED indicator for momentum scalping trading strategies: find big size peaks of indicator - open scalping t
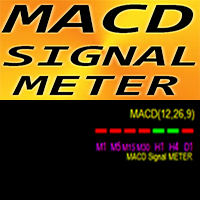
Forex Indicator MACD Signal METER for MT4 Very useful MACD Signal METER indicator is showing current MACD value (above/below Signal) for 7 time frames simultaneously Green box - MACD is above Signal Red box - MACD is below Signal Forex Indicator MACD Signal METER can be used as trade entry filter for Multi Time Frame trading
// More great Expert Advisors and Indicators are available here: https://www.mql5.com/en/users/def1380/seller It is original product which is offered only on t
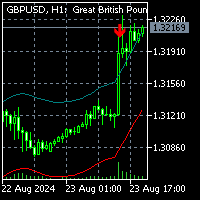
To get access to MT5 version click here . This is the exact conversion from "Nadaraya-Watson Envelope" by " LuxAlgo ". (with non-repaint input option) This is not a light-load processing indicator if repaint input is set to true . All input options are available. Buffers are available for processing in EAs. I changed default input setup to non-repaint mode for better performance required for mql market validation procedure . Here is the source code of a simple Expert Advisor operating

Выпадающее меню для трендовых линий и прямоугольника. Позволяет редактировать цвет, стиль и толщину. При выделении линии появляется меню, каждая функция разделена. Можно сразу нажать и поменять на нужное. Толщина меняется по другому, нужно нажать на цифру, она станет в синем цвете, нажать нужную цифру от 1 до 4, в зависимости от нужной толщины, нажать интер.
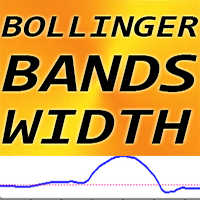
Forex Indicator Bollinger Bands Width for MT4, No Repaint. -BB Width indicator is applicable for using together with standard Bollinger Bands indicator. -This software is must have for every Bollinger Bands indicator fan, because their combination is very efficient to trade Breakouts -BB Width indicator shows the distance (span) between Bollinger Bands. HOW TO USE BB Width (See the example on the picture): 1) Find the lowest value of BB Width of the last 6 months and add 25% to this value
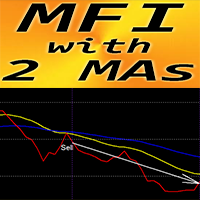
Forex Indicator "MFI and 2 Moving Averages" for MT4 M oney Flow Index (MFI) is a technical oscillator which uses price and volume data for identifying oversold and o verbought zones " MFI and 2 Moving Averages" Indicator allows you to see Fast and Slow Moving Averages of MFI oscillator Indicator gives opportunities to see the trend change very early It is very easy to set up this indicator via parameters, it can be used on any time-frame You can see Buy and Sell entry cond

WaPreviousCandleLevelsMT4 affiche les niveaux de bougies précédents, il affiche les niveaux d'ouverture (Open), du prix le plus haut (High), du prix le plus bas (Low) et du prix de clôture (Close) de la bougie précédente sur différentes périodes. Ces niveaux sont souvent appelés OHLC. Il est conçu pour aider le trader à analyser le marché et à faire attention aux niveaux OHLC de la bougie précédente sur différentes unités de temps. Nous savons tous que les niveaux OHLC mensuels (MN), hebdomad

MT4 is a Histogram version of MT5: https://www.mql5.com/en/market/product/122151 Introducing Trade Sniper: Your Edge in the Markets. Tired of missing profitable trades or getting caught on the wrong side of the market? Meet Trade Sniper, the cutting-edge indicator that harnesses the power of trends to give you a razor-sharp advantage in your trading. Trend Sniper is not just another run-of-the-mill indicator. It's a sophisticated tool that combines advanced algorithms with time-tested trading
RSI Amélioré : Un Indicateur Hybride pour une Analyse Technique Plus Approfondie Le RSI Amélioré est un indicateur technique polyvalent et personnalisable, conçu pour fournir aux traders une analyse du marché plus complète et précise. En combinant les meilleures caractéristiques des moyennes mobiles, du RSI et du MACD, cet indicateur offre une vision multidimensionnelle du momentum et de la force d'une tendance. Caractéristiques Principales : Hybridation Parfaite : Le RSI Amélioré fusionne les c
Le MetaTrader Market offre un lieu pratique et sécurisé pour acheter des applications pour la plateforme MetaTrader. Téléchargez des versions démo gratuites de Expert Advisors et des indicateurs directement depuis votre terminal pour les tester dans le testeur de stratégie.
Testez les applications dans différents modes pour surveiller les performances et effectuez un paiement pour le produit que vous souhaitez en utilisant le système de paiement MQL5.community.
Vous manquez des opportunités de trading :
- Applications de trading gratuites
- Plus de 8 000 signaux à copier
- Actualités économiques pour explorer les marchés financiers
Inscription
Se connecter
Si vous n'avez pas de compte, veuillez vous inscrire
Autorisez l'utilisation de cookies pour vous connecter au site Web MQL5.com.
Veuillez activer les paramètres nécessaires dans votre navigateur, sinon vous ne pourrez pas vous connecter.