Watch the Market tutorial videos on YouTube
How to buy а trading robot or an indicator
Run your EA on
virtual hosting
virtual hosting
Test аn indicator/trading robot before buying
Want to earn in the Market?
How to present a product for a sell-through
Paid Technical Indicators for MetaTrader 4 - 113
This is the Heiken Ashi Dashboard MT4. This dashboard will scan multiple timeframes and symbols in MT4 platform, from M1 chart to D1 chart. It will send the buy/sell signals by alert on the platform or sending notification to your phone or message you via a email.
The buy signal is generated when the heiken ashi bar changes its color from red to white. The sell signal is is generated when the heiken ashi bar changes its color from white to red. The up/down trend color will be displayed depend

This indicator combines several functionalities: Value Zone Displays two exponential moving averages (EMAs): 13-period EMA in red. 22-period EMA in blue. Impulse System (based on Dr. Alexander Elder's methodology) Candles are color-coded to indicate trade restrictions: Red candles prohibit buying. Green candles prohibit selling. Blue candles allow both buying and selling. Recommended for use on two timeframes for enhanced analysis. 3x ATR Channel A channel based on 3 times the ATR (Average True
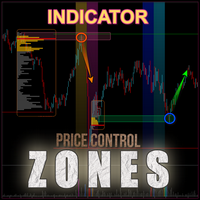
The Bull and Bear Zones indicator is specifically designed for the automatic identification and visual display of support and resistance zones directly on the chart. Its unique algorithm allows it to display not only the zones already tested by the market but also potential target zones that have yet to be tested. The indicator tracks ranges where an imbalance between supply and demand is observed. Key Features: Automatic identification of support and resistance zones : The indicator calculates

MarketEcho Signals is a powerful and innovative technical analysis tool designed to identify high-probability buy and sell signals in the financial markets. By combining trend-following indicators with price action patterns, this indicator helps traders navigate volatile markets with ease. It is based on a 25-period Exponential Moving Average (EMA) to filter trends, ensuring that trades are taken in the direction of the overall market momentum. Key Features : Trend Filter with EMA :
The MarketEc

High, Low, Open, and Close of Candles: Utilizing the Bombafkan Indicator Tool With the Bombafkan Indicator, you can easily view the high, low, open, and close of candles and analyze this price information across different timeframes. This feature helps you perform more accurate analyses and optimize your trading strategies with a comprehensive view of price movements. Additionally, the Bombafkan Strategy includes a setup called the "Candle-Side Signal," which allows you to easily take bu
Enhance your trading with visual clarity — identify trends instantly with dynamic EMA ribbons! Description:
The DMI Dynamic EMA Ribbon is an advanced indicator designed to help traders visualize trend direction and strength using two dynamic exponential moving averages (EMAs). With customizable parameters, this tool enhances your ability to make informed trading decisions by clearly indicating bullish and bearish trends. Key Parameters: Customizable timeframe for moving averages. Period for the

This updated version of the Value Chart indicator introduces new parameters in the way the indicator is calculated. Its main objective is to analyze the current range and attempt to predict the direction of the ongoing candle, displaying an arrow indicating where the candle is expected to move. The calculation structure is based on the last 1,000 candles. First, a weighted average is calculated for each candle. Then, the modified Value Chart calculation is applied to determine the range and str
DMI Smoothed CCI plus: Track Market Trends and Reversals Across Multiple Timeframes The DMI Smoothed CCI plus is a powerful tool for traders, designed to analyze market trends and potential reversals using the Commodity Channel Index (CCI) across multiple timeframes. Ideal for trend-following strategies, this indicator helps you spot overbought and oversold conditions, providing real-time insights that are crucial for optimizing your market entries and exits. Key Features: Multi-Timeframe Analy

What are Fair Value Gaps (FVG)? Fair Value Gaps occur when price moves so quickly that it creates an imbalance between buyers and sellers. These gaps represent areas where price "skipped" levels, creating potential zones for price to return and "fill the gap". Think of it as unfinished business in the market that often gets revisited. They are also considered a support or resistance area because it represents a zone on a chart where there is a significant imbalance between supply and demand, ca
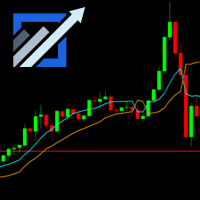
Boost your trading accuracy with the SSL Channel Indicator , designed to identify trends and precise entry points. This dynamic tool adapts to all trading instruments and timeframes. Perfect for scalpers, day traders, and swing traders, the SSL Channel Indicator simplifies market analysis, helping you trade confidently and effectively. Unlock your trading potential today! MT5 Link- https://www.mql5.com/en/market/product/127492
SmartTrend is an indicator that uses artificial intelligence algorithms to optimize trading in the Forex market. It offers traders opportunities to adapt their strategies to market conditions. Key Features of SmartTrend: 1. Automatic StopLoss Calculation : o The indicator determines StopLoss levels based on current volatility, helping to minimize risks. 2. Emergency StopLoss Function : o Activated when market trends change, providing an additional level of protection. 3.

Everyone has heard that 95% of traders lose money, well join the 5% profitable one with 'The 5 Percent.
The 5 Percent Indicator: Join the Elite 5% of Traders. Manage risk and stay in the game by following the trends. Tired of being part of the 95% who lose money? The 5 Percent Indicator is your key to unlocking consistent profitability. This powerful tool provides clear, actionable signals, helping you make informed trading decisions and maximize your returns. Don't miss out on your chance to j

If you ever wanted to know your local time (or NY time) at any bar on the chart without needing to waste time with mental calculations, look no further.
This indicator creates a crosshair which you can drag anywhere on the chart and will show you the local time in a label on top of the time axis.
Press the "c" key to show/hide the crosshair. Left click it to pick it up and drag anywhere, left click again let it go.
You can't hide the crosshair without letting it go first.
Time setting inputs
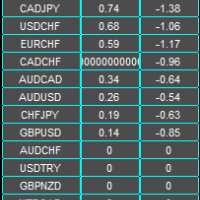
Abbeyfx Swap Dashboard displays your broker swap/interest rate. The implied swap/interest rate differential is for all currency pairs you have in your market watch.
Interest rate differential: The key factor traders consider is the difference in interest rates between two currencies involved in a pair, known as the "interest rate differential
Impact on currency value: A higher interest rate typically makes a currency more attractive, causing its value to rise relative to other currencies with
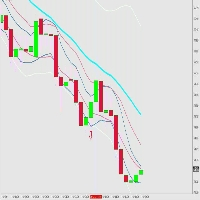
Signal Entry BBMA Low Risk High Reward Entry Friendly Use Using Fibo for TP 1, TP 2 , TP 3 , TP 4, TP 5, TP 6 , TP 7 , TP 8 , TP 9 , TP 10 Entry Low MA or Entry High MA Pair GOLD is The Best Pair EURUSD, GBPUSD, USDJPY Is Good Pair BTCUSD id Good Risk Manajemen only 1% entry and you get Profit 2-10% Recommended Broker https://one.exnesstrack.org/a/yyatk129ng If you want FullMargin Is Good but I recommended using Manajemen your Money
Old Time Frame EMA Индикатор двух динамических уровней сопротивления и поддержки Moving Average.
Данный индикатор рисует на открытом графике младшего тайм фрейма, ЕМА со старшего тайм фрейма. Создан для наглядности сигналов, для входа в рынок, для тех трейдеров, у кого Средние Скользящие Цены (ЕМА или МА),
являются основным сигналом для открытия или закрытия сделок. А также ориентиром, направлением тренда в движении
текущих цен, внутри дня и в среднесрочной торговле.
Возможные типы сред
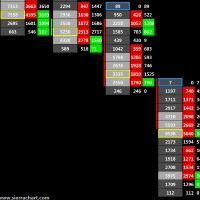
Volume Cluster Indicator for MetaTrader 4: Advanced Analysis of Support, Resistance, and Market Dynamics The Volume Cluster Indicator for MetaTrader 4 is a powerful tool designed for traders seeking an in-depth understanding of market dynamics. It provides detailed insights into volume behavior within each candlestick, highlighting levels where volume is "overpriced" and areas of weakness. This enables precise identification of support and resistance zones, making it indispensable for traders le
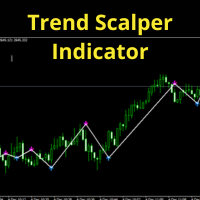
Key Features: Automated Pattern Recognition: The built-in AI analyzes market behavior in real-time to detect high-probability recurring patterns. Recognizes classic formations like triangles, flags, and head-and-shoulders, along with subtle patterns captured by AI. Buy and Sell Signals: Entry signals are displayed directly on the chart via visual arrows (green for buy and red for sell), accompanied by sound alerts and notifications. Automated Trendlines: Dynamically draws support and resistance
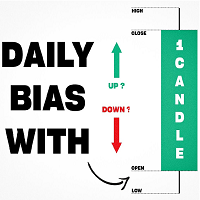
Inspired by TTrades video on daily bias, this indicator aims to develop a higher timeframe bias and collect data on its success rate. While a handful of concepts were introduced in said video, this indicator focuses on one specific method that utilizes previous highs and lows. The following description will outline how the indicator works using the daily timeframe as an example, but the weekly timeframe is also an included option that functions in the exact same manner.
On the daily timefr

This custom indicator for MetaTrader 4 is a powerful tool designed to help traders of all experience levels identify clear trends in the financial market. It is built to provide precise visual support, eliminating the confusion and subjectivity often associated with chart analysis. Additionally, it ensures that you can stay in a profitable position throughout the entire duration of a trend, avoiding premature exits before the movement is fully realized. Identifying Clear Trends The foundation o

The Market Heart indicator scans market entries after high volatility is noticed. Most big moves occur a short time after market volatility. Most big moves occur a short time after market volatility. The idea is to look for entries after the rectangles form and not necessarily as trade entry signals. . For example, you could use the Retracement Feeder indicator that generates arrow signals.
Market Heart MT5 Version
How to use: 1. Primary use The White Box is the first to be formed and

This Simple Smart Money Concepts indicator displays real-time market structure (internal & swing BOS / CHoCH), order blocks, premium & discount zones, equal highs & lows, and much more...allowing traders to automatically mark up their charts with widely used price action methodologies.
"Smart Money Concepts" (SMC) is used term amongst price action traders looking to more accurately navigate liquidity & find more optimal points of interest in the market. Trying to determine where institutional

EMA Cloud System is a Trading System Invented by Ripster where areas are shaded between two desired EMAs. The concept that the EMA cloud area serves as support or resistance for Intraday & Swing Trading. Can be utilized effectively on 10 Min for day trading and 1Hr/Daily for Swings. Ripster utilizes various combinations of 5-12 EMA clouds 34-50 EMA clouds among others. 8-9, 20-21 EMA clouds can be used as well. Adjust what works for you. Ideally 5-12 or 5-13 EMA cloud acts as sold fluid Trendlin
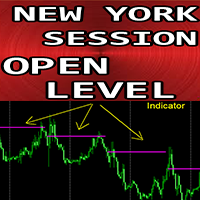
Forex Indicator "New York Session Open Level" for MT4 Indicator "New York Session Open Level" is very useful auxiliary indicator for intraday trading Session open price level is so important because very often price returns back to that area during the day. Indicator shows you NY session open price level daily for each day Also indicator shows week open level on Mondays It is useful for intraday traders to set up targets or use as support/resistance area. // More great Expert Advisors and In
The Binary exfish indicator is designed for binary options trading on M1 and M5 timeframes. It works with any currency pair, analyzing trends and providing entry signals as arrows on the chart: Blue arrow — buy signal. Red arrow — sell signal. Features: Default expiration : 1 candle. Adjustable expiration: from 1 to 3 candles. Signals are displayed before the close of the current candle for timely decisions. Alerts include sound notifications, pop-ups, emails, and mobile app messages. Installati
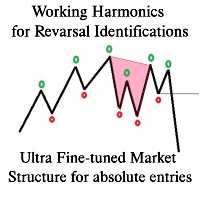
Last & Ultimate Indictor a trader would ever need while trading.
Confirmation Based Harmonic Patterns for Trend Reversal Identification .
Ultra finetuned Candle Based Market structure(not pivot or average based like other noisy indicators) for a sniper & confirmational Entry Added false breakout entry for dual parameter low risk entry
This is the finest structure marking you will ever find in any market. indicator is coded based on actual candle breaks and not coded base

The "BioStar" indicator is an innovative tool for trend analysis on the Forex market. It has unique capabilities and a wide range of settings that will help traders make informed decisions when trading.
This indicator is based on the analysis of the market trend and helps to identify the direction of price movement. It uses various mathematical algorithms and statistical methods to determine the strength and stability of the trend in the market.
One of the key features of the "BioStar" indica
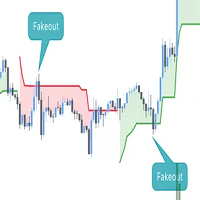
This script is an enhanced version of the classic Supertrend indicator. It incorporates an additional feature that ensures trend reversals are more reliable by introducing a Fakeout Index Limit and a Fakeout ATR Mult. This helps avoid false trend changes that could occur due to short-term price fluctuations or market noise. In smart money concept, when institute , "big-fish" want to buy, they usually sell first to take sellside liquidity and vice versal. This is why the indicator become importan

Accurate entry points for trades for currencies, crypto, metals, stocks, indices! Bonus: When purchasing the indicator, Quantum Entry PRO is provided free of charge. The indicator 100% does not repaint!!! How to use the indicator! If a signal appears, it no longer disappears! Unlike indicators with redrawing, which lead to loss of deposit, because they can show a signal and then remove it. Trading with this indicator is very easy. We wait for the signal from the indicator and enter the transacti

Super Scalp Indicator MT4 is a unique trend reversal 100% non-repainting multi-algo indicator that can be used on all symbols/instruments: forex, commodities, cryptocurrencies, indices, stocks . Super Scalp Indicator MT4 will determine the current trend at its early stages, gathering information and data from up to 10 standard algos When indicator give a valid buy or sell signal, a corresponding arrow will be printed on the chart, open trade at start of the next candle/bar
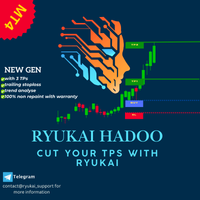
THER IS ERREUR WHILE UPLOADING THE FILE PLEAS CONTACT ME FOR FREE TRIAL RYUKAI HADOO is a professional and easy to use Forex trading system which is based on the best principles of trading using the best estrategys. The indicator provides accurate BUY and SELL signals including Stop Loss and Take Profit levels. You can trade even on the go using PUSH notifications. PLEASE CONTACT ME AFTER PURCHASE TO GET MY TRADING TIPS! If you're familiar with trading, you’ve likely come across popular strate
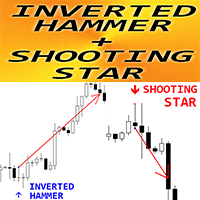
Forex Indicator " Inverted Hammer and Shooting Star pattern" for MT4 Indicator " Inverted Hammer and Shooting Star pattern " is very powerful indicator for Price Action trading: No repaint, No delays; Indicator detects bullish Inverted Hammer and bearish Shooting Star patterns on chart: Bullish Inverted Hammer - Blue arrow signal on chart (see pictures) Bearish Shooting Star - Red arrow signal on chart (see pictures) P C, Mobile & Email alerts are included Indicator " Inverted

Moving average alert plus is an advance moving average alert that will easily monitor the price action based on set moving averages to multiple open charts. Objective: To monitor multiple open charts and notify traders conveniently in a single display panel when using the moving averages to enter/exit a trade. Features: Monitor price action in two timeframes at the same time Supports simple, exponential, smoothed, linear weighted moving averages Trigger an alert based on candle size (full/
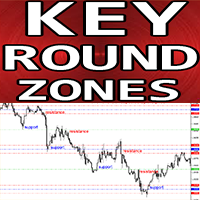
Forex Indicator "Key Round Zones" for MT4 Indicator "Key Round Zones" is must have auxiliary indicator for traders who take support/resistance into consideration 1000 and 500 round levels are respected by the price - price rebounds from them very often Major 1000 levels also have strong Support/Resistance zones (100 points in each side) around it Also 1 000 and 500 round levels are good to place Take Profits (in front of round level) and SL (behind the round level) These levels are part

This product enables you to trade in opportunities that are detected by the indicator. Using advanced Calculations and formulae this product enables you to profit from trend opportunities. Trend master has Channels that show areas the trend is strong and you are likely to profit. Once this zone Is breached the price is on in uncertain territory and there is no guarantee the trend will continue This means there might be reversal and it is advisable to exit a trade here.

Do you want to beat the market? This indicator uses advanced mathematical formulae That include regression analysis to predict market trends. So what happens is That when the price is above the indicator line as depicted in the screenshot The trend is rising and when the price is below the indicator line the Trend is falling. This opportunities appear multiple times each day enabling You to profit. This indicator makes the trend your friend.
Bollinger trading is an indicator for mt4 that uses Bollinger bands and other trend following strategies To detect the direction of the market. Just as attached in the screenshot the light blue line shows areas The market is rising. This means opening positions here is in the direction of the trend. The dark blue lines cane be used for sell trades when the market moves in the opposing direction. Using this tactics you can have a clear sense of where the market is headed.

This product works by detecting trend opportunities. So as shown in the screenshot when The indicator shows an upward arrow it shows the market is on an uptrend and when the indicator Shows a downward arrow it shows the market is on a downward direction. What makes this indicator Special is that it has additional signals just below the arrow signals. It is up to the trader to be Creative and combine these signals with the arrow signal to get accurate forecasts.
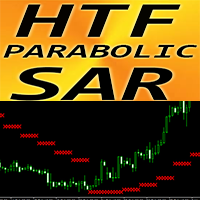
Forex Indicator Parabolic SAR Higher Time Frame for MT4. No repaint. Upgrade your trading methods with great auxiliary HTF PSAR indicator for MT4. H TF means - H igher Time Frame. PSAR is used to determine trend direction and potential reversals in price movement. This indicator is great to use for Trailing Stop purpose. If PSAR is located above the price - it is downward trend. If PSAR is located below the price - it is upward trend. This indicator is excellent to combine with pr

Best Divergence Indicator for advanced traders without distraction of lines or arrows. It is not a magic blackbox for novice traders rather a great tool for experienced traders to decide their entry and exit. Can be used for most of the Forex pairs, Gold, Oil, Crypto. Flexibility to play with input to customize ur unique research too. Therefore, I will suggest turning off arrows and divergence line to reduce clutter and instead use the following advice: For sell on divergence indicator start tu
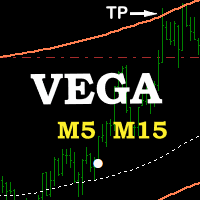
VEGA indicator
VEGA is an indicator designed for scalping and short-term trading, integrated into any chart and financial instrument.
I recommend the M5 and M15 timeframes. The VEGA indicator provides accurate signals.
The indicator uses color-coded circles to signal trading opportunities:
- If a white circle appears, open a buy position (you will receive a BUY alert).
- If a yellow circle appears, open a sell position (you will receive a SELL alert).
I also suggest that you use the inter
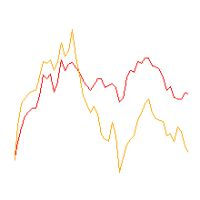
Line1: simple calculation of change in closing price for the chosen input period - named Velocity. Line2: simple calculation of change in velocity for the chosen input period - named Acceleration. Feel free to play with the input periods to find a profitable combination. For faster results it is best to do it in MT Optimizer. Can assist in either manual or automatic trading.
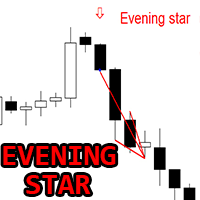
Forex Indicator " Evening Star pattern" for MT4. Indicator "Evening Star pattern" is very powerful indicator for Price Action trading: No repaint, No delay; Indicator detects bearish Evening Star patterns on chart: Red arrow signal on chart (see pictures). P C, Mobile & Email alerts are included. Also its brother - bullish " Morning Star pattern" indicator is available (follow the link below). Indicator " Evening Star pattern" is excellent to combine with Support/Resistan

Two line MACD index composition MACD line (express line) : Usually calculated by subtracting the 12-cycle EMA from the 26-cycle EMA, it is more sensitive to price changes, can quickly reflect the change of the recent price trend, its fluctuation is relatively frequent, used to capture the dynamics of short-term market trends. Signal line (slow line) : Generally a 9-cycle EMA of the MACD line, its role is to smooth the MACD line, filter out some short-term noise and false signals, make the indic

Invisible Ghost is a great arrow indicator for trading in financial markets.
Designed to work with popular technical analysis tools.
The indicator is based on the use of moving averages and Bollinger bands.
These tools help filter out market noise and focus on key moments.
This indicator also analyzes historical market data to improve the accuracy of signals.
Key features: - Simple signals: the indicator displays red arrows for sell signals and blue arrows for buy signals, making the decis

AI Supertrend timely alerts
MT4 Super Trend timely reminder indicator introduction I. Overview of indicators The MT4 Super Trend Alert Indicator is a technical analysis tool specifically designed for the MetaTrader 4 platform to help traders accurately capture changes in market trends and send timely signals to alert traders to potential trading opportunities. It is based on a unique AI-based algorithm that takes into account factors such as price volatility, trend strength, and market volatil
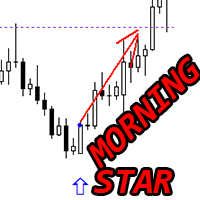
Forex Indicator " Morning Star pattern" for MT4 Indicator "Morning Star pattern" is a very powerful indicator for Price Action trading: No repaint, No delay. Indicator detects bullish Morning Star patterns on chart: Blue arrow signal on chart (see pictures). P C, Mobile & Email alerts are included. Also its brother - bearish " Evening Star pattern" indicator is available (follow the link below). Indicator " Morning Star pattern" is excellent to combine with Support/Resistance Lev
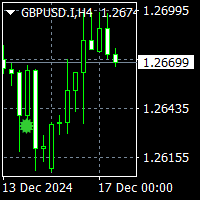
To get access to MT5 version please click here . This is the exact conversion from TradingView: "Exit-Willy Alerts" by " barrettdenning ". This is a light-load processing and non-repaint indicator. All input options are available. Buffers are available for processing in EAs. You can message in private chat for further changes you need. Thanks for downloading
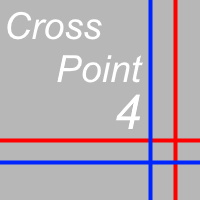
CrossPoint4 is an indicator that helps novice traders.
In addition to the standard "Crosshair" function (Ctrl + F), CrossPoint4 will show you how to set the StopLoss and TakeProfit levels correctly, taking into account the minimum allowable level, calculate the number of points between two points and convert this into the currency of the account, taking into account the expected lot of the transaction.
Sometimes, when opening a deal, a novice trader completely forgets about the spread. After

Divergentor — это продвинутый индикатор предназначенный для выявления дивергенции - точек расхождения цены у двух различных пар с известной корреляцией. Например EURUSD и индекса доллара DXY, USDCHF и EURUSD, ETHUSD и BTCUSD, Nasdaq100 и SP500 и тп. Индикатор использует фундаментальную закономерность движения цены за основным активом и дает преимущество в более раннем определении разворота на текущей паре. Индикатор может быть использован как готовая стратегия входа. Идеально подходит как для
Description of Support and Resistance Indicator Based on Volume Profile for MetaTrader 4 Introduction The financial market is an arena where traders and investors constantly seek ways to gain a competitive edge. One of the most widely used and respected concepts in any market is support and resistance . These levels represent key price zones where supply and demand balance out, and where significant decisions are made by participants who drive the market. Our Support and Resistance Indicator wit

The Pure Price Action ICT Tools indicator is designed for pure price action analysis, automatically identifying real-time market structures, liquidity levels, order & breaker blocks, and liquidity voids. Its unique feature lies in its exclusive reliance on price patterns, without being constrained by any user-defined inputs, ensuring a robust and objective analysis of market dynamics. Key Features Market Structures A Market Structure Shift, also known as a Change of Character (CHoCH), is a pivot
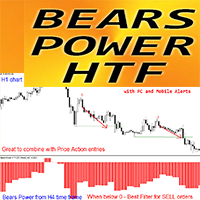
Forex Indicator Bears Power HTF for MT4 Bears Power HTF oscillator is a great filter for "SELL" entries . H TF means - H igher Time Frame. Bulls and Bears Power indicators are used in trading to measure the strength of corresponding trends in trading. Bears Power measures the strength of sellers' position. Bears Power HTF indicator is excellent for Multi-Time Frame trading systems with Price Action entries or in combination with other indicators. This Indicator allows you to at

MT4 platform AI T3 MA Super Fill indicator use introduction I. Overview of indicators
The AI T3 MA Super Fill indicator is a powerful analytical tool that combines advanced algorithms and T3 moving average technology to provide traders on the MT4 platform with accurate market trend judgments and trading signals. It uses intelligent algorithms to deeply process the price data, and displays the changes of the T3 moving average in a unique way to help traders more effectively grasp the market dyn
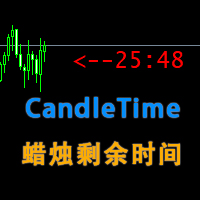
MT4CandleTime index introduction
MT4CandleTime is an indicator for the MT4 platform, which can display the remaining time of the current K line in the form of an intuitive digital countdown, which is convenient for traders to grasp the trading rhythm.
Precise time control: The MT4CandleTime indicator provides traders with extremely accurate K-line remaining time data, enabling them to fine manage the time rhythm in the trading process, avoiding the hasty or delayed trading decisions caused by
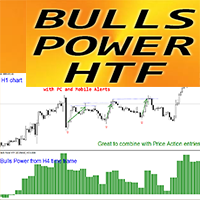
Forex Indicator Bulls Power HTF for MT4 Bulls Power HTF oscillator is perfect filter for "buy" entries. H TF means - H igher Time Frame. Bulls and Bears Power indicators are used in trading to measure the strength of corresponding trends in trading. Bulls Power measures the strength of buyers' position.
Bulls Power HTF indicator is excellent for Multi-Time Frame trading systems with Price Action entries or in combination with other indicators. This Indicator allows you to atta
Introduction to the use of MT4 platform AI Color Gradient Volume indicators I. Overview of indicators
AI Color Gradient Volume is an innovative volume analysis indicator based on artificial intelligence technology for the MT4 platform. By converting the volume data into an intuitive color gradient graph, it helps traders to have a more acute insight into the inflow and outflow of funds in the market and the strength of the buying and selling forces, so as to provide strong support for trading
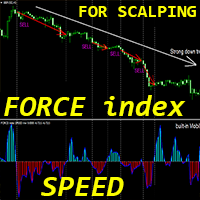
Forex Indicator " Force index Speed" for MT4, No repaint. The calculation of this indicator is based on equations from physics. Force index Speed is the 1st derivative of Force index itself. F orce index is one of the top indicators that combines price and volume data into a single value. Force index Speed is good for scalping entries into the direction of main trend: u se it in combination with any suitable trend indicator. Force index Speed indicator shows how fast Force index itsel

AI Pearson Trend!!
My name is Murat Yazici. I am a PhD candidate in Statistics.
I have several papers, writing books, book chapter studies, and several conference presentations and experiments about analytical modeling. About me: https://tinyurl.com/pjejextx The AI Pearson Trend indicator is a novel trend-based indicator including Fuzzy statistical modeling.
You can use it on all currencies and timeframes, not including M1 timeframes.
For best performance, check a trend to see if it is the sam
This custom trading indicator utilizes the Average True Range (ATR) to identify buy and sell opportunities based on price movement. It can optionally employ Heikin Ashi candles to reduce noise and produce smoother signals. The indicator is optimized for use on a 1-hour timeframe and is designed for long-term trading strategies. Works best with symbols: AUDUSD, EURUSD, USDJPY, GBPUSD, US500, US30, XAUUSD, BNBUSD Configure Settings : Configure Settings : Set KeyValue to 9.0 . Set ATRPeriod to 11 .
HTF Heiken Ashi Candles MT4is an indicator which plots the bigger version of the higher time-frame Heiken Ashi Candles on the lower candle. The indicator plots only closed candles, with no lag or repainting. i.e. Once the higher time-frame candle has closed, it is immediately plotted on the lower time-frame. this is done to keep your chart simple, and make you more focused.
The indicator also allows you to choose different higher time-frames for each lower time-frame at the first loading of the
HTF Fair Value Gaps MT4 is an indicator which plots the bigger version of the higher time-frame Fair Value gaps on the lower time-frame chart. The indicator plots only fair value gaps from closed candles, with no lag or repainting. i.e. Once the higher time-frame candle has closed, if it left behind a fair value gap, it is immediately plotted on the lower time-frame. The FVGs can be plotted in three ways, which can be selected via input.
Only on last candle: In this case the FVG will be plotted
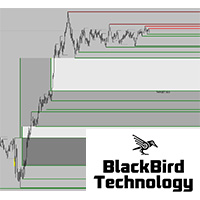
New market liquidity indicator, more accurate with two levels, will really unhide the "hidden agenda" of the price action in any timeframe. Forget all other indicator and use what professional traders are using ! For more information about market liquidity, a manual on how to use this indicator please send me a message.
A lot of information can be found on the net. (search liquidity trading/ inner circle trader)
https://www.youtube.com/watch?v=yUpDZCbNBRI
https://www.youtube.com/watch?v=2LIad2
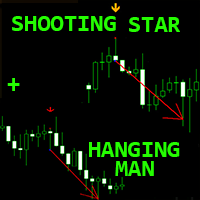
Crypto_Forex Indicator " Hanging_Man and Shooting_Star patterns" for MT4 Indicator " Hanging_Man and Shooting_Star patterns " is very powerful tool for Price Action trading: No repaint, No delay; Indicator detects bearish Hanging_Man and Shooting_Star patterns on chart: Bearish Hanging_Man - Red arrow signal on chart (see pictures). Bearish Shooting_Star - Orange arrow signal on chart (see pictures). With PC, Mobile & Email alerts. Indicator " Hanging_Man and Shooting_Star" is excelle

Wave Trend Pro: Market Trend Analysis Tool Key Features Smart Signal Analysis Provides structured BUY/SELL signal insights Helps detect potential trend reversals Assists in exit point identification Offers real-time market condition tracking Advanced Visual Analytics Color-coded trend strength representation Dynamic trend momentum evaluation Market volatility tracking system Noise reduction filtering for clarity Performance Benefits Designed for efficient signal processing Developed to improve
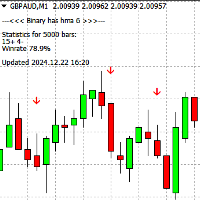
The Binary HH 6 indicator is designed for binary options trading and works on M1 and M5 timeframes with any currency pair. It can also be used for Forex trading. Key Features: Expiration: Default setting is 1 candle, but you can adjust the expiration period from 1 to 3 candles in the settings. Trend Analysis: The indicator works with the trend and provides signals in the form of arrows on the chart: Blue Arrow – Buy signal. Red Arrow – Sell signal. Alerts: Signals are displayed as buffer arrows
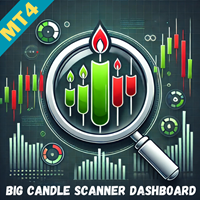
Overview The Big Candle Scanner Dashboard MT4 is a powerful multi-currency, multi-timeframe scanner designed to detect significant bullish and bearish candles across various symbols and timeframes. This tool helps traders quickly identify potential breakout or reversal opportunities based on big candle formations. The scanner monitors all major, minor, and exotic currency pairs, including popular symbols like BTCUSD and XAUUSD. It scans across all timeframes from M1 to MN1, ensuring comprehensi
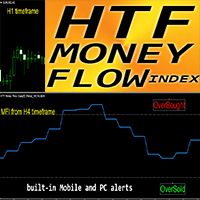
Crypto_Forex Indicator HTF MFI Oscillator for MT4. Money Flow Index (MFI) is a technical oscillator which uses price and volume data for identifying oversold and o verbought zones. HTF means - H igher TimeFrame. Overbought - when the MFI is above 80 and Oversold - when it is below 2 0. MFI is great to combine with price Action. It provides information regarding bullish and bearish price momentum.
This indicator is excellent for Multi-Time Frame trading systems in

Zone to Zone Indicator for MT4 Introducing the "Zone to Zone" indicator for MetaTrader 4, designed to enhance your trading strategy with precision and versatility. Key Features: Accurate Historical Resistance/Support Zones : Effortlessly identify key resistance and support zones on your chart, drawn with pinpoint accuracy. Highly Configurable : Tailor the indicator to your specific needs with a wide range of input parameters. Customizable Parameters : Specify the length, width, and number of hig

The correlation indicator is an analytical tool used to measure the relationship between two or more currency pairs or financial assets in the market. This indicator helps traders understand how the price movement of one asset affects or relates to the movement of another asset. Correlation is typically expressed in values ranging from -1 to +1: Positive correlation (+1) : Indicates that two assets move in the same direction. Negative correlation (-1) : Indicates that two assets move in opposite
Do you know why the MetaTrader Market is the best place to sell trading strategies and technical indicators? No need for advertising or software protection, no payment troubles. Everything is provided in the MetaTrader Market.
You are missing trading opportunities:
- Free trading apps
- Over 8,000 signals for copying
- Economic news for exploring financial markets
Registration
Log in
If you do not have an account, please register
Allow the use of cookies to log in to the MQL5.com website.
Please enable the necessary setting in your browser, otherwise you will not be able to log in.