Regardez les tutoriels vidéo de Market sur YouTube
Comment acheter un robot de trading ou un indicateur
Exécutez votre EA sur
hébergement virtuel
hébergement virtuel
Test un indicateur/robot de trading avant d'acheter
Vous voulez gagner de l'argent sur Market ?
Comment présenter un produit pour qu'il se vende bien
Indicateurs techniques pour MetaTrader 4 - 24

L'indicateur construit un éventail de lignes de tendance (après avoir cliqué sur une certaine bougie), similaire aux angles de Gann classiques. La particularité de l'indicateur est qu'il construit des angles non seulement sur une échelle fixe, mais utilise également le prix moyen d'un certain nombre de barres (facultatif).
Il existe deux façons de calculer le prix moyen des cornières dans l'indicateur (facultatif) :
1) calcul du mouvement de prix moyen (pour un certain nombre de barres) du plu

Véritable indicateur de l'offre et de la demande - vous permettra de déterminer rapidement l'emplacement des niveaux de résistance et de support sur toutes les périodes. L'indicateur sera utile pour ceux qui utilisent l'analyse technique dans leur trading. L'indicateur est facile à utiliser, il suffit de glisser-déposer sur le graphique et l'indicateur vous montrera les niveaux de support et de résistance les plus probables. Lorsque vous changez de période, vous verrez les niveaux de la n

- Real price is 90$ - 50% Discount ( It is 45$ now )
Contact me for instruction, any questions! Introduction V Bottoms and Tops are popular chart patterns among traders due to their potential for identifying trend reversals. These patterns are characterized by sharp and sudden price movements, creating a V-shaped or inverted V-shaped formation on the chart . By recognizing these patterns, traders can anticipate potential shifts in market direction and position themselves accordingly
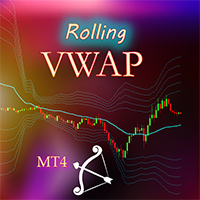
Ceci est l'indicateur Rolling VWAP pour MetaTrader. Il calcule le Prix Moyen Pondéré par Volume (VWAP) en fonction du volume des ticks pour un nombre déterminé de chandeliers, avec des bandes de déviation standard optionnelles pour une analyse de marché plus approfondie. Cet indicateur ne se redessine pas et n'est pas ancré. Vue d'ensemble de l'indicateur Calcul du Rolling VWAP : La ligne principale (couleur aqua) calcule le VWAP pour un nombre spécifique de barres ( barsToCalculate ). Ce VWAP e

The Moving Average Crossover Dashboard indicator is a technical tool that displays the crossovers of 2 selected moving averages on the price chart indicating whether it is a bullish or bearish crossover. In addition, as its name indicates, it shows a signal dashboard that indicates in which market and time frame a crossover of the two moving averages occurs. In the setting window the user can select the markets and time frames that can be displayed on the dashboard. You also have the option

SignalPinner is a trend line Indicator which can detect market trends early by including three types of signal arrows. Non repaint and trend following. Signals on the strong trend, signals in the beginning of trend and signals with multiple market analysis algorithm as the main signals. Supported by alert notification message to keep you getting signals while on the go. Symbols: Any Timeframes: Any
Features Histogram buffers as a sign the trend is started. It can help the trader knowing the mar
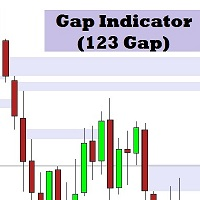
Indicateur d'Écart (Écart 123) : Outil de Précision pour Identifier les Objectifs de Prix Potentiels L'Indicateur d'Écart (Écart 123) est un outil puissant conçu pour identifier les objectifs de prix à forte probabilité basés sur la structure du marché. En analysant des ensembles de trois bougies consécutives, cet indicateur repère des écarts cruciaux qui servent souvent d'aimants pour l'action des prix. Fonctionnement Analyse Continue : L'indicateur scanne chaque ensemble de trois bougies con

MT4 Multi-timeframe Divergence and Overbougt/Oversold detection indicator.
Features - Fully customizable on chart control panel, provides complete interaction. - Hide and show control panel wherever you want. - Real time information about non-capitalized divergences. - Real time information about overbougt / oversold situations. - Real time information about regular divergences. - Real time information about hidden divergences. - Oscillators available for divergences detection: AO, RSI, CCI, MA
Highly configurable Moving average indicator.
Features: Highly customizable alert functions (at levels, crosses, direction changes via email, push, sound, popup) Multi timeframe ability Color customization (at levels, crosses, direction changes) Linear interpolation option Works on strategy tester in multi timeframe mode (at weekend without ticks also) Parameters:
MA Timeframe: You can set the lower/higher timeframes for Ma. MA Bar Shift: Y ou can set the offset of the line drawing. MA Period,
FREE

Découvrez la puissance de l'analyse des volumes avec notre indicateur de profil de volume pour Metatrader ! / Version MT5
Basic Volume Profile est un indicateur spécialement conçu pour les traders manuels qui cherchent à optimiser leur trading. L'indicateur Volume Profile est un outil essentiel pour tout trader sérieux cherchant à mieux comprendre le comportement du marché. Grâce à notre solution innovante, vous pouvez visualiser de manière claire et concise la manière dont le volume des trans
L'indicateur Optimal Trailing TP peut fonctionner à la fois comme un outil d'entrée et comme un outil de suivi des bénéfices. Sa conception unique lui permet de fournir des signaux d'achat et de vente. Si vous êtes déjà en position, vous pouvez ignorer les flèches de signal. Si vous n'êtes pas en position, les flèches peuvent vous alerter d'un mouvement dans cette direction sur l'échelle de temps ou la paire de devises sur laquelle l'indicateur est réglé. Ainsi, vous pouvez soit utiliser les flè
FREE

Si vous aimez ce projet, laissez un examen 5 étoiles. Comme les institutions échangent de gros volumes, il n'est pas rare pour eux
d'essayer de
défendre leur position à des niveaux de pourcentage spécifiques. Ces niveaux serviront de support naturel et de résistance que vous pouvez
utiliser
soit pour entrer dans un commerce ou être conscient des dangers possibles contre
votre position. Un exemple de pourcentages usuels est de 0,25% et de 0,50% sur EURUSD pour le
semaine, vous pouvez voir cet
FREE

The MT4 indicator that we are describing is designed to provide traders with an alert, notification, and email when Fibonacci levels are crossed. The Fibonacci levels are calculated based on the zigzag indicator, which helps to identify potential trend reversals in the market. When the indicator detects that a price has crossed a Fibonacci level, it will trigger an alert and send a notification to the trader's MT4 mobile app. Additionally, the indicator can be configured to send an email to the
FREE

The Hull Moving Average (HMA), developed by Alan Hull from 2005, one of the most fast-moving Average, reduce lag and easy to use to identify Trend for both Short & Long term. This Indicator is built based on exact formula of Hull Moving Average with 3 phases of calculation: Calculate Weighted Moving Average (WMA_01) with period n/2 & (WMA_02) with period n Calculate RAW-HMA: RAW-HMA = 2 * WMA_01(n/2) - WMA_02(n)
Weighted Moving Average with period sqrt(n) of RAW HMA HMA = WMA (RAW-HMA, sqrt(n)
FREE

How the Indicator Works:
This is a Multi-timeframe MA multimeter indicator which studies if price is above or below a particular EMA range and shows Red/Green/Yellow signals. Red: Price Below EMA range Green: Price above range Yellow: Price within range
Indicator Properties:
EMA Settings: - Default Period is 200. You can change all MA Settings like Period, MA Method (SMA, EMA, etc) or MA Applied Price (Close, Open, etc).
- EMA Range list is a comma separated value list for different timeframes
FREE

Ultimate Divergence Scanner (Multi Pair And Multi Time Frame) : ---LIMITED TIME OFFER: NEXT 25 CLIENTS ONLY ---46% OFF REGULAR PRICE AND 2 FREE BONUSES ---SEE BELOW FOR FULL DETAILS It is a widely known market principle that momentum generally precedes price.
Making divergence patterns a clear indication that price and momentum are not in agreement.
Divergence patterns are widely used by institutional traders around the world. As they allow you to manage
your trades within strictly defin
Trend AI Indicator Description:
Le Trend AI Indicator est un outil puissant d'analyse de marché qui utilise l'intelligence artificielle pour identifier les tendances et les niveaux clés. L'indicateur s'adapte automatiquement aux conditions changeantes du marché, fournissant des données précises pour la prise de décision. Fonctionnalités principales: Identification de la tendance: L'indicateur utilise des algorithmes d'apprentissage automatique pour déterminer avec précision la direction de la
Индикатор предназначен для разметки ,фибо уровней и фибо зон.Также есть возможность удаления и редактирования уровней на текущем графике. При установке нескольких индикаторов (FIBO-ZONES)на график,не забывайте менять имя в поле (NAME).В утилите также есть возможность менять цвет зон, толщину линий и стиль линий уровней фибо. При установке индикатора ,зоны выстраиваются автоматически.
FREE

Introducing MACD Jurik—an advanced indicator designed to enhance your forex trading strategy by integrating custom moving averages based on the Moving Average Convergence Divergence (MACD) with the MetaTrader 4 indicator, MACD.
Jurik moving averages are renowned for their accuracy and reliability in analyzing price movements in the forex market. They offer traders smoother representations of price action, reducing noise and providing clearer signals for identifying trends and potential reversa
FREE

Ultimate Double Top Scanner (Multi Pair And Multi Time Frame) : ---LIMITED TIME OFFER: NEXT 25 CLIENTS ONLY ---46% OFF REGULAR PRICE AND 2 FREE BONUSES ---SEE BELOW FOR FULL DETAILS Any major price level that holds multiple times, is obviously a level that is being defended by
the large institutions. And a strong double top pattern is a clear indication of institutional interest.
Double top patterns are widely used by institutional traders around the world. As they allow you to manage
yo

CPR Pivot Lines It Will Draw Pivot Point R1,R2,R3 S1,S2,S3 Tc Bc Best Part Is That You Can Even Add Values Of High,Low,Close Manually Also To Get Your All Levels On Chart. So If Your Broker Data Of High ,Low ,Close Is Incorrect Then You Don’t Have To Depend On Them Anymore. You Can Even Modify All Lines Style. It Will Show Line In Floating Style And Not Continues Mess.
FREE

Indicator automatically draw bullish and bearish engulfing without any rules. Bearish and Bullish engulf is well known area for supply and demand area marking. This indicator can be used in any strategy that required supply demand zone. Show Last Engulf : Enable this option to show unfresh engulfing Candle to calculate : set 0 will load all history bar and can use up more memory Bearish Engulfing Colour : Pick any colour that suit Bearish Engulfing Colour : Pick any colour that suit
-Use this
FREE
Wave Entry Alerts Oil is a custom indicator developed by Azad Gorgis for MetaTrader 4. This indicator is designed to provide alerts based on ZigZag patterns, specifically tailored for trading on the Oil (XIT/USD) symbol.
Key Features: - Chart Window Indicator: The indicator is designed to be displayed on the main chart window. - Arrow Signals: The indicator generates arrow signals on the chart, indicating potential reversal points based on ZigZag patterns. - Customizable Parameters: Traders ca
FREE
Crosshair Levels : Free version of Object Synchronizer. ** No synchronization of objects among grouped charts and no group chart features supported in this version. Are you bored to save and load template many times for the same symbol for many chart time frames? Here is the alternative. With this indicator, you enjoy creating 3 objects. All objects that you created/modified always are moved easily with clicking the object, moving cursor to the point you wanted and clicking again). Supported
FREE

The Simple ICT Concepts Indicator is a powerful tool designed to help traders apply the principles of the Inner Circle Trader (ICT) methodology. This indicator focuses on identifying key zones such as liquidity levels, support and resistance, and market structure, making it an invaluable asset for price action and smart money concept traders. Key Features Market Structure : Market structure labels are constructed from price breaking a prior swing point. This allows a user to determine t

Having to check constantly if your RSI has reached a specific level can be tedious and draining at times, especially if you have to monitor different asset classes at a time. The Alert RSI indicator will assist in this task, ensuring that you get the most with little effort. When the RSI values get to a specified level, the alerts will go off, on the chart, on the MT4 phone app or via email (You can receive text messages to your phone if you activate texts on your Gmail account). The indicator d
FREE

Long Term trend analyzer according to proprierty Algorithm and multiple EMA. Works best on H1-H4 Time Frame. We are using this indicator in our Main Fund. Ready to use.
- Setup in any Pair, Equity - H1-H4 Timeframe - Best during main Trading times like Asian-European-American Time - NON REPAINTING
Analyze long term trend. Comes with Alarm, Notifications, Push Signals. Get a signal and enter the Markets.
FREE

Key Price Levels Indicator Indicator that shows the highs and lows for the significant price levels for past periods that could be potentially considered as reaction levels. The indicator displays the following price levels: Yesterday high and low The day before yesterday high and low Two days back high and low Last week high and low Last month high and low Last three month high and low (Quarter) Last year high and low
FREE

New Support and Resistance Indicator with Probabilities and Alerts Description: Maximize your profits with the newest Support and Resistance indicator! Our indicator automatically calculates support and resistance levels based on 24-hour analysis periods and provides detailed probabilities for each level. Additionally, you can set up custom alerts to be notified when the price touches specific levels, directly on your mobile device. Features: Support and resistance analysis based on hourly data
FREE

Pivot Classic, Woodie, Camarilla, Fibonacci and Demark
Floor/Classic Les points pivots, ou simplement les pivots, sont utiles pour identifier les niveaux de support/résistance potentiels, les fourchettes de négociation, les inversions de tendance et le sentiment du marché en examinant les valeurs hautes, basses et de clôture d'un actif. Les points pivots Floor/Classic peuvent être calculés comme suit. Pivot Point (P) = (High + Low + Close)/3 S1 = P * 2 - High S2 = P - (High - Low) S3 = Low – 2*
FREE
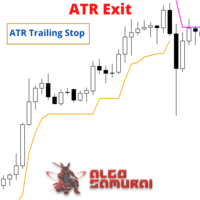
The ATR Exit indicator uses the candle close + ATR value to draw trailing stop lines (orange under buys, magenta over sells) that advance with the trend until the trend changes direction. It uses a multiple of the Average True Range (ATR), subtracting it’s value from the close on buy, adding its value to the close on sell. Moreover, the trailing stop lines are generated to support the order’s trend direction (long or short): In an upward trend, the long trailing stop line (orange line under bu
FREE

The relative strength index (RSI) refers to a momentum indicator that analyses the pace and variation of price movements. The value of RSI ranges from 0 to 100. Its purpose is to track price momentum changes. When the RSI of a security is above 70, it is considered overbought; it is deemed over sold when it is less than 30. The Relative Strength Index is a technical indicator primarily used in the financial markets. For example, the relative strength Index in the stock market gives buying or
FREE

GTAS FidTdi is a trend indicator using combination of volatility and potential retracement levels. This indicator was created by Bernard Prats Desclaux, proprietary trader and ex-hedge fund manager, founder of E-Winvest.
Description The indicator is represented as a red or green envelope above or under prices.
How to use Trend detecting When the envelope is green, the trend is bullish. When it is red, the trend is bearish.
Trading Once a trade is opened, GTAS FibTdi shows retracement zones wh
FREE
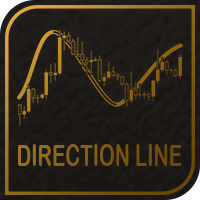
The Direction Line indicator shows you if the current market is in a up trend or uf ut's in a down trend. The sensitivity of the trend calculation ist customizable. You can adjust it till it fit's your strategy. Even as a beginner is this indicator easy to use and you'll see every trend.
Key Features of Direction Line Real-time trend calculations of all time frames Graphical Interface Identical calculation for all time frames Customizable trend sensivity No repainting
Settings / Inputs
Sensit
FREE

Necessary for traders: tools and indicators Waves automatically calculate indicators, channel trend trading Perfect trend-wave automatic calculation channel calculation , MT4 Perfect trend-wave automatic calculation channel calculation , MT5 Local Trading copying Easy And Fast Copy , MT4 Easy And Fast Copy , MT5 Local Trading copying For DEMO Easy And Fast Copy , MT4 DEMO Easy And Fast Copy , MT5 DEMO MACD is called Convergence and Divergence Moving Average, which is developed from the double e
FREE

The Stochastic RSI indicator (StochRSI) is essentially an indicator of an indicator. It is used in technical analysis to provide a stochastic calculation to the RSI indicator. This means that it is a measure of RSI relative to its own high/low range over a user defined period of time. The Stochastic RSI is an oscillator that calculates a value between 0 and 1 which is then plotted as a line. This indicator is primarily used for identifying overbought and oversold conditions.
FREE
McS Super Trend -This is one of the most popular classic trend indicators. It has a simple setting, allows you to work not only with the trend, but also displays the stop loss level, which is calculated by this indicator. Benefits:
Instruments: Currency pairs , stocks, commodities, indices, cryptocurrencies. Timeframe: М15 and higher. Trading time: Around the clock. Shows the direction of the current trend. Calculates the stop loss. It can be used when working with trading. Three types of not
FREE

[As of Jan 18, downloaded by 125 traders] [ Disclaimer ] We're letting u download it for free to support the launch of the main products & training for CyberBot Members ! Hurry up download limited quota. The cool part is u can use it on your chart without having to run it with the main product. Just a heads up, though—alerts might pop up since this product isn't linked to the main one. Plus, you can experiment with it by downloading the free trial of the following main products 8 Symbols
FREE
"IF YOU'RE LOOKING FOR A UNIQUE TRADING INDICATOR TO TRADING…AT AN AFFORDABLE PRICE…YOU'VE COME TO THE RIGHT PLACE!" To create the PERFECT strategy, the Perfect one for you, you need to experiment with all ways and forms of trading. You have to find the strategy that gives the best results. In forex trading, like any business, there are some rules that must be followed, which are disturbing for now, many adhere to the rule that if a system has losses, it is not profitable. The best indicator and

BuySell Volume is an indicator that approximates Buy and Sell volumes based on price movement. Input Description: applied_model: Choose the applied model. In low reversal mode, price is considered receive low bearish pressure during bullish candle's creation (high bearish pressure on high reversal model. In other words, Bullish Marubozu candles has really high Buy Volumes in low reversal model than in high reversal one.
Output Description: Buy and Sell Volume: Determines how many Buy and Sell vo
FREE

Améliorez votre expérience de trading avec l'indicateur Your Chart ! Cet outil gratuit et hautement personnalisable permet aux traders de fusionner plusieurs unités de temps en un affichage unique et clair des chandeliers, sans modifier le graphique original. Avec Your Chart, vous pouvez définir le nombre de barres par chandelier personnalisé – par exemple, combiner chaque 18 chandeliers M1 en un seul pour avoir une vue plus large des tendances du marché. Caractéristiques principales : Formation
FREE

Defines extremes. This indicator consists of two parts. The first draws lines on the chart indicating low volatility in relative daily market activity. The second is responsible for determining the extremum and gives signals to buy or sell. This system is suitable for all instruments. It is recommended to use a timeframe from m15 to h4. Before using, you need to choose the settings for yourself. Configure lines deviation. Specify volatility coefficient. Advantages The indicator does not repaint
FREE

Rejoignez le Canal Koala Trading Solution dans la communauté MQL5 pour découvrir les derniers signaux, les actualités sur tous les produits Koala. Le lien d'adhésion est ci-dessous : https://www.mql5.com/en/channels/koalatradingsolution La description :
nous sommes heureux de vous présenter notre nouvel indicateur gratuit basé sur l'un des indicateurs professionnels et populaires du marché des changes (PSAR). Cet indicateur est une nouvelle modification de l'indicateur SAR parabolique origi
FREE

Rainbow MT4 is a technical indicator based on Moving average with period 34 and very easy to use. When price crosses above MA and MA changes color to green, it’s a signal to buy. When price crosses below MA and MA changes color to red, it’s a signal to sell. The Expert advisor ( Rainbow EA MT4) based on Rainbow MT4 indicator, as you can see in the short video below is now available here .
FREE

An indicator for visualizing time ranges of key trading sessions: Asian, European, and American. The indicator features functionality for setting the start and end times of each trading session, as well as an adjustable timezone of the trading server. The main advantages of the indicator include the ability to operate with minimal CPU load and memory usage. Moreover, it offers the option to specify the number of displayed historical days, providing the user with flexible market dynamics analysis
FREE

[Deviation of each indicator MT4] is a collection of 18 indicators, and one of them can be arbitrarily selected to participate in the calculation. It can calculate the deviation form of each indicator and can prompt an alarm.
Parameter setting description:
[indicators] is to choose one of the 18 indicators to participate in the calculation (this parameter is very important) .
[period] is a common cycle for each indicator.
[Method] is the MA mode of some indicators.
[Apply_to] is the applic
FREE

AI Scalper est un indicateur qui utilise des algorithmes et des technologies d'intelligence artificielle pour optimiser le trading sur le marché Forex. Cet indicateur propose deux niveaux de TakeProfit , permettant aux traders d'adapter leurs stratégies aux conditions actuelles du marché et de maximiser les bénéfices. Fonctionnalités clés de AI Scalper : Two levels of TakeProfit : Définissez différents objectifs de profit, offrant ainsi de la flexibilité dans le trading en fonction de la sit

Indicator SR levels true in small time frames is very useful for scalping while in bigger ones it is good for day or position trading.
SR levels true can draw 4 support/resistance levels based on defined maximum rebouds from price level. Indicator scans defined number of bars in time axis and defined number of pips in price axis (both sides - up and down) and calculates how much times price was rejected from scanned price levels. At the price levels where maximum rebounds are counted, support
FREE
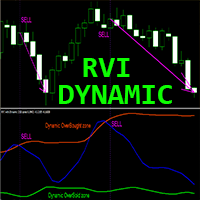
Indicateur Crypto_Forex "RVI avec zones dynamiques de surachat/survente" pour MT4, sans repeinture.
- L'indice de vigueur relative (RVI) lui-même est un indicateur de momentum technique qui est très utile sur les marchés de tendance. - Il est idéal pour les entrées de vente à partir de la zone de surachat dynamique et les entrées d'achat à partir de la zone de survente dynamique. - L'indicateur peut être utilisé sur n'importe quelle période, mais il est particulièrement efficace sur les grande

Currency Strength Meter is the easiest way to identify strong and weak currencies. This indicator shows the relative strength of 8 major currencies + Gold: AUD, CAD, CHF, EUR, GBP, JPY, NZD, USD, XAU. Gold symbol can be changed to other symbols like XAG, XAU etc.
By default the strength value is normalised to the range from 0 to 100 for RSI algorithm: The value above 60 means strong currency; The value below 40 means weak currency;
This indicator needs the data of all 28 major currency pairs a
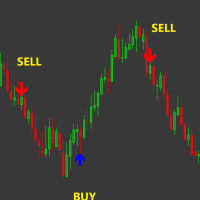
L'indicateur d'achat et de vente mt4 est un indicateur de signal qui montre les points de baisse des prix au commerçant. Aux endroits où la flèche apparaît, l'indicateur indique au commerçant qu'une baisse des prix est possible pour une longue ou une courte distance. Ainsi, le trader peut saisir ces moments et ouvrir des trades. Cela fonctionne bien pour le trading avec une stratégie de salping. Vous voyez qu'une flèche apparaît, ouvrez une commande dans le sens de la flèche et placez un TakePr

The indicator My Big Bars can show bars (candles) of a higher timeframe. If you open an H1 (1 hour) chart, the indicator puts underneath a chart of H4, D1 and so on. The following higher timeframes can be applied: M3, M5, M10, M15, M30, H1, H3, H4, H6, H8, H12, D1, W1 and MN. The indicator chooses only those higher timeframes which are higher than the current timeframe and are multiple of it. If you open an M30 chart (30 minutes), the higher timeframes exclude M5, M15 and M30. There are 2 handy
FREE

This indicator applies the biquad high pass filter to the price-chart data, and displays the filter output for the OHLC as candlesticks. The candlesticks corresponds to the actual calculations of the filter value during the formation of each price bar (not from all historical highs lows or closes). The shape of the bars therefore corresponds directly to the shape of each price bar. High pass filters are an underappreciated type of oscillator that are seldom used in technical analysis in the st
FREE
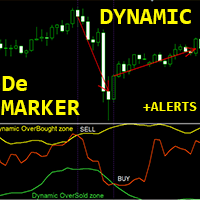
Indicateur Forex "DeMarker avec zones dynamiques de survente/surachat" pour MT4. Pas de repeinture.
- La courbe d'oscillateur DeMarker indique la position actuelle du prix par rapport aux hauts et bas précédents pendant la période de calcul de l'indicateur. - Il est idéal pour effectuer des entrées de vente à partir de la zone de surachat dynamique et des entrées d'achat à partir de la zone de survente dynamique. - Cet indicateur est également excellent à combiner avec les entrées Price_Action
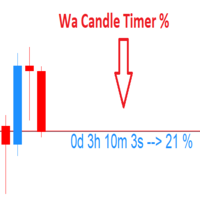
Wa Candle Timer Percentage MT4 est un indicateur qui montre à l'utilisateur combien de temps il reste avant l'ouverture de la prochaine bougie. Le pourcentage d'évolution de la bougie actuelle est aussi montré sur l'écran. L'utilisateur peut configurer le pourcentage auquel le candle timer changera de couleur. Voici les paramètres: 1 - Le pourcentage auquel le candle timer changera de couleur. 2 - couleur de la minuterie de la bougie, quand le pourcentage d'évolution de la bougie actuelle est
FREE

A fractal divergence is a hidden divergence , based on Bill Williams' fractals. A bullish fractal divergence is a combination of two lower fractals, the last of which is located below the previous one, and, at the same time, two candles to the right of the Low of the last fractal have Lows higher than the previous fractal level (see screenshot 1). A bearish fractal divergence is a combination of two adjacent upper fractals, the last of which is located above the previous one, but, at the same ti
FREE

Broken Trends is an indicator for scalpers and intraday traders. The indicator selects and displays trend levels on the chart in the real time mode. The indicator reacts to price momentum: it starts searching for the trends as soon as the momentum amplitude exceeds the threshold set in a special parameter. The indicator can also play a sound when the price crosses the current trend line. In normal mode, the indicator shows only one (last found) upward and one downward trend, but there is an adva
FREE
IntradaySignals Intraday Signals is a visual and effective semi-automatic trading system, that: generates possible entry points to open BUY and SELL trades; displays recommended Take Profit and Stop Loss; displays current profit on open trade; displays current spread. The profitability of the indicator is shown in the screenshot on the example of the GBPUSD pair Does not redraw and works on opening bar. Time frames - M1-H1. Recommended TimeFrame-M5-M15. Signals are produced based on the used
FREE
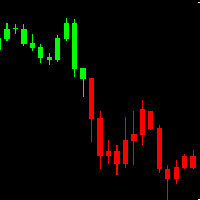
AH Candles MT4 AH Candles MT4 is a new product that allows identifying the current market phase (uptrend and downtrend ).
This indicator paints bars in different colors depending on the current state of the market trend ( Green and Red )
AH Candles MT4 is use for trading currencies
Advantages Suitable for intraday and swing trading. The indicator base on EMA method to calculate Period Parameters It can be used as a standalone tool or together with other indicators.
How to use the prod
FREE

Check out other great products from https://www.mql5.com/en/users/augustinekamatu/seller
This indicator is the best so far at determining the currency strength of each pair. It provides stable values and is highly adaptive to market changes. It is a great tool to add to your arsenal to make sure you are on the right side of the trend at all times. No inputs required, it is simple plug and play. A Winning Trading Strategy This article describes the components and logic needed to develop a tra
FREE

The indicator looks for market Highs and Lows. They are defined by fractals, i.e. the market creates the indicator algorithm and structure, unlike ZigZag having a rigid algorithm that affects the final result. This indicator provides a different view of the price series and detects patterns that are difficult to find on standard charts and timeframes. The indicator does not repaint but works with a small delay. The first fractal level is based on the price, the second fractal level is based on t
FREE
Amazing RSI + ATR Dashboard Indicators are useful for traders, but when you put them into a dashboard and can scan 28 symbols at once they become even better, and when you can also combine different indicators and timeframes to give you synchronized alerts they become awesome. This easy to use dashboard provides you with the RSI and ATR indicators, use them individually or together to create powerful combination alerts. So when you want to know that the ATR is bullish on H1 and the RSI is overso
FREE

An “inside bar” pattern is a two-bar price action trading strategy in which the inside bar is smaller and within the high to low range of the prior bar, i.e. the high is lower than the previous bar’s high, and the low is higher than the previous bar’s low. Its relative position can be at the top, the middle or the bottom of the prior bar.
The prior bar, the bar before the inside bar, is often referred to as the “mother bar”. You will sometimes see an inside bar referred to as an “ib” and its m
FREE
Il s'agit d'un produit gratuit que vous êtes libre d'utiliser pour vos besoins !
J'apprécie également beaucoup vos commentaires positifs ! Merci beaucoup !
// Grands robots et indicateurs de trading sont disponibles ici: https://www.mql5.com/en/users/def1380/seller
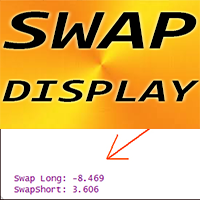
Affichage SWAP de l'indicateur Forex pour MT4, excellent outil de trading auxiliaire.
- L'indicateur SWAP Display affiche les SWAP actuels pour les transactions longues et courtes de la paire de devises à laquelle il est attaché.
FREE

Indicateur de Rupture de Force des Devises (Currency Strength Breakout Indicator)
Obtenez un avantage dans votre trading avec l' Indicateur de Rupture de Force des Devises , un outil puissant qui analyse huit devises sur plusieurs périodes de temps (M1, M5, M15, M30 et H1), le tout dans une fenêtre unique et facile à lire. Identifiez les devises les plus fortes et les plus faibles, et tradez les retracements avec précision grâce à des alertes vous aidant à entrer dans les tendances au bon momen
FREE
The product helps to find the highest peak and the lowest low. Help investors optimize profits. With a win rate of up to 80%. You do not need to adjust any parameters. We have optimized the best product. Your job just need to see and trade. Products with technological breakthroughs. Contact other products: https://www.mql5.com/en/users/hncnguyen/news.
FREE

The indicator helps to determine the potential for price movement within the day and on a trend. For calculations, the average price movement on the instrument is used. If you have a problem setting TP, the indicator allows you not to overestimate your expectations. For volatile instruments, the SL position can also be taken into account. If the entry was in the right place, the risk / reward ratio will prompt a profitable level for profit taking. There is a reset button at the bottom of the sc
FREE

Tester Periods is the useful indicator for visual strategy tester which extend chart periods. Its designed for the trading utility Trade Shell (included Trade Shell SMC ).
Run the Trade Shell on the visual tester. Then put the Tester Periods indicator on the chart. If you wanna see timeframes M1, M5, M10, M15 , for example, then you have to run visual tester on M1 and to define multipliers like that: TimeFrame_Periods_Multiplier = 1,5,10,15 If you wanna see timeframes M5, M20, M30, H1, for
FREE

Indicator Description This is a one-of-a-kind indicator. It predicts future bars using the theory of cyclical behavior of prices and certain market stationarity. This indicator will help you predict 1 or more future bars, thus providing a picture of the possible development of the market situation. It is based on 5 prediction methods. The first method is the Fourier transform, while the other ones are represented by different variations of linear prediction methods. You can select which method w
FREE
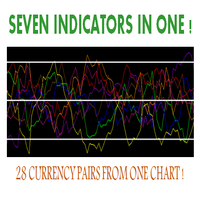
Hello, This indicator is a unique high reliability 7-in-1 multicurrency indicator comprising these sub-indicator’s: A Trend Power Crossover Indicator. A Percent Change Crossover Indicator. A Currency Overbought/Oversold Indicator. A Currency Deviation Indicator. A Currency Impulse Signal Indicator. A Trend Power Indicator. A Currency Volatility Indicator. The main advantage of this indicator is that it's reasoning by currency and not by currency pair. The values of each sub-indicator are calcul
FREE
Le MetaTrader Market est la seule boutique où vous pouvez télécharger un robot de trading de démonstration gratuit pour le tester et l'optimiser à l'aide de données historiques.
Lisez l’aperçu de l'application et les avis d'autres clients, téléchargez-la directement sur votre terminal et testez un robot de trading avant de l'acheter. Seul MetaTrader Market vous permet de tester gratuitement une application.
Vous manquez des opportunités de trading :
- Applications de trading gratuites
- Plus de 8 000 signaux à copier
- Actualités économiques pour explorer les marchés financiers
Inscription
Se connecter
Si vous n'avez pas de compte, veuillez vous inscrire
Autorisez l'utilisation de cookies pour vous connecter au site Web MQL5.com.
Veuillez activer les paramètres nécessaires dans votre navigateur, sinon vous ne pourrez pas vous connecter.