Indicadores técnicos para MetaTrader 4 - 24

The indicator is based on the classic CCI indicator. I recommend watching my advisor - Night Zen EA Doesn't redraw its signals. There are alerts for the incoming signal. It contains 2 strategies: Entry of the CCI line into the overbought zone (for buy trades ) / into the oversold zone (for sell trades ) Exit of the CCI line from the overbought area (for sell trades) / from the oversold area (for buy trades)
Settings: Name Setting Description Period Period of the classic CCI indicator Price C
FREE

Hello. Another free indicator from Sepehr! ;) You can determine the trend with this tool. Using crosses of two Moving averages, you can say that the trend is going to be bullish or bearish; A fast-moving average and a slow one. When the fast-moving crosses up the slow-moving, it's going to be an uptrend and when it crosses down the slow-moving, it means that you are going to have a downtrend. That's easy ;) Hope to enjoy it Sepehr(Faran)
FREE

We Trade Live Trend Candle Stick can help identify potential trend in the market when trading, spot market trends and predict future prices. We Trade Live Trend Candle Stick has a smoother look, as it is essentially taking an average of the movement. candles will stay RED during a downtrend and Green during an uptrend . We believe It's useful for making candlestick charts more readable and trends easier to analyse. As a breakout trader you are looking for trades that are ‘breaking out’ of
FREE
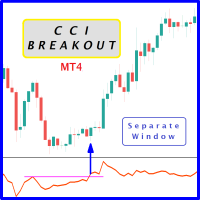
Probability emerges to record higher prices when Commodity Channel Index breaks out oscillator historical resistance level when exhibit overbought values. Since, oscillator breakout of support and resistance have similar effect as price breaks support and resistance levels, therefore, its highly advised to confirm price breakout with oscillator breakout; certainly, will have the same output in short trades. Concept is based on find swing levels which based on number of bars by each side of peak
FREE

The MP Andean Oscillator is used to estimate the direction and also the degree of variations of trends. It contains 3 components: Bull component, Bear component and Signal component. A rising Bull component indicates that the market is up-trending while a rising Bear component indicates the presence of down-trending market. Settings: Oscillator period: Specifies the importance of the trends degree of variations measured by the indicator. Signal line per: Moving average period of the Signal line
FREE

MultiCurrencyWPR (MCWPR) indicator applies conventional WPR formula to plain Forex currencies (that is their pure strengths extracted from Forex pairs), market indices, CFDs and other groups of tickers. It uses built-in instance of CCFpExtraValue to calculate relative strengths of selected tickers. Unlike standard WPR calculated for specific symbol, this indicator provides a global view of selected part of market and explains which instruments demonstrate maximal gain at the moment. It allows yo

El precio promedio ponderado por volumen (VWAP) es un punto de referencia comercial utilizado por los operadores que proporciona el precio promedio al que se ha negociado un valor a lo largo del día, según el volumen y el precio. El VWAP se calcula sumando los dólares negociados para cada transacción (precio multiplicado por el número de acciones negociadas) y luego dividiendo por el total de acciones negociadas. Puedes ver más de mis publicaciones aquí: https://www.mql5.com/en/users/joaquinmet
FREE

Having to check constantly if your RSI has reached a specific level can be tedious and draining at times, especially if you have to monitor different asset classes at a time. The Alert RSI indicator will assist in this task, ensuring that you get the most with little effort. When the RSI values get to a specified level, the alerts will go off, on the chart, on the MT4 phone app or via email (You can receive text messages to your phone if you activate texts on your Gmail account). The indicator d
FREE

This is an unconventional version of the Heiken Ashi Smoothed indicator implemented as lines rather than a histogram. Unlike a usual histogram, the indicator draws the readings of the two moving averages in the form of colored lines.
Example If the candle crosses two indicator lines upwards, a trend is assumed to be changing from bearish to bullish. If the candle crosses two indicator lines downwards, a trend is assumed to be changing from bullish to bearish. The indicator is good at displayin
FREE

This indicator resolves an unrecognised defect in the Commodity Channel Index Oscillator (CCI). The CCI is based on a high pass filter calculated by subtracting the p-period simple moving average of a price signal (usually typical value) from the price signal itself. Then, the result is divided by the absolute mean deviation of the same period. The frequency response of a signal minus its simple moving average is shown in the first screen shot (in Blue). (see my free indicator : Q n D Frequency
FREE

Investment Castle Indicator has the following features: 1. Dictates the direction of the trend in different Timeframes . 2. Shows the hit rate and winning rate on the chart. 3. This indicator does not repaint the chart. 4. This indicator is built-in the Support & Resistance based Investment Castle EA which works with Psychological Key Levels "Support & Resistance" Indicator.
FREE

Fractal Divergence Channel is based on the fractal divergence patterns , representing them in the form of a channel with the borders changing the moment the next pattern appears. The upper border of the channel corresponds to the upper part of the last found bearish fractal divergence pattern. The lower border of the channel is the lower part of the last found bullish pattern (see screenshot 1). Compared to the FractalDivergence_Patterns indicator, the channel version has the same parameters wit
FREE

Defines extremes. This indicator consists of two parts. The first draws lines on the chart indicating low volatility in relative daily market activity. The second is responsible for determining the extremum and gives signals to buy or sell. This system is suitable for all instruments. It is recommended to use a timeframe from m15 to h4. Before using, you need to choose the settings for yourself. Configure lines deviation. Specify volatility coefficient. Advantages The indicator does not repaint
FREE

1. Los pivotes mensuales, semanales y diarios se calculan con los datos iniciales y finales de cada período.
2. Esto proporciona una línea fácil en el gráfico para identificar dónde están los pivotes y reducir el error de cálculo.
3. El indicador ayudará a definir muy rápidamente los pivotes principales del instrumento, incluso si no entiende cómo calcular el pivote.
4. También puede comparar los pivotes semanales y diarios para que pueda comprender mejor la posición del precio.
5 Este i
FREE

Blahtech Moving Average indicator is a multitimeframe version of the standard Moving Average indicator. It is also enhanced with customisable alerts, period breaks and other configuration options. The 50 day and 200 day moving averages are widely followed by investors and traders, with breaks above and below the MA lines considered to be signals of interest. Links [ Install | Update | Training | All Products ]
Feature Highlights Up to three timeframes Configurable calculation variab
FREE
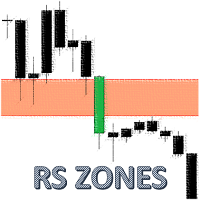
The indicator uses a mechanical approach to identify resistance/support zones and assess their levels of strength showing which price zones are more important than others. Resistance and Support are the main leading indicators used by most traders around the world. To be a successful trader, every trader needs to master the proper detection of price zones. This indicator was created to avoid subjectivity rules when drawing support/resistance zones. Most of the time, resistance and support are no

MACD divergence Simple edition 原始MACD计算方式,升级为双线MACD,使判断更加直观更加贴合大宗交易平台的研究习惯,同时还会自动用实线标出背离,不用再从0开始苦学钻研。
同时,我还提供了提醒服务,在你忙于家务无暇顾及的时候只需要打开音响,一旦达成背离,第一时间就会让你知晓。
这是一款简单版的看背离指标,MACD的九天均线被称为“信号线”,然后绘制在MACD线的顶部,它可以作为买入和卖出信号的触发器。当MACD越过信号线时,交易员可以买入操作,当MACD穿过信号线以下时,交易者可以卖出或做空操作。移动平均收敛-发散(MACD)指标可以用几种方法解释,但更常见的方法是交叉、散度和快速上升/下降。
FREE

Este indicador simplifica el proceso de creación de plantillas de gráficos al permitir guardar la configuración actual del gráfico en una plantilla con sólo pulsar un botón. El indicador añade un botón directamente al gráfico que guarda automáticamente la plantilla con un nombre y un prefijo determinados, lo que facilita la organización y el uso de plantillas.
Las principales funciones del indicador son
Creación de una plantilla del gráfico actual con un solo clic en el botón. Posibilidad d
FREE

He agregado una solicitud muy solicitada de un gráfico de huellas. El indicador es muy básico y muestra los volúmenes de oferta y demanda. No es un indicador de señal, solo mostrará volúmenes en las velas y también mostrará valores pasados. Forex no tiene un volumen centralizado, pero este se divide y muestra el volumen de ticks. La venta de velas mostrará las demandas y la compra de velas mostrará las ofertas. Podría negociarse como un solo sistema de análisis o con otros factores. Puede ser i
Market Reversal Catcher Dashboard indicator looks for market reversal points or major pullback. To do this, it analyzes previous price movements and using a flexible algorithm for estimating the probability of a reversal, also gives recommendations on entry points and sets recommended profit targets for positions opened on a signal. The dashboard is designed to sit on a chart on it's own and work in the background to send you alerts on your chosen pairs and timeframes. Dashboard does not requi

ATR Accelerator Indicator informs you about strong price movements based on the ATR Indicator. This Indicator works for all Timeframes and Symbols, the strength of movements can be configured.
Important: Get informed about new Products, join our MQL Channel: https://www.mql5.com/en/channels/etradro
Useage This Indicator works for all Timeframes and Symbols, the strength of movements can be configured. Features works on all timeframes and forex pairs or indices. Alert and Notify function
FREE

A visual multitimeframe indicator designed for both beginners and professionals. Developed using MACD, CCI and Laguerre and the principle of three screen. This original indicator will help you: accurately enter the market; reduce the number of errors when opeinng orders; visually see market movement; predict price movement(in absent of significant news); do not rush to close profitable trades prematurely and increase profit; do not rush to enter the market and wait for "easy prey". The
FREE
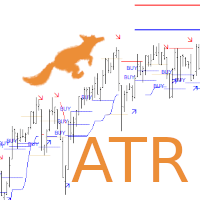
Are you looking for ATR Levels, ATR Trend, ATR Support and Resistance Indicators ? Now you have all in one !!! Info on your chart is showing you: where current price and levels are, what is current trend and signals. Search for an entry with low risk for trading by Lisek ATR Indicator. There are many ways to trade with Lisek ATR Indicator: Trade Support and Resistance Levels. Trade pullbacks (Range trading). Trade breakouts. Trade reversals. Take profit or set stop-loss based on ATR Levels.
FREE

View the institutional support and resistance on every time frame with alerts on and off buttons for each timeframe for instant chart decluttering. Monthly, Weekly, Daily, 4hour, 1hr, 30 min, 15min,5min etc. Ability to change colors each timeframe Solid or Outline Use bottom or top of Order Blocks as stop loss = defined risk
My Trading Story Began in 2013 in the wild west of the crypto market, I’ve spent over $10,000 on trading courses and what I've learned from this experience is that man

TickChartOscillator es un indicador que muestra un gráfico de ticks de un símbolo en la subventana del oscilador.
Ofrece una configuración flexible para su personalización:
- La posibilidad de desactivar la visualización de la línea de precios en el oscilador.
- La posibilidad de especificar un símbolo diferente del que emitir el gráfico de ticks.
Si el parámetro "Símbolo" se deja vacío, el gráfico de tick se mostrará para el símbolo actual en el que está fijado el indicador.
Esta her
FREE

Este indicador nos señala la tendencia o direccion del mercado y un posible stop loss
Está indicador trabaja con dos parámetros, período y multiplicador. Las señales de compra y venta se generan cuando el indicador cruza el precio de cierre y este cambia de color.
Este indicador se usa en todo tipo de mercados como acciones, futuros, forex, criptos, adicionalmente se puede usar en difentes temporalidades horas, diario, semanal etc.
se recomienda no usarlo mientras el mercado este lateral
FREE

"SOLVE ALL YOUR PROBLEMS FOREVER WITH THIS UNIQUE TRADING SYSTEM!" Buy Trend Reversing PRO Indicator And You Will Get Forex Trend Commander Indicator for FREE !
The one who makes money from the forex market, wins by doing something very simple, he wins 6 out of every 10 trades. Of course for this you need a good indicator and proper money management if you ever hope to become a profitable trader. Anyone who doesn't do so ALWAYS ends up empty handed! Because, I'll say it again: "Traders who don

This powerful tool helps you to easily access Fibonacci tools at different times and in different markets. This tool has the ability to send signals based on Fibonacci as well as setting alarms to be aware of broken Fibonacci levels. Among the capabilities of this tool are the following:
Identifies market trends Fibonacci auto design If Fibonacci levels are broken, it sends a message Send Fibonacci signal
Manuals: After selecting the target market, run the tool In the input settings accordi
FREE

Presentamos Auto Trendline, el innovador indicador MT4 que automatiza el proceso de
dibujar líneas de tendencia en sus gráficos. ¡Despídase de la tediosa y lenta tarea de dibujar manualmente líneas de tendencia
y deje que Auto Trendline haga el trabajo por usted!
*Contáctame después de la compra para enviarte instrucciones y guía paso a paso.
Con su algoritmo avanzado, Auto Trendline detecta y dibuja automáticamente líneas de tendencia para usted,
ahorrándole tiempo y esfuerzo. Sim

The indicator helps to determine the potential for price movement within the day and on a trend. For calculations, the average price movement on the instrument is used. If you have a problem setting TP, the indicator allows you not to overestimate your expectations. For volatile instruments, the SL position can also be taken into account. If the entry was in the right place, the risk / reward ratio will prompt a profitable level for profit taking. There is a reset button at the bottom of the sc
FREE

StarBody è un indicatore istogramma che rappresenta la dimensione delle candele in relazione al loro volume ed evidenzia quelle più grandi delle precedenti. La formula per il calcolo dell'altezza dell'istogramma è semplice quanto efficace: Ampiezza * Volume La grafica indicherà tutte le candele più estese delle precedenti in base alle impostazioni scelte.
L'indicatore può essere utile, a volte indispensabile, nelle strategie che prevedono lo sfruttamento della continuazione del trend. Le strat
FREE

How would you like to instantly know what the current trend is? How about the quality of that trend? Finding the trend on a chart can be subjective. The Fractal Trend Finder indicator examines the chart for you and reveals what the current trend is based on objective criteria. Using the Fractal Trend Finder you can easily tell if you are trading with the trend or against it. It also identifies those times when the market is not trending. Theoretically, you could trade with the trend when the tre
FREE

Modificación multidivisa y multitemporal del indicador Commodity Channel Index (CCI). Puede especificar las monedas y plazos que desee en los parámetros. Además, el panel puede enviar notificaciones cuando se cruzan niveles de sobrecompra y sobreventa. Al hacer clic en una celda con un punto, se abrirá este símbolo y punto. Este es el escáner MTF.
La clave para ocultar el panel del gráfico es "D" de forma predeterminada.
Parámetros CCI Period — período promedio. CCI Applied price — tipo

Indicator SR levels true in small time frames is very useful for scalping while in bigger ones it is good for day or position trading.
SR levels true can draw 4 support/resistance levels based on defined maximum rebouds from price level. Indicator scans defined number of bars in time axis and defined number of pips in price axis (both sides - up and down) and calculates how much times price was rejected from scanned price levels. At the price levels where maximum rebounds are counted, support
FREE

MACD is well known indicator that still can be use for prediction where price will go next few minutes, hours or even weekly With colored bar of Macd, your eyes can easily catch when color is changed based what market price movement to find any early trend on market. here is the parameter of the indicator: TF_MACD , default is 1 Hour , this mean you can see clearly MACD of 1 Hour TimeFrame on Lower TimeFrame. InpPrice , default is Price Close , this is original MACD parameter from Metaquotes st
FREE

The recommended timeframe is H1!
The indicator has two kinds of signal.
This is a signal to open a position from the appearance of an arrow. The price leaves the channel In the first case, the indicator builds arrows based on the constructed channel and Bollinger Bands years.
In another case, the trader can trade if the price just went beyond the channel. If the price is higher than the channel - we sell. If the price is lower than the channel, then you can look for a place to buy.
It ca
FREE

Overview Automated smart money market structure identification following smart money concept and inner circle trader concept, it gives an unprecedented edge on your smart money and market structure analysis by automatically identifies valid market structure using smart money concept: Identify impulsive and corrective moves Identify valid pullbacks built by impulsive and corrective market moves Idenitfy bearish or bullish leg and their inducements for smart money concept Identify valid market st

DAYTRADING PARA ACCIONES (CFD's) solamente.
El comercio requiere trabajo. No hay atajos ni indicadores que te indiquen todas las entradas y salidas. El beneficio proviene del estado de ánimo. Los indicadores son herramientas que se utilizan junto con la gestión del dinero y la psicología del éxito. Encuentre desequilibrios en el perfil de volumen. Desequilibrios de volumen de precios comerciales.
Muchos desequilibrios suceden al cierre y apertura y noticias. Vea los compradores frente a los

Después de 7 años he decidido publicar algunos de mis indicadores y EA de forma gratuita.
Si los encuentras útiles, por favor ¡Muestra tu apoyo con una valoración de 5 estrellas! ¡Tu feedback mantiene las herramientas gratuitas llegando! Ve también mis otras herramientas gratuitas aquí
_________________________________ Indicador de Ancho de Bandas de Bollinger para Análisis Avanzado de la Volatilidad del Mercado El Indicador de Ancho de Bandas de Bollinger, meticulosamente desa
FREE
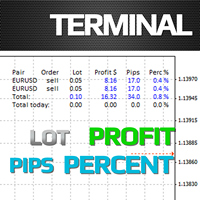
The Terminal indicator is a substitution for the standard Terminal tab. The indicator is displayed as a kind of table consisting of several elements: A row with column descriptions; Open orders; Summary information of open orders; Summary information of current day closed orders. The indicator settings: Graph corner for attachment - the corner of the chart where the table will be positioned Font - font type Fontsize - font size Text color - display settings
Profit color - display settings Loss
FREE
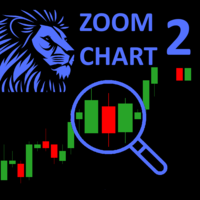
El indicador ZoomChart funciona con dos gráficos: el gráfico actual en el que se ejecuta y el siguiente. El indicador traslada el segundo gráfico al momento en que se encuentra el primero. De este modo, el segundo gráfico muestra la misma situación en el primer gráfico (en el que se ejecuta el indicador), pero en un marco temporal diferente. En otras palabras, este indicador sirve de lupa o, por el contrario, reduce el gráfico para mostrar la situación en un marco temporal mayor.
El indicador
FREE

Indicador de Tamaño de Lote Descubre el tamaño adecuado de lote para utilizar en tus operaciones basado en el margen disponible. Este indicador proporciona información valiosa para la gestión del riesgo. Si el indicador muestra un valor de 0, significa que tu saldo o margen disponible es insuficiente para operar. Es importante mantener niveles de margen adecuados para prácticas de trading seguras. Este indicador está diseñado exclusivamente para la plataforma MT4, una plataforma de trading popul
FREE

The liquidity swings indicator highlights swing areas with existent trading activity. The number of times price revisited a swing area is highlighted by a zone delimiting the swing areas. Additionally, the accumulated volume within swing areas is highlighted by labels on the chart. An option to filter out swing areas with volume/counts not reaching a user-set threshold is also included.
This indicator by its very nature is not real-time and is meant for descriptive analysis alongside other c

The Hull Moving Average (HMA), developed by Alan Hull from 2005, one of the most fast-moving Average, reduce lag and easy to use to identify Trend for both Short & Long term. This Indicator is built based on exact formula of Hull Moving Average with 3 phases of calculation: Calculate Weighted Moving Average (WMA_01) with period n/2 & (WMA_02) with period n Calculate RAW-HMA: RAW-HMA = 2 * WMA_01(n/2) - WMA_02(n)
Weighted Moving Average with period sqrt(n) of RAW HMA HMA = WMA (RAW-HMA, sqrt(n
FREE

The ' Average Bar Chart ' indicator was created to showcase the traditional Heiken Ashi calculation as an exotic charting style. This indicator is known for reducing chart noise for a smoother price action. A dditional indicators are recommended
Key Features Candlesticks for OHLC are removed from the chart. Average bars may be shown as complete bars without tails. All functionality and features of this exotic chart are inputs.
Input Parameters Chart Timeframe = PERIOD_CURRENT; - period to s
FREE

Indicator Description If you need to know future volatility for trading, this indicator is what you need! With the Predictor of the ATR you trading system will be more perfect. This indicator predicts future volatility, and does it quite well. Prediction accuracy is up to 95% at a distance of up to 5 bars into the future (on the period H1). The average forecast accuracy is about 85%, the number of predicted bars is limited by your imagination only. There are five methods used for prediction. The
FREE

The principle of this indicator is very simple: detecting the candlestick pattern in M5 timeframe, then monitoring the return point of graph by using the pullback of High-Low of M5 Candlestick and finally predicting BUY and SELL signal with arrows, alerts and notifications. The parameters are fixed and automatically calculated on each time frame. Example:
If you install indicator on XAUUSD, timeframe M5: the indicator will detect the reversal, pullback, price action on this timeframe (for exa
FREE
Introducing Sterling Blaster V1.0: Specifically engineered for the unique nature of GBPUSD, delivering a remarkable around 99% success rate and an excellent way to achieve prop firm challenges. USE 5MIN TIMEFRAME Sterling Blaster Features: Optimal for GBPUSD : Tailored to deliver outstanding performance on GBPUSD. Exceptional Success Rate : Achieves a remarkable around 99% success rate based on extensive backtesting. Thoroughly Backtested : Verified through years of historical data. Risk Managem
FREE

The FxSProMT indicator shows the current market trend and trend change.
Indicator Parameters Ind_Period - the number of previous bars used to calculate actual values. Number_Bars - the number of bars to display the indicator.. Too many bars may significantly slow down the operation of the trading terminal. Signal_Sound - sound alert to notify of trend change. The sound can be played multiple times until the signal is confirmed (the bar closes). Default is disabled. Signal_Alert - an alert to n
FREE

Trend is Friends is an line Indicator used as an assistant tool for your trading strategy. The indicator analyzes the standard deviation of bar close for a given period and generates a buy or sell trend if the deviation increases. It good to combo with Martingale EA to follow Trend and Sellect Buy Only/Sell Only for EA work Semi-Automatic. You can use this Indicator with any EAs in my Products.
FREE

Herramienta para la información de velas. Permite mostrar al usuario información relacionada con la vela cuando pasa el mouse por encima de ella. Dispone de una sencilla interfaz. El usuario puede modificar su estilo cambiando los colores en los parámetros de entrada.
Muestra datos como: Fecha y hora de la vela Apertura Cierre Precio mas alto Precio mas bajo Volumen
FREE

The implementation of the impulse system described by Dr. Alexander Elder. The indicator colors the bars according to the following pattern: Moving average and MACD histogram increase - green bar, it is forbidden to sell; Moving average and MACD histogram have different directions - blue bar, the ban is removed; Moving average and MACD histogram decrease - red bar, it is forbidden to buy.
Indicator Parameters EMA - period of the indicator's moving average MACD Fast - period of the fast moving
FREE
Este indicador está diseñado para la creación cómoda y rápida de capturas de pantalla de gráficos en el terminal de negociación. Simplifica enormemente el proceso de guardar gráficos en un directorio determinado, proporcionando una interfaz cómoda con un botón en el gráfico, que se activa con un solo clic.
Las principales funciones del indicador son
Creación automática de una captura de pantalla del gráfico cuando se pulsa el botón. Posibilidad de seleccionar un directorio para guardar las
FREE

The M.O.D.E stands for " Multiple Oscillator Divergence Exit ". It is an indicator which signals a divergence between the price, and multiple oscillators. It is initially an exit indicator because it signals the weakening of a trend, but it could be used as an entry signal if used analytically Key Features: Check many divergences at once Non repainting Sends Alerts and Push Notifications You could load the M.O.D.E onto a single chart, and be able to see the divergences happening on multiple os
FREE

Индикатор рисует уровни Фибоначчи с выделенными Ценовыми метками.При установке индикатора на график необходимо создать трендовую линию с именем указанным в поле" Unique name of trend line to place fib on ". По умолчанию имя=" Unique name of trend line to place fib on" = "+" .В индикаторе можно заменить уровни фибоначчи по своему усмотрению.Также меняются цвет,стиль,толщина линий и т. д.
FREE

Macd Predictor Macd's main chart indicator If you like this indicator , Dinapoli Levels Expansion and Retracement Demo is a helpful tool: https://www.mql5.com/en/market/product/35884
1. You can determine the price at which the MACD will change from buy to sell, and vice versa. It is the cousin of the oscillator predictor. If you know a position at the time, then the exact price, current and next (future) columns will need to reach the MACD crossover. You can also see how far the market has t
FREE
Introduction and Description The commodity channel index (CCI) is an oscillator originally introduced by Donald Lambert in 1980. Since its introduction, the indicator has grown in popularity and is now a very common tool for traders in identifying cyclical trends not only in commodities but also equities and currencies. The CCI can be adjusted to the timeframe of the market traded on by changing the averaging period. CCI indicator with different colors at levels 0, 100 and -100. The cross is a
FREE

The indicator allows you to trade binary options. The recommended time frame is М1 and the expiration time is 1 minute. The indicator suitable for auto and manual trading. A possible signal is specified as a arrows above/under a candle. You should wait until the candle closes! Arrows are not re-painted Trade sessions: TOKYO section (Half end) and LONDON section (First half) Currency pairs: EUR/USD Working time frame: M1 Expiration time: 1 minute. The indicator also shows good results when using
FREE
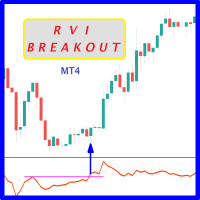
Probability emerges to record higher prices when RVi breaks out oscillator historical resistance level. It's strongly encouraged to confirm price breakout with oscillator breakout since they have comparable effects to price breaking support and resistance levels; surely, short trades will have the same perception. As advantage, a lot of times oscillator breakout precedes price breakout as early alert to upcoming event as illustrated by 6th screenshot. Furthermore; divergence is confirmed in case
FREE

The XR Gartley Pattern MT4 is an indicator which displays and alerts Gartley pattern detected on the candlestick chart. It also displays potential trade with calculated Take Profit and Stop Loss, Timeframe H1. After purchasing XR Gartley Pattern, you can immediately download this indicator from the MT4-MT5 Market and start using it because all features are set to default, is not necessary to change any parameter. In addition, we have created a private group for customers who have purchased one
FREE

The YK-LOT-SIZE is an indicator that displays the total Lot Size and profit/loss of all trade orders for the current symbol on the price chart. It has the following features: Shows the total Lot Size of buy orders (BUY) and sell orders (SELL) on separate lines. Displays the profit/loss of buy orders (BUY) and sell orders (SELL) by calculating the sum of profit, commission, and swap. Users can customize the color of the displayed text through the input parameter. The information is displayed at t
FREE

The intention of the dashboard is to provide a quick overview of the daily, weekly and monthly range of configured assets. In "single asset mode" the dashboard shows you possible reversal points directly in the chart, thus making statistics directly tradable. If a configured threshold is exceeded, the dashboard can send a screen alert, a notification (to the mobile MT4) or an email. There are various ways of using this information. One approach is that an asset that has completed nearly 100% of
Highly configurable Accumulation and Distribution (AD) indicator. Features: Highly customizable alert functions (at levels, crosses, direction changes via email, push, sound, popup) Multi timeframe ability Color customization (at levels, crosses, direction changes) Linear interpolation and histogram mode options Works on strategy tester in multi timeframe mode (at weekend without ticks also) Adjustable Levels Parameters:
Ad Timeframe: You can set the lower/higher timeframes for Ad. Ad Bar Shi
FREE

v. 1.0 This indicator can show with maximum accuracy up to 1 bar the presence of a Maximum/minimum on the chart, regardless of the timeframe. It has a flexible configuration. You can use either one value on all TF, or you can use your own value on each TF individually.
This indicator is already being improved and those who purchase it receive all updates for free.
Next, it is planned to display an indication of the strength of the pivot point at each extremum (in % or in color drawing). It
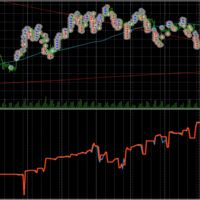
Graph shows your balance and equity in real time similar to the tester graph which is nice to see your real progress vs tester graph. This code was copied from mql5.com, it was free and it works im just putting it here to make it easier for us :-) https://www.mql5.com/en/code/13242
https://www.mql5.com/en/code/8454 .. original code
//+------------------------------------------------------------------+
//| Equity Monitor |
//| Monitori
FREE

This strategy is best used for Scalping and Binary Options. Strategy: There are 3 EMAs: Faster, Medium and Slower. When Price is Trending, wait for Price to bounce an EMA and scalp at each bounce. Features: - Check if 3 MAs are Stacked - Check Price Bounce Off MAs (Faster, Medium, Slower) - Min Distance Between Faster and Medium MA Filter - Max Distance Between Entry Price and Faster MA Filter - High Volume Check - Heiken Trend Check - Volatility Check - Higher/Lower Timeframes MA Stacked check
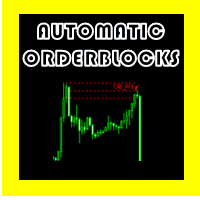
AUTOMATICS ORDERBLOCKS OSW (METATRADER 5) Este indicador se encarga de mostrar los Order Blocks bajo algunas reglas preestablecidas, entre las cuales se encuentran: >que exista un impulso que rompe el impulso anterior. >cuando es encontrado, se encarga de encontrar el patrón de velas formado, para calcular de la manera mas eficiente el alto y le bajo del lugar, para crear el alto y bajo del Order Block. >Despues de creado el Order Block, el Indicador esta revisando constantemente si alguna vela

El robot Choppines, se lo carga como indicador en la carpeta de indicadores del MT4 Se recomienda utilizar una temporalidad de velas de 5 minutos, el tiempo de expiración del robot recomendado es de 5 minutos.
El robot puede configurarse para enviar señales a las plataformas MT2, MX2, PRICEPRO. Para realizar el envio de señales se debe utilizar el programa conector de la plataforma que queremos trabajar. Para instalar en el conector realice el siguiente procedimiento (se adjunta una imagen don

Un indicador de flecha que no se vuelve a pintar para ayudar con las entradas Se dan mejores señales en los mercados en tendencia Espere a que la barra actual se cierre para bloquear la flecha en su lugar Simplemente cárguelo en el gráfico sin configuraciones que puedan confundir El color y el tamaño de la flecha se pueden ajustar. El indicador se puede utilizar con cualquier par o período de tiempo: Forex, cripto... Es mejor operar con la tendencia de marco temporal más amplio -----------------
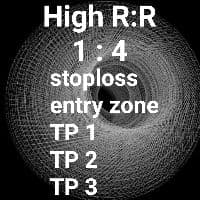
Fibonacci Breakout es una estrategia comercial que utiliza el retroceso de Fibonacci. Esta técnica es en realidad una técnica que nos permite entrar en el comienzo de la tendencia. Es muy fácil de entender incluso para principiantes. La estrategia es que solo tiene que esperar a que aparezca el fibonacci personalizado automático y luego colocar manualmente su orden pendiente, detener las pérdidas y tomar ganancias al nivel de Fibonacci. La posición se abrirá cuando el precio haga una nueva prue
El Mercado MetaTrader es una plataforma única y sin análogos en la venta de robots e indicadores técnicos para traders.
Las instrucciones de usuario MQL5.community le darán información sobre otras posibilidades que están al alcance de los traders sólo en nuestro caso: como la copia de señales comerciales, el encargo de programas para freelance, cuentas y cálculos automáticos a través del sistema de pago, el alquiler de la potencia de cálculo de la MQL5 Cloud Network.
Está perdiendo oportunidades comerciales:
- Aplicaciones de trading gratuitas
- 8 000+ señales para copiar
- Noticias económicas para analizar los mercados financieros
Registro
Entrada
Si no tiene cuenta de usuario, regístrese
Para iniciar sesión y usar el sitio web MQL5.com es necesario permitir el uso de Сookies.
Por favor, active este ajuste en su navegador, de lo contrario, no podrá iniciar sesión.