
Testing Visualization: Functionality Enhancement
1. Motivation
Starting from build 196, MetaTrader 4 Client Terminal offers testing visualization function. It allows controlling the Expert Advisors' testing on a brand new level. Now, the trading programmer can watch every action of his or her Expert Advisor checking its operation on history!
You can read about how to use the visualizer in the article named Testing of Expert Advisors in the MetaTrader 4 Client Terminal: An Outward Glance. Our article describes how to make the strategy tester highly similar to the terminal.
So, what is the main specific of he tester? What lacks in visualization? The most important lack is perhaps the lack of "Trade" tab.
How many positions were opened? How soon will the pending order trigger? Has the StopLoss of the position moved? How much is the margin at the moment and how long is it to go to the MarginCall level? We find answers to these and many other questions in the "Trade" tab of the Terminal. But what can we do when testing?
This present article is devoted to solution of this problem.
2. Technical Aspects
We will start coding with problem definition, as usual. What result do we want to obtain?
- As said before, we need realization of something analoguous to "Trade" tab, i.e., to visualize information about all open positions and pending orders.
- Information must always be updated and be well readable.
- The program must be highly easy to use - its conection to the Expert Advisor may not need many efforts.
Now we can discuss technical aspects. How will the program be formed: as an indicator or as an external function library?
It is obvious that indicator in a separate window could be the best solution. It is always visible, does not hatch the price chart and is updated on every tick. But we then face a new problem when using the indicator - it takes all data about orders from the normal terminal, not from the 'virtual' (test) terminal, i.e., while testing, it will show information about the current state of the account without any reaction to the testing itself.
So we will have to find an alternative, a kind of a back way, to solve our problem.
We will still create an indicator, but it will only fulfil the function of a "chart subwindow creator". It will not show anything, i.e., we will always have a 'reserved' part of the chart. This is necessary so that the created subwindow could be saved under a unique name in template tester.tpl or in template <expert_name>.tpl.
Showing and updating of information will be assigned to a function library formed an included file.
3. Putting in Use
First of all, a chart template must be created that will use the visualizer. Just adjust the chart (colors, grid, scale), attach vTerminal.mq4 to the chart and use the "Save Template" command:
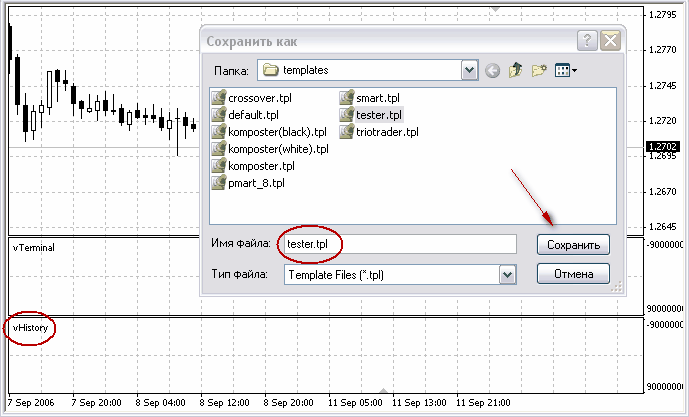

For visualization purposes, the template named tester.tpl or <expert_name>.tpl will be used. It is this name that must be used to save the template.
4. Integration with the Expert Advisor
Functions that show information about positions are saved in the included file named VisualTestingTools.mq4, which is in the ...\MetaTrader 4\experts\include\ directory. First of all, it must be attached to the Expert Advisor - insert #include <VisualTestingTools.mq4> line before the start function. It will then appear as follows (example of CrossMACD_DeLuxe):
...
double _Commission = 0.0; string _Comment = ""; datetime _Expiration = -1;

#include <VisualTestingTools.mq4>

int start()
  {
    if ( FastEMAPeriod >= SlowEMAPeriod )
      {
        return(-1);
      }


    int _GetLastError = 0;
...
Now we can use the functions in any part of the program. Call for one of them - vTerminalInit() - will be placed in the Expert Advisor's init() function since it must be called only once for its task is to create objects to show information. Another one - vTerminalRefresh() - must be called at every tick. It will update information about open positions. Code of the EA that uses the functions will look like this:
...
double _Commission = 0.0; string _Comment = ""; datetime _Expiration = -1;

#include <VisualTestingTools.mq4>

int init()
  {
    if ( FastEMAPeriod >= SlowEMAPeriod )
      {
        return(-1);
      }
    vTerminalInit();
    return(0);
  }

int start()
  {
    if ( FastEMAPeriod >= SlowEMAPeriod )
      {
        return(-1);
      }
    vTerminalRefresh();

    int _GetLastError = 0;
...
You can download Expert Advisor CrossMACD_DeLuxe_Visual.mq4 where all necessary changes have already been made.
5. Testing
Now let us look what we have got.
First, new external variables have been added in the Expert Advisor:
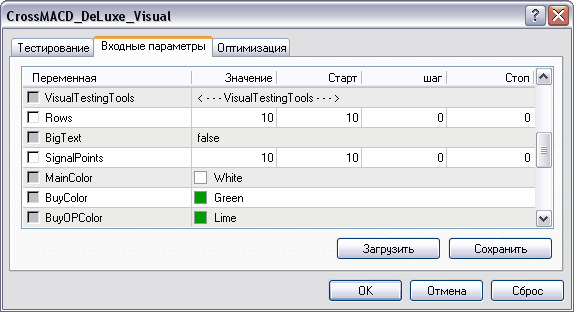
Their destination is intuitive, but I would like to give more details about them:
- Rows - the maximum amount of lines shown in the display. For the most strategies, 10 lines will be enough;
- BigText - set true if you want to enlarge the fonts;
- SignalPoints - distance in points, starting from which fields Stop Loss, Take Profit and Open Price for pending orders will be highlighted. For example, if SignalPoints = 10, then the Stop Loss field will change its color when the price is 10 points from the Stop Loss of the position;
- MainColor - color of the terminal heading and of the bar informing about the account (Balance, Equity, ...).
- BuyColor - color of Buy-position information;
- BuyOPColor - color of the Open Price field, which will replace the main color when the current price appcoraches to the Open level of Buy Stop and Buy Limit ;
- BuySLColor - color, which will replace the main color when the price approaches to the Stop Loss level of Buy positions;
- BuyTPColor - color, which will replace the main color when the price approaches to the Take Profit level of Buy positions.
- SellOPColor, SellSLColor and SellTPColor - the same for Sell positions.
Let us set MainColor = Black and press OK. The Expert is now ready for testing. Before pressing the Start button, check "Visualization" and enjoy the results:
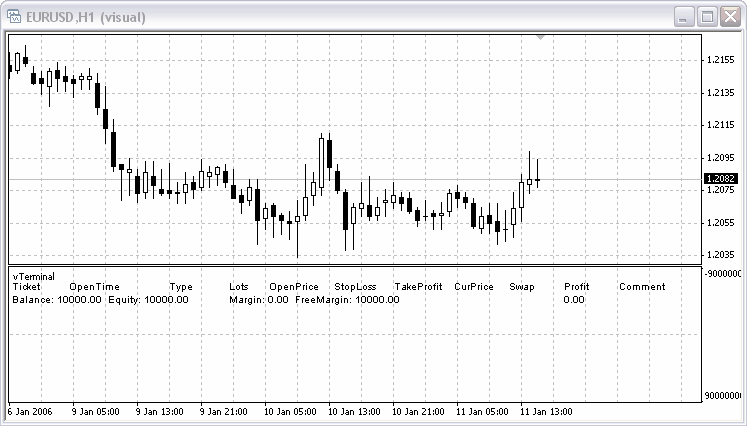
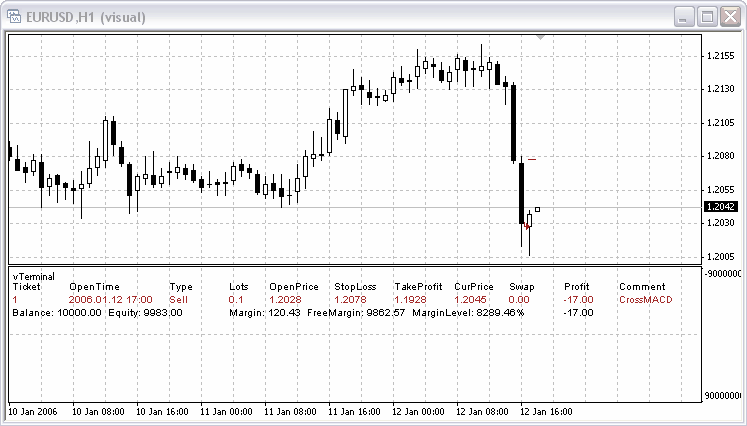
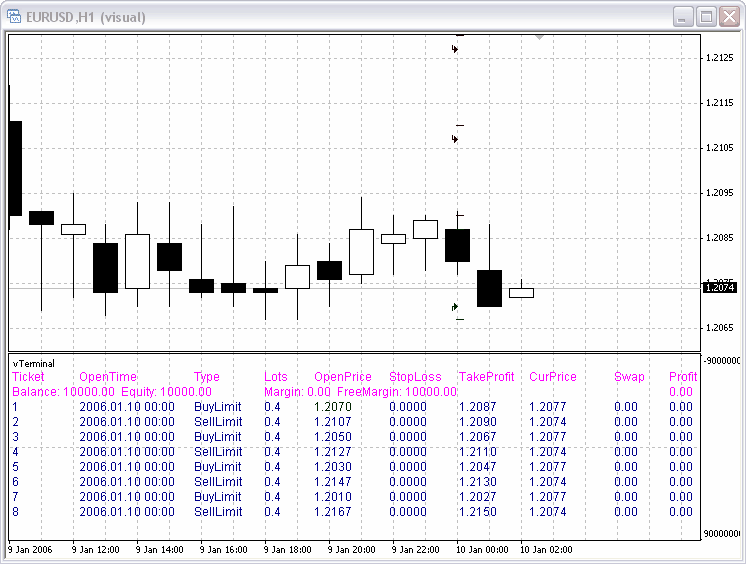
Until there are no open positions, our "terminal" shows only heading and the account status bar. Let us wait until a signal appears and the Expert opens a position.
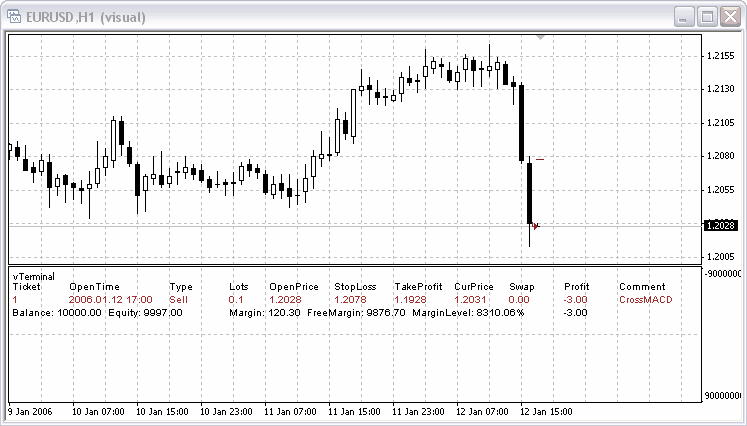
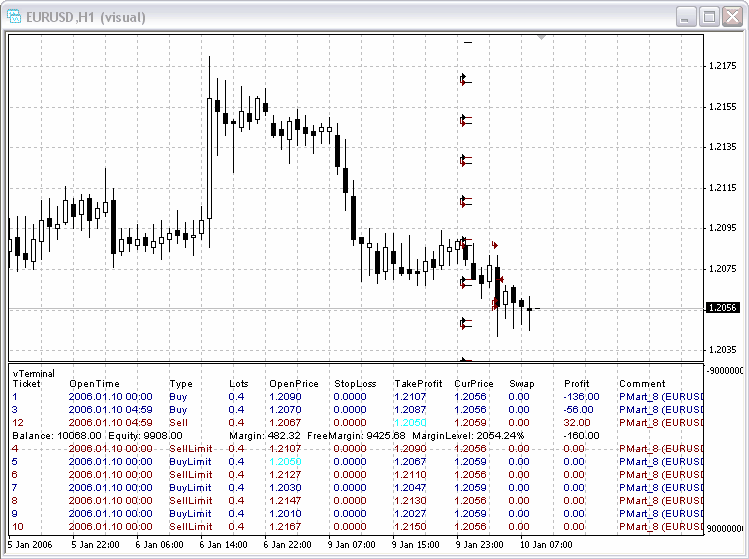
A Sell position is opened as the first one. As you can see, the line is red.
Please direct your attention to the account status bar. It contains everything we get used to see in the "Trade" tab of the terminal. The entire information is updated every tick, so you can see how the position's profit changes:
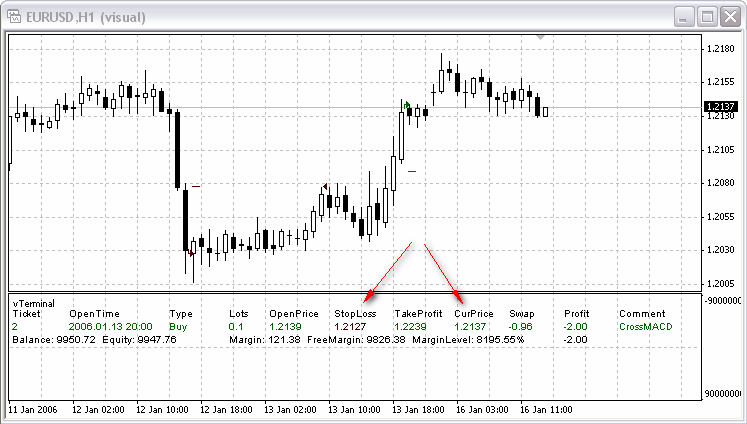
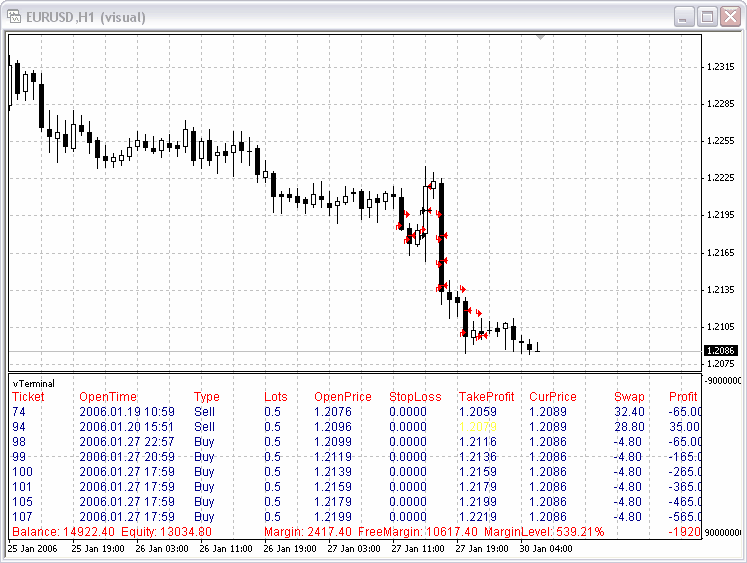
When price approaches to the Stop Loss level of the position, the StopLoss field changes its color to that preset by user:
6. Possible Problems
One more feature of using the tester.tpl with indicator vTerminal should be mentioned: During testing, the function that must find the indicator's window (WindowFind()) is unabled. This is why, the subwindow number is explicitly set in the code:
    win = WindowFind( "vTerminal" );
    if ( IsTesting() ) { win = 1; }
If the template contains other indicators to be drawn in a separate window, the entire information about them will be shown in the upper window. I.e., you have either to place vTerminal on the top or write win = subwindow number; instead of win = 1; .
No other problems were found when working with the indicator.
7. Conclusion
To draw a beautiful conclusion, I would like just to show some screenshots.
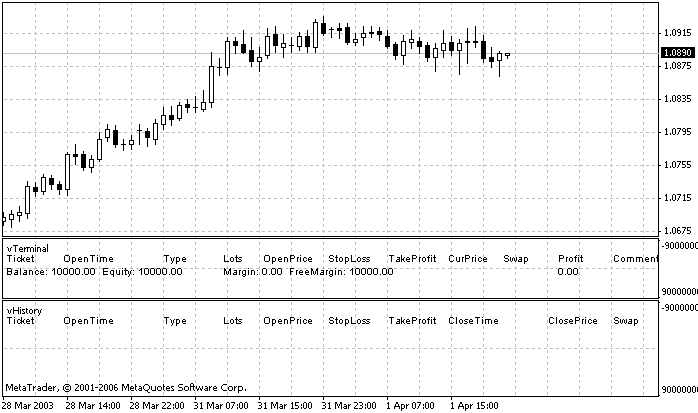
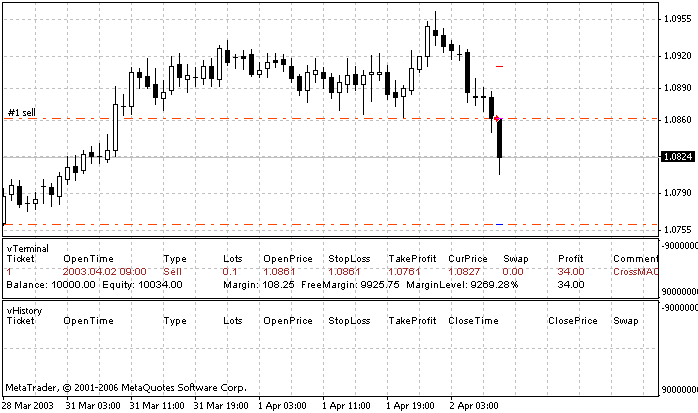
Translated from Russian by MetaQuotes Ltd.
Original article: https://www.mql5.com/ru/articles/1420
 Testing Visualization: Manual Trading
 Testing Visualization: Trade History
 What Is a Martingale?
 Beginners' Mistakes when Working with MetaTrader 4 Client Terminal
- Free trading apps
- Over 8,000 signals for copying
- Economic news for exploring financial markets
You agree to website policy and terms of use
good work but I get this error, please help:
2008.02.09 12:10:12 2008.02.07 23:59 CrossMACD_DeLuxe_Visual EURGBP.,H4: ObjectSetText( "Comment_49", "", 8"Arial", 0 ) - Error #4202
Thanks
Iinself