Nuevos indicadores técnicos para MetaTrader 5 - 33

Introducing the Ultimate Custom Time Range Indicator: Unlock Precision in Your Trading Strategies! Versatile Applications: Ideal for kill zones, trading sessions, and time macro analysis, silver bullet timings. You can have as many time ranges as you need to help identify the highest to lowest range within the specified start to end broker time. Note: most brokers operate in GMT +3 - so please convert and use your own broker time.
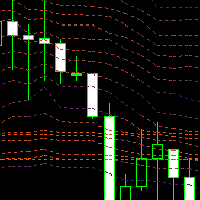
Market Profile, Volume Profile? Extra paid in TradingView, displayed for the last moment in time or discreetly, e.g. after 24 hours. Counting super-accurate values from a histogram...?
None of these ways suited me. I was looking for an expression of the dynamics of the market, its liquidity, I just wanted to clearly see where the money was flowing. I thought I would calculate the volume weighted price percentiles for a certain period.
To make the calculation more accurate, I calculate from a low
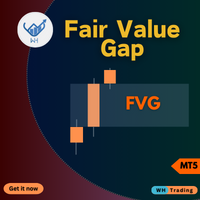
Experimente el comercio como nunca antes con nuestro incomparable indicador MT5 Fair Value Gap (FVG)
aclamado como el mejor de su clase. Este indicador de mercado MQL5 va más allá de lo común,
proporcionando a los operadores un nivel inigualable de precisión y conocimiento de la dinámica del mercado. EA Version: WH Fair Value Gap EA MT5
SMC Based Indicator : WH SMC Indicator MT5
Características:
Análisis de brechas de valor razonable, el mejor de su clase. Personalización. Alertas en tiem
FREE

IX Power: Descubre perspectivas de mercado para índices, materias primas, criptomonedas y forex Descripción general
IX Power es una herramienta versátil diseñada para analizar la fortaleza de índices, materias primas, criptomonedas y símbolos de forex. Mientras que FX Power ofrece la máxima precisión para pares de divisas mediante el uso de datos de todos los pares disponibles, IX Power se centra exclusivamente en los datos del mercado del símbolo subyacente. Esto convierte a IX Power en una e

El comportamiento de los diferentes pares de divisas está interconectado. El indicador Visual Correlation le permite mostrar diferentes instrumentos en 1 gráfico mientras mantiene la escala. Puede definir correlación positiva, negativa o sin correlación.
Algunos instrumentos comienzan a moverse antes que otros. Dichos momentos se pueden determinar superponiendo gráficos.
Para mostrar un instrumento en un gráfico, ingrese su nombre en el campo Symbol .
Version for MT4 https://www.mql5.
FREE

El indicador muestra los niveles máximo y mínimo del día, semana y mes anterior. Diseñado para determinar la ruptura de puntos extremos y determinar la dirección de entrada al comercio. Para determinar con mayor precisión los niveles de inversión, puede mostrar los niveles de Fibonacci. También es posible cubrir el espacio entre Alto y Bajo para mostrar más claramente los movimientos de precios del período de facturación anterior. Hay una indicación del tiempo hasta que se cierra la vela (barra

Este indicador rastrea eficientemente cualquier otra vela temporal que desee rastrear en el mismo gráfico.
1. Seleccione cualquier período de tiempo superior para cargar barras en el mismo gráfico.
2. Personaliza los colores y el estilo de los candelabros.
3. Elige el número de barras para dibujar velas.
4. Realice un seguimiento de las velas completas con períodos de tiempo más altos junto con la mecha y el cuerpo.
5. Fácil y conveniente para aquellos que no quieren cambiar de gráfico.

About testing Mode: You should download the version for MT4 to test instead. https://www.mql5.com/en/market/product/109093?source=Site+Market+My+Products+Page#description
1. Compound Drawings (1) Line segment with arrow (2) Continuous line segment (broken line) (3) Parallelogram (4) Polygon (5) Profit and loss ratio measurement tools
2. Backtracking By the Z key in the process of drawing the line Line types that support Z-key backtracking: continuous line segments (broken line) ,

Scalping and Binary Signal Detector : indicador de especulación que proporciona señales direccionales para abrir posiciones a lo largo de la tendencia.
El indicador es un sistema comercial completo que se puede utilizar para Forex y opciones binarias.
El sistema de algoritmos permite reconocer movimientos intensos de precios en varias barras consecutivas.
El indicador proporciona varios tipos de alertas para las flechas.
Funciona en cualquier instrumento comercial y marco de tiempo (se recomiend

Contact me after payment to send you the user manual PDF file. Download the MT4 version here. Unlocking Trading Insights Dive into the heart of market dynamics with Advance Divergence Scanner designed for traders seeking a competitive edge. The Divergence Indicator is your key to identifying crucial divergences across various charts, empowering you to make informed decisions in the dynamic world of financial markets. The Divergence A Divergence signals a potential reversal point because directi

Exclusive Arrival: Presenting for the First Time . This is your secret weapon for predicting which way the wind will blow with the next market shift. It assists you in developing your trading strategy by predicting the direction of the next candle. Compatible with forex, stocks, and cryptocurrencies on all timeframes, but higher timeframes are recommended. MT4 Version - https://www.mql5.com/en/market/product/108931/ How does it work ? It's pretty neat. The algorithm separates green and red ca

Fair Value Gaps (FVG) and Liquidity Voids are price ranges you can exploit for better entries and exits on your trades. They're similar concepts, so let's look at them from the top and break it down. Think of FVG and Liquidity voids as soft-spots in the market. They are paths of least resistance. That doesn't mean price will go through them, but price could go through them more easily.
To find and locate it is easy but tidiest to repeat the same thing all over again. This helps to boost your t
FREE

RS Zone is an Indicator used to plot the support and resistance levels of each asset. and each time period as we determine The principle for calculating support and resistance levels is based on the price range (Range SR) to see if there are points where the price repeatedly reverses at that price level or not. The total pot will be equal to the Total SR that we set. Example If Range SR is equal to 120, the system will choose to look at data going back 120 candlesticks to find whether there is a
FREE

This is an OLD indicator which was rather efficient to be paired with MA Cross, Bollinger Bands, Dochian Channel and many other strategies and this provides you with market change of BEAR and BULL trends. Since there isn't much listed in MT5 Market, I would like to share my very own indicator for your usage. Please feel free to comment or criticize for better and improvement of the indicator listed.
FREE

Monte Carlo simulation is an Indicator that uses a Monte Carlo model to calculate the probability of the price going up or down. If the price has a probability of going up or down more than 90%, the system will enter a trade by doing a back test of gold assets. It was found that it was able to generate a return of more than 20% in a period of 5 months while having a MAX DD of less than 7%.
What is a Monte Carlo simulation?
A Monte Carlo simulation is a model used to predict the probability of
FREE
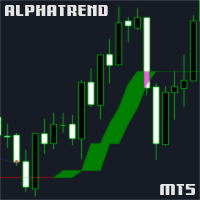
Overview: The AlphaTrend Indicator is a custom technical analysis tool designed for the MetaTrader 5 (MT5) trading platform. This indicator uniquely combines the Average True Range (ATR) and the Money Flow Index (MFI) to offer traders a novel approach to trend analysis and potential reversal points in the market. Key Features: ATR-Based Trend Analysis: Utilizes the Average True Range (ATR) to assess market volatility, aiding in identifying potential trend reversals. MFI Integration: Incorporates
FREE

Description by chatGPT:
In the dance of flames, a candle transforms,
From the close of old, a new light is born.
A derivative of candles, changing forms,
Unveiling secrets in the flickering morn.
Like indicators, patterns do precede,
On charts of price, where future paths are sown.
The candle's dance, a signal to take heed,
Foretelling tales in fiery lines shown.
I trust the candlemakers to discern,
Using indicators as their guiding light.
In every flame, a lesson to be learned,
In every shift
FREE

Wolf Countdown helps you not to waste the right amount of time, it gives you back the time remaining until the candle closes.
How to use: Download and install the Wolf Countdown Indicator on your MetaTrader 5. Apply the indicator to your favorite chart.
this works on any timeframe...
Thanks to this indicator you will never miss the right moment to enter your trades.
FREE

Note: This indicator is for sub-window use and not for the main chart. If you need to apply it for the indicators in the main chart, then use this indicator instead: https://www.mql5.com/en/market/product/108876 AIntel Predict - Your Gateway to Future Trading Success! Unlock the power of predictive analytics with AIntel Predict. Say goodbye to the guesswork and hello to improved forecasting, as AIntel Predict leverages historical data to unveil the future of your trades like never before. Whe

Consolidation is when price is moving inside a clear trading range. When prices are consolidated it shows the market maker placing orders on both sides of the market. This is mainly due to manipulate the un informed money. This indicator automatically identifies consolidation zones and plots them on the chart. The method of determining consolidation zones is based on pivot points and ATR, ensuring precise identification. The indicator also sends alert notifications to users when a new consolida

The Hurst Exponent gauges a time series' long-term memory and is named after Harold Edwin Hurst. The MetaTrader's Hurst Exponent Indicator analyzes an asset's price memory, helping predict future trends. It's valuable for traders of all levels, suitable for various styles like scalping or swing trading.
In Forex terms, the Hurst Exponent measures a series' dependence, indicating whether it regresses to the mean or clusters in a direction. H values between 0.5-1 suggest positive autocorrelation

MT5 RSI Experiment: This indicator leverages the Relative Strength Index (RSI) and floating levels to pinpoint potential buy and sell signals.
The code uses enums for prices and RSI calculation methods. These enums define indicator parameters.
Input variables include RSI period, price type for RSI calculation, smoothing method, and look-back period with levels for floating levels.
Index buffers store RSI fill, RSI up line, RSI middle line, RSI down line, and trend line data.
For each bar, i
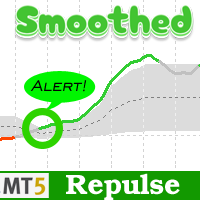
Smoothed Repulse Alert MT5 Indicator
The Smoothed Repulse Alert for MT5 is a powerful tool that visualizes market pressure through a filled area chart and two lines in a separate window. This indicator is based on the repulse indicator, assessing buying and selling pressure using high, low, open, and close prices over a specified period.
Key Features: - Customizable parameters include repulse period, moving average type, moving average multiplier, level period, upper and lower levels. - Color

This indicator builds upon the previously posted Nadaraya-Watson smoothers. Here we have created an envelope indicator based on Kernel Smoothing with integrated alerts from crosses between the price and envelope extremities. Unlike the Nadaraya-Watson estimator, this indicator follows a contrarian methodology.
Please note that by default this indicator can be subject to repainting. Users can use a non-repainting smoothing method available from the settings. The triangle labels are designed so

Elliott Wave Principle, developed by Ralph Nelson Elliott , proposes that the seemingly chaotic behaviour of the different financial markets isn’t actually chaotic. In fact the markets moves in predictable, repetitive cycles or waves and can be measured and forecast using Fibonacci numbers. These waves are a result of influence on investors from outside sources...

The indicator enables very quick orientation in the market phase (re/accumulation, re/distribution, up/down trend). It is counted only
from price data (without volume).
It is based on the assumptions of Wyckoff's law of Causa and Effect. Oscillations are an expression of the level of market uncertainty and point to the presence of Big Money. Such a "storm" is followed by a calmer trend that needs to be exited. You need to use other tools or shorter period of the same indicator for that.
I keep t

Forex traders often observe increased market activity near Supply and Demand zones, which are levels formed based on zones where strong price movements have previously occurred.
The Supply Demand Strong Weak Confirm Indicator utilizes fractals and the ATR indicator to identify and plot support and resistance zones on the price chart. These zones are categorized as follows:
- Weak: significant high and low points in the trend. - Untested: crucial turning points in the price chart that the pric
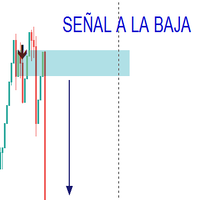
El indicador trabaja con patrones funcionales y divergentes obteniendo del mercado las mejores señales para compra y venta, ha sido testeado por 2 años mediante la estrategias personalizada. El indicador envia la señal para la compra y venta de acuerdo al analisis desarrollado en el mercado. Solo ha sido comprobado en el mercado de indice sintetico (CRASH, BOOM VOLATILITY, STEP)

In the dynamic world of financial markets, staying ahead of the curve is paramount. Traders and investors require sophisticated tools to analyze market trends, make informed decisions, and optimize their strategies. Introducing the Moving Average of Accumulation/Distribution (MAAD) Indicator – a powerful tool designed to provide insightful signals for navigating the complexities of the financial landscape. Key Features: Precision in Trend Analysis: The MAAD Indicator employs a moving average met

Presentamos Koala FVG para MT5: su indicador profesional de patrones Fair Value Gap (FVG). Koala FVG: Su camino hacia una operativa precisa en MT5 Desbloquee el potencial del patrón Fair Value Gap (FVG) con Koala FVG, un indicador de vanguardia diseñado para MetaTrader 5. Por tiempo limitado, acceda a esta herramienta profesional de forma gratuita antes de que se convierta en un indicador premium. Principales características: Detección de patrones FVG: Koala FVG identifica de manera inteligente
FREE

El precio aumentará en $30 después de cada venta de 5 copias. El indicador principal tiene como objetivo determinar la tendencia general del mercado. El sistema de colores, con colores brillantes y oscuros, busca identificar condiciones de mercado fuertes y débiles.
En mi opinión, este indicador es insuperable; funciona excepcionalmente bien cuando el mercado comienza a moverse.
Si prefieres utilizar el indicador en un marco de tiempo más largo, como 1 hora, 4 horas o diario, para obtener mej

El indicador Higher - Lower se basa en la teoría del concepto de dinero inteligente (smc) y es la base del análisis del flujo de pedidos. Se utiliza para el análisis de áreas de entrada y salida. Referencia del indicador: Trading Hub 3.0 Aunque el propio TIC (the Inner Circle trader) no se ha dado ningún nombre a esta estrategia que ha desarrollado, su público, que ha dado muchos nombres a esta estrategia, básicamente se deriva de las palabras que enseña, como las TIC a menudo dicen dinero inte

A simple indicator that automatically highlights all FVGs (Fair Value Gaps) formed on the chart, as well as FVGs on history. It is possible to select colors for FVGs of different directions (long or short), select the time interval, select the color of middle point and you can also choose whether to delete filled FVGs or leave them on the chart (the option is beneficial for backtesting). The indicator can be very useful for those, who trade according to the concept of smart money, ICT, or simply
FREE

With this easy to set up indicator you can display and set alerts for the following candlestick formations: Bull Breakout, Bear Breakout, Hammer, Pin, Bullish Engulfing, Bearish Engulfing. Input parameters: ShortArrowColor: The color of the Arrows, displaying a Bearish candle formation LongArrowColor: The color of the Arrows displaying a Bullish candle formation BullishEngulfing: Disabled/Enabled/EnabledwithAlert BearishEngulfing: Disabled/Enabled/EnabledwithAlert Pin: Disabled/Enabled/Enabledw
FREE

BUY INDICATOR AND GET EA FOR FREE AS A BONUS + SOME OTHER GIFTS! ITALO TRIANGLE INDICATOR is the best triangle indicator ever created, and why is that? Using Geometry and Fibonacci the Indicator works on all time-frames and assets, indicator built after 7 years of experience on forex and many other markets. You know many triangle indicators around the internet are not complete, does not help, and it's difficult to trade, but the Italo Triangle Indicator is different , the Italo Triangle Indi

简介: 六彩神龙指标【MCD Hot Money】进是一种常用的技术指标,被广泛应用于股票交易中。它由六人不同的指标组成,包括均线、相对强弱指标井、移动平均收盘线等。这人指标可以有效地帮助投资者确定股票的买入和卖出时机。 六彩神龙用来看筹码了解庄家动向。看个股买卖少踩炕,少被套;跟庄吃肉,用于判断个股趋势!
指标设置 : hot_money_sensitivity = 0.7; // Hot Money Sensitivity hot_money_period = 40; // Hot Money Period hot_money_base = 30; // Hot Money Base banker_sensitivity = 1.5; // Banker Sensitivity banker_period = 50; // Banker Period banker_base = 50;

- El Indicador Hora del Gráfico es muy simple y fácil, pero puede ser muy importante controlar el tiempo antes de abrir cualquier operación manual. Este indicador muestra el tiempo en el gráfico entre 3 opciones diferentes. Parámetros de entrada : - Mostrar Tiempo : Seleccione todas las opciones de tiempo que desee ver. Hora local (Hora del equipo personal), Hora del servidor (Hora del intermediario) o Hora GMT. Recomendaciones: - Use solo un Indicador de tiempo de gráfico para cada cu
FREE
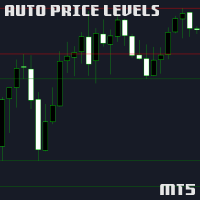
Auto Levels is a technical analysis indicator designed to automatically identify and draw support and resistance levels on price charts. The robot is capable of automatically identifying support and resistance levels based on historical price patterns, eliminating the need for manual analysis. You can set the maximum number of lines that the indicator plots as a parameter
FREE
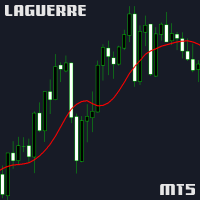
Laguerre Indicator with Gamma Input Overview: The Laguerre Indicator is a sophisticated financial analysis tool designed to provide traders and investors with a dynamic and responsive method to track market trends. Its core functionality is centered around a unique algorithm that adapts to market volatility, offering clearer insights compared to traditional indicators. Key Feature - Gamma Input: Gamma: The sole input for the Laguerre Indicator, 'gamma,' plays a pivotal role in calibrating the i
FREE

Este indicador apresenta 7 médias configuráveis, que podem facilmente ser utilizadas em robôs ou em operações manuais.
Facilita a identificação de tendências e reversões. Seus buffers estão ordenados e são facilmente identificáveis para utilizar em robôs. Liberado para uso em operações manuais ou automatizadas.
Em breve vamos postar um robô que utiliza estas médias como parâmetro de negociação.
FREE

В этой индикатор график показателя не отражает на основную ценового движения и не выделяет поворотные точки. Полученный показатель сглаживается по методом ЕМА. График сглаженного показателя достаточно и с минимальным запаздыванием аппроксимируется колебания ценового движения и поворотные точки. Нормировка позволяет значение индикатор интерпретировать как степень перепроданности рынок. Осциллятор поваляет различать сигналы о перекупленности/перепроданности рынка, об окончании тренда и о развор

An Implied Fair Value Gap (IFVG) is a three candles imbalance formation conceptualized by ICT that is based on detecting a larger candle body & then measuring the average between the two adjacent candle shadows.
This indicator automatically detects this imbalance formation on your charts and can be extended by a user set number of bars.
The IFVG average can also be extended until a new respective IFVG is detected, serving as a support/resistance line.
Alerts for the detection of bullish/be

Note: If you want to apply this indicators on indicators which are shown in a sub-window, then consider using this indicator instead: https://www.mql5.com/en/market/product/109066.  ; AIntel Predict - Your Gateway to Future Trading Success! Unlock the power of predictive analytics with AIntel Predict. Say goodbye to the guesswork and hello to improved forecasting, as AIntel Predict leverages historical data to unveil the future of your trades like never before. Whether you're a seasoned tra
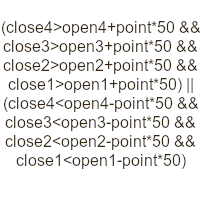
Indicator for research and finding candle bars patterns real time. Options: Alerts - Enabling alerts Push - Enable push notifications BarInd - On which bar to look for patterns for notifications (1 - formed, 0 - forming) ID - Identifier. Appended to the names of graphic objects and to the message Formula - Formula. In the bar price formula: open1, high1, low1, close1, etc. (open0, high25... any number, 0 is also possible - low0, open0...). Counting bars from right to left from zero. You can use
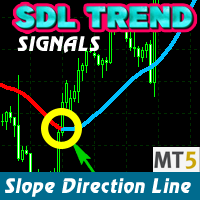
The SDL Trend Signals MT5 indicator shows the market direction with a colored moving average line. It has three inputs: Period (calculation period), Method (calculation method), and Applied price (price used for calculations).
The indicator has three buffers: Uptrend, Downtrend, and ExtMapBuffer (for indicator values). The Bullish slope is in BLUE, and the Bearish slope is in RED. For example, an upward slope indicates a Bullish market (Blue), and a downward slope indicates a Bearish market (R

It is 1 Minute Strategy. When Indicator Gives Signal Then Put on Buy. It's Best Work on Crash 300 & Crash 500. If you want to know anything details please Contact Me on Telegram In this Link: https://t.me/+mi_52VwFp3E4MGNl It is very nice for scalping & for who not gives enough time on market.
N/B: Please be carefully it's only for scalping & not trade all the day. It's only 10 or maximum 15 trade per day.
Thanks everyone.

VERSION MT4 — ИНСТРУКЦИЯ RUS — INSTRUCTIONS ENG
Funciones principales: Señales de entrada precisas ¡SIN RENDERIZACIÓN! Si aparece una señal, ¡sigue siendo relevante! Esta es una diferencia importante con respecto a los indicadores de redibujo, que pueden proporcionar una señal y luego cambiarla, lo que puede provocar una pérdida de fondos depositados. Ahora puedes ingresar al mercado con mayor probabilidad y precisión. También existe la función de colorear las v

Zonas de reversión / Volúmenes máximos / Zonas activas de un jugador importante = SISTEMA TS TPSPRO INSTRUCCIONES RUS / INSTRUCCIONES ESP / Versión MT4 Cada comprador de este indicador recibe adicionalmente GRATIS:
3 meses de acceso a señales comerciales del servicio RFI SIGNALS: puntos de entrada listos para usar según el algoritmo TPSproSYSTEM. Materiales de formación con actualizaciones periódicas: sumérgete en la estrategia y haz crecer tu niv

Este VWAP es un VWAP simple, pero hemos agregado alertas para que sepas cuando el precio toque el VWAP simple o cuando el precio cruce el VWAP. Este indicador es un indicador de VWAP tradicional para MetaTrader 5 (MT5). Los parámetros por defecto son los del VWAP normal, pero tienes la capacidad de utilizar nuevos cálculos y lo mejor: Cuando el precio toque o cruce el VWAP, lo sabrás a través de alertas, notificaciones en el teléfono móvil, correo electrónico o eventos de sonido. indicador gratu
FREE

Descubra el Poder de "BigPlayerRange": Su Aliado en el Análisis Técnico de Mercado Le presentamos BigPlayerRange , una herramienta avanzada de análisis técnico diseñada para revelar las zonas de interés institucional en el mercado. Con esta poderosa herramienta, podrá identificar con precisión las áreas donde los grandes jugadores están activos y mejorar sus estrategias de negociación. Características Principales: Mapeo de Zonas de Interés Institucional : BigPlayerRange destaca las zonas

Orders SL and TP Values Show Este es un indicador que muestra los valores de Pérdidas y Ganancias sobre las líneas del gráfico principal. Además, se mostrará la distancia en puntos.
Algunas de las características de este indicador son:
Opción de incluir valores swap para un cálculo más preciso de los valores de Stop Loss y Take Profit de tus órdenes. (Activado por defecto) Opción de incluir el número de ticket a la izquierda del valor del precio. Esto es útil para identificar el nivel según la
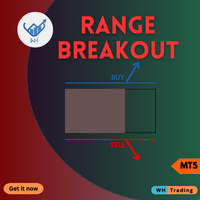
Desbloquee una nueva dimensión del trading con nuestro indicador MQL5 de vanguardia, Range BreakOut MT5
Esta poderosa herramienta está diseñada para identificar y capitalizar los movimientos de precios a medida que salen de los rangos establecidos.
proporcionándole la precisión y confianza necesarias para prosperar en el dinámico mundo de los mercados financieros.
Versión MT4 : WH Range BreakOut MT4
Características:
Detección de rango precisa. Señales de ruptura en tiempo real. Parámetros

El Indicador ATR Projeção destaca como una herramienta robusta en el análisis técnico, diseñada para proporcionar información precisa sobre los límites potenciales de movimiento de precios en el mercado financiero. Su enfoque flexible permite a los usuarios personalizar las métricas de análisis de manera intuitiva, adaptándose a las necesidades específicas de cada activo operado.
Funcionamiento Personalizable:
Por defecto, el ATR Projeção opera considerando el 30% de la media de los últimos 10

El objetivo del indicador "Black Horse" es identificar divergencias entre la acción del precio y el indicador VWAP. Emplea filtros para descartar posibles divergencias falsas y generar alertas de alta calidad y precisas.
Las divergencias bajistas se representan con puntos rojos sobre la vela, mientras que las divergencias alcistas se muestran con puntos verdes debajo de la vela.
El filtro principal para las divergencias se centra en el ATR (Rango Verdadero Medio) y el movimiento del precio en

Make your decisions easier when rolling Covered Call. This robot provides you with information that aids in decision on how and when to roll your structure. It works for any asset in the spot market that has authorized options series on B3 (Brazilian stock exchange). Associate the robot with the asset you want to use for the Covered Call. How to use the robot: Set parameters for your current structure: Purchase price of the base asset in your structure. Code of the Call you used to build your st
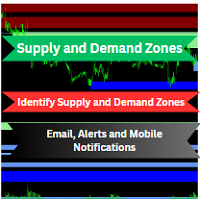
This powerful Indicator can automatically identify supply and demand zones and send you alerts, email and push notification on mobile whenever a new zone is created or when the price enters a specific zone.
This indicator integrates with any timeframe and chart or currency pair, ensuring its versatility across your trading endeavors. Supply & Demand Zones Finder(SDZF) indicator seamlessly identifies proven supply and demand zones, areas where price has consistently found support or resistance.

Este indicador nos permite identificar condiciones inusuales de volatilidad.
Si la línea ATR está por debajo de la línea Bollinger media, se supone que la volatilidad está por debajo de la media.
Si la línea ATR está por encima de la línea Bollinger media, se supone que la volatilidad está por encima de la media.
Si la línea ATR rompe la banda superior de Bollinger, se supone que la volatilidad es alta.
Si la línea ATR rompe la banda inferior de Bollinger, se supone que la volatilidad es b
FREE

Este indicador permite identificar visualmente con otro color las velas que superan un limite determinado del ATR. Solo debe arrastrarse y ponerse en el grafico. El usuario debe ingresar el valor del periodo del ATR. El usuario debe ingresar el valor del limite del ATR con el cual desea identificar las velas. En la pestaña de colores, el usuario puede seleccionar los colores con los cuales desea repintar las velas.
Se recomienda que el primer color siempre sea Ninguno. El segundo color corresp
FREE

For MT4 version please click here . Introduction Most traders use candle patterns as a confirmation tool before entering a trade. As you know there are lots of candle patterns out there. However I realized most of them can be generalized in simple rules. So I developed my own candle pattern(Although I cannot say for sure this is mine). pattern description The pattern consists of three consecutive candles. This is true for most of the patterns out there (considering there is a confirmation neces
FREE

Unlock the power of the market with our game-changing SMC Liquidity Zone Scanner – the ultimate tool that transforms your trading strategy! Say goodbye to uncertainty and hello to precision with our cutting-edge indicator, engineered to elevate your trading game. The SMC Liquidity Zone Scanner isn't just another tool; it's your gateway to mastering market liquidity, identifying critical break of structure points, and pinpointing support and resistance levels effortlessly. Powered by state-of-th

AliSession Highlight is an indicator that highlights a specific period of time according to your preferences. It can help you gain a clear vision of price movements into a specific session, the range of a session, and also to easily identify the high and low of the session. You can use it on any currency pairs, indices, and any timeframes. Settings: Start Hour: Set the hour to initiate the session highlight. Start Min: Set the minute for the start of the session highlight. End Hour: Specify the
FREE

The indicator is designed to close positions on the market in time. For example: to take profits ahead of schedule if the price has not reached TakeProfit, and the market is turning around. The indicator analyzes the momentum, not the trend. He does not give any information about the trend. The indicator is well suited for finding divergence. The Ershov 38 Parrots indicator dynamically adjusts to the market and detects price movement impulses of medium and high amplitude. It almost does not rea

AliPivot Points is a Meta Trader 5 Indicator that draws you the latest pivot points. You can choose from timeframes ranging from 1 Minute to 1 Month. Calculation methods for pivot points includes: Classic Pivot Points Camarilla Pivot Points Fibonacci Pivot Points Woodie Pivot Points You can personalize the line colors, style, and width to suit your preference. The indicator displays values on the right side of the chart. AliPivot Points values can also be utilized by developers for creating Expe
FREE

ICT Kill zone and Macros Indicator mark and display the following zone times on the chart: Kill zones Kill zone Forex Asian
London Open New York Open London Close Central Bank Dealing range
Kill zone Indices Asian London Open New York AM New York Lunch New York PM Power Hour
Macros London 1 London 2 New York Am 1 New York AM 2 New York Lunch New York PM 1 New York PM 2
Silver bullet London Open New York AM New York PM
Sessions Asian London New York
Chart The display of Kill zone , Macro ,
Apresentação:
- O Indicador "VWAP Contínua" da CIT Group é um indicador especializado na bolsa brasileira (B3). Objetivo:
- Especificamente desenvolvido para o perfil de pessoas que operam IntraDay.
Funcionamento:
- Calculado com base nos trades realizados durante o pregão, sendo atualizado a cada 1 segundo, tendo maior precisão dos preços Funcionalidades:
- Entrega de até 5 VWAPs simultâneas, onde as 4 primeiras são configuráveis, e a última é fixa sendo a diária - Opção para visualizar di
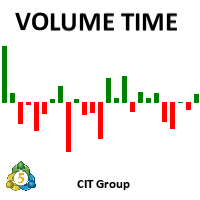
Apresentação:
- O Indicador "Volume Time" da CIT Group é um indicador especializado na bolsa brasileira (B3). Objetivo:
- Especificamente desenvolvido para o perfil de pessoas que operam IntraDay.
Funcionamento:
- Calculado com base nos trades realizados durante o pregão, sendo atualizado a cada 1 segundo, tendo maior precisão dos volumes Funcionalidades:
- Entrega de um conjunto de parâmetros como tipo de indicador (Financeiro, Volume ou Quantidade), estes podendo ser calculado (Unitário, U

Daily supply and demand levels for breakouts or reversals. Use on 1 Hour charts No nonsense, for the confident trader who trades price action supply and demand levels with daily projections without the fluff using 1 Hour charts. MT4 Version: https://www.mql5.com/en/market/product/108234 The Bank Trader Indicator is a sophisticated tool employed by institutional traders, particularly those in banking institutions, to navigate the complex world of forex markets. Rooted in the principles of daily
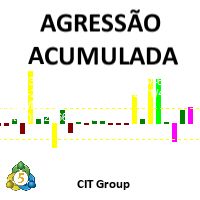
Apresentação:
- O Indicador "Agressão Acumulada" da CIT Group é um indicador especializado na bolsa brasileira (B3).
Objetivo:
- Especificamente desenvolvido para o perfil de pessoas que operam IntraDay.
Funcionamento:
- Calculado com base nos trades realizados durante o pregão, sendo atualizado a cada 1 segundo, tendo maior precisão da agressão
Funcionalidades:
- Entrega de um conjunto de parâmetros para calcular a média de agressão (Volume ou Quantidade), estes podendo ser calculado

Reverso 1.0 est un Indicateur Technique basé sur la tendance. Cet Indicateur intègre une formule exceptionnelle qui permet de décider au croisement du signal et du prix de clôture d'entrer dans le marché.
Le timeframe indiqué est compris entre 2H et 1D.
Les symboles que je conseille sont les suivants:
BTCUSD-ETHUSD
XAUGBP-XAUEUR-XAUAUD-XAGEUR-XAUUSD
NZDJPY-GBPUSD-EURJPY-GBPJPY-USDJPY-CHFJPY-CADJPY-AUDJPY

ParabolicSAR is a multi-currency professional Expert Advisor that uses a variety of trading strategies in the foreign exchange market. Each of the individual strategies has gone through many years of development and testing on quotes with 100% simulation. Thanks to the use of several strategies for each currency pair, the Expert Advisor is successfully tested with 100% simulation of quotes over a long period of time. IMPORTANT! After the purchase please send me a private message to receive
Compruebe lo fácil y sencillo que es comprar un robot en la MetaTrader AppStore, la tienda de aplicaciones para la plataforma MetaTrader.
El Sistema de pago MQL5.community permite efectuar pagos con ayuda de PayPal, tarjeta bancaria y los sistemas de pago más populares. Además, le recomendamos encarecidamente testar el robot comercial antes de la compra, para así hacerse una idea más completa sobre él.
Está perdiendo oportunidades comerciales:
- Aplicaciones de trading gratuitas
- 8 000+ señales para copiar
- Noticias económicas para analizar los mercados financieros
Registro
Entrada
Si no tiene cuenta de usuario, regístrese
Para iniciar sesión y usar el sitio web MQL5.com es necesario permitir el uso de Сookies.
Por favor, active este ajuste en su navegador, de lo contrario, no podrá iniciar sesión.