Смотри обучающее видео по маркету на YouTube
Как купить торгового робота или индикатор
Запусти робота на
виртуальном хостинге
виртуальном хостинге
Протестируй индикатор/робота перед покупкой
Хочешь зарабатывать в Маркете?
Как подать продукт, чтобы его покупали
Новые технические индикаторы для MetaTrader 5 - 33
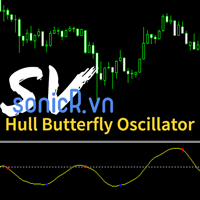
The Hull Butterfly Oscillator (HBO) is an oscillator constructed from the difference between a regular Hull Moving Average ( HMA ) and another with coefficients flipped horizontally . Levels are obtained from cumulative means of the absolute value of the oscillator. These are used to return dots indicating potential reversal points . This indicator draw line in separate window, plus blue dot (for buy signal) when hull oscillator is peak and red when sell signal. It also includes integrate

A pin bar pattern consists of one price bar, typically a candlestick price bar, which represents a sharp reversal and rejection of price. The pin bar reversal as it is sometimes called, is defined by a long tail, the tail is also referred to as a “shadow” or “wick”. The area between the open and close of the pin bar is called its “real body”, and pin bars generally have small real bodies in comparison to their long tails.
The tail of the pin bar shows the area of price that was rejected, and
FREE

This is the Chandelier Exit trend indicator applied to heiken ashi candles based on "G TREND GUNBOT" by "LUIS_GANDATA_G_TREND" on tradingview. Heiken ashi candles filter out many of the chops and therefore as an input to Chandelier Exit you achieve well filtered Buy and Sell signals. Also you can choose to apply the trend indicator to normal candles via input tab. (two in one indicator) This is a non-repaint and light processing load indicator. You can message in private chat for further change
FREE

TransitHazard is a trading indicator system's that use one of the best trading strategy. The indicator system have input options so that you can adjust or set the strategy to work the way you would like by allowing you to set the period and other adjusting set inputs and the indicator system has color settings to set your own preferred colors. Works on all the time frames and on all the pairs. Green colored candles give a buying signal and an alert after one bar will be given so that you don't m

To download MT4 version please click here . Metatrader users are limited to few moving average types. Therefor I decided to create a package consisting of all MAs I knew. This package suggests 12 different types: { SMA, EMA, DEMA, TEMA, WMA, VWMA, SMMA(RMA), HullMA, LSMA, ALMA, SSMA, TMA } You can configure them via input tab. This is a non-repaint indicator with light load. To implement them I referred to standard libraries of pine script.
FREE
300 downloads without review ? !!!!
If continued. I will not share any product for free. :( Small and very simple timer next to the current price to show the end time of the current candle
Very useful and important for scalpers and those who work on price action.
We assure you that we welcome any suggestions to improve this indicator and make the necessary changes to improve this indicator.
You can contact us via Instagram, Telegram, WhatsApp, email or here. We are ready to answer you.

To download MT4 version please click here . This is the exact conversion from TradingView: "B-Xtrender" By "QuantTherapy". - It is an oscillator based on RSI and multiple layers of moving averages. - It is a two in one indicator to calculate overbought and oversold zones for different RSI settings. - This indicator lets you read the buffers for all data on the window. - This is a non-repaint and light processing load indicator. - You can message in private chat for further changes you need.
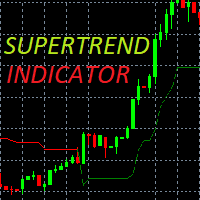
A super-trend indicator is plotted on either above or below the closing price to signal a buy or sell. The indicator changes colour, based on whether or not you should be buying. If the super-trend indicator moves below the closing price, the indicator turns green, and it signals an entry point or points to buy. If a super-trend closes above, then the indicator shows a sell signal in red. You will also note that at the point where buy or sell signal is generated is the crossover point. At the p

BUY INDICATOR AND GET EA FOR FREE AS A BONUS + SOME OTHER GIFTS! ITALO TREND INDICATOR is the best trend indicator on the market, the Indicator works on all time-frames and assets, indicator built after 7 years of experience on forex and many other markets. You know many trend indicators around the internet are not complete, does not help, and it's difficult to trade, but the Italo Trend Indicator is different , the Italo Trend Indicator shows the signal to buy or sell, to confirm the signal t
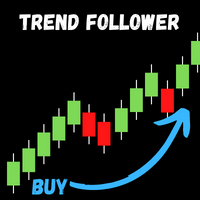
Trend Follower predicts the possible start of a trend, the indicator uses as a basis for the closing high possibility of the indicators to identify a possible entry or low possibility, the indicator just an entry parameter which can be the period .
Input parameters Period : A positive integer that indicates the period for number
Alert: Sends an audible signal when a signal occurs
Check out other products: https://www.mql5.com/en/users/junioredj16/seller
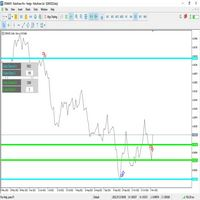
Индикатор - Price Channel состоит из двух независимых ценовых каналов и уровней ценовых зон - (А / B). Индикатор постоянно следя за поведением и движением цены, а также за пробоями уровней каналов - (А / B), переставляя уровни и фиксируя новые зоны экстремумов максимумы и минимумы. Для анализа предыдущих и текущих зон максимума и минимума, не зависимо указывается количество баров в каждом канале - (А / B). На графике индикатор выводит полезную информацию для каждого канала - (А / B): 1. Количес

Рыночные структуры - это те, которые при прорыве на более высоком таймфрейме могут помочь трейдеру очистить тренд.
1. Этот индикатор нарисует ZigZag только до 2 последних структур (предыдущий максимум и минимум ZigZag), а новый бар ZigZag будет сформирован только тогда, когда произойдет разрыв структуры.
2. Он дает Терминал и Push-уведомление о нарушении структуры
3. Увеличьте и уменьшите Extdepth зигзага с помощью клавиш [ и ] для регулировки колебания
4. Измените цвета линий AB BC
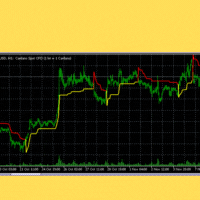
Supertrend — относительно непопулярный технический индикатор, разработанный, как указано выше, Оливье Себамом, чтобы помочь трейдерам определять тренды и знать, когда покупать или продавать финансовый актив. Индикатор не найден по умолчанию в TradingView и MetaTrader. Тем не менее, вы можете найти на рынке специальные индикаторы Supertrend.
При нанесении на график индикатор супертренда отображается двумя цветами. Хотя их можно изменить, цвета по умолчанию обычно красный и зеленый. Когда он зе

Разворотный отклоняющийся бар Билла Вильямса с ангуляцией. В качестве угла используется угол между зелёной линией и вершиной/низом бара, что в принципе соответствует обновлённым рекомендациям от Джастин Вильямс Angulation for the Wiseman Bullish and Bearish Divergent Signal Bar - YouTube . Настройки по умолчанию угол 85 и 10 баров с момента пересечения линии Губ Аллигатора работают достаточно хорошо. ВНИМАНИЕ! С другими настройками, например с углом меньше 85 появляется слишком много сигналов,
FREE

This indicator will mirror the assets in use in another metatrader, being able to choose the timeframe and a template. This is the Metatrader 5 Client, it needs the Metatrader 4 or 5 Server versions: Metatrader 4 Mirror Chart Server: https://www.mql5.com/en/market/product/88644
Metatrader 5 Mirror Chart Server: https://www.mql5.com/en/market/product/88652 Details of how it works in the video.
FREE
This indicator will mirror the assets in use in another Metatrader, being able to choose the timeframe and a template. This is the Metatrader 5 Server, it can work with Metatrader 4 or 5 Client versions: Metatrader 4 Mirror Chart Client: https://www.mql5.com/en/market/product/88649
Metatrader 5 Mirror Chart Client: https://www.mql5.com/en/market/product/88650 Details of how it works in the video.

Symbol Changer this Indicator for make more easy when change Chart pair, this more usefull if trader make deal with many pair.
Property Input Indicator Custom Unique ID : Indicator have Id for make different. Show Profit Loss : Adjustable for Show or no Profit and Loss Option Horizontal/Vertical button : Button can change Horizontal or Vertical. Option Window : Adjustable in main Chart as window or buttom chart as Window 1, 2 Main Pairs Preset / Own Pair : available group pair for make easy ha

A supply and demand indicator designed with a minimalist trading strategy based on the nature of the market. Indicator type: Price Action indicator The Bull zone is a strong support area, and the Bear zone is a strong resistance area. When a Bull zone was breakout, it becomes the "base" of the Bears and vice versa. When the price meets these areas, there is a high probability that the price will reversal , so we call them Obstacles. It is a suitable indicator for traders interested in manual pr

Hush mt5 это передовой индикатор, который дает сигнал о перекупленности или перепроданности рынка в определенный период времени Hush mt5 плюсом данного индикатора является то, что он не исчезает после сигнала на графике Подходит для любой торговли : форекс, акции, крипто валюта, металлы Hush mt5 можно использовать на любом временном периоде.Cигнал идет на начало следующей свечи после стрелки Hush mt5 показал себя лучше всего на периоде H1,H4,daily Его можно использовать помимо форекса, в

TransitBlueOcean is indicator system that uses ocean wave's pattern, to help one to know when to buy and when to sell. The indicator system is very powerful like the ocean waves. Join the mql5 channel for TransitBlueOcean https://www.mql5.com/en/channels/transitblueocean How to use: Zoom in so that the Ocean will appear on your chart.
Buy when you see the candles, the candle will be above the ocean wave (buying signal).
Sell when you can't see the candles, the candles will be inside the w

This is 3 pre-filtered CCI, Commodity Channel Index, indicators pre-filtered by your choice of 3 Smoothing and/or Averaging methods. I have found certain settings to be very reliable and I plan to incorporate this into an Expert Advisor in the future. I have added a new form of Averaging: Smoothed TEMA, or Triple Smoothed EMA, Exponential Moving Average. It gives less noise than the TEMA, but provides the smoothing of the Double Smoothed EMA, so it should be a slight bit quicker. PLEASE Download

The value of the MMCCI indicator is calculated based on the "Minors" and "Majors" currency pairs and is based on the original CCI algorithm. This gives us a more accurate result than if we only observed the value of the current currency pair. You can request alerts when the CCI value crosses or returns from the specified level or crosses zero. All settings can be saved in a template. Setting options:
Basic signals that can be enabled separately for the current and the previous candle: Overbou
FREE
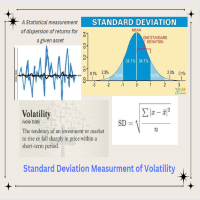
Standard Deviation Pivot Point will enhance your trading and highlight great trade opportunities with the Support and Resistance levels that professionals use based on volatility of market. Standard Deviation Pivot trading is a simple effective method for entry and finding targets that are statistically on your side, highlighting market key levels has been used by professionals for decades and is effective on all symbols: Forex, Crypto, Stocks, Indices. Standard deviation is a measurement if vol

Auto Fibo - это индикатор, разработанный для улучшения вашей ручной торговли. Он автоматически рисует золотое сечение, экономя ваше время и облегчая торговлю. Прикрепите индикатор к графику, и он автоматически построит точную золотую пропорцию, избавив вас от необходимости искать критическую точку. Интерфейс настраивается в зависимости от вашего компьютера на приблизительные высокие и низкие точки диапазона. Этот индикатор исправит большинство ошибок выбора начальной и конечной точек. Для каж
FREE
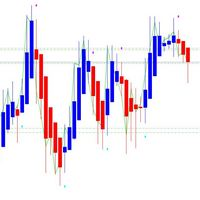
Индикатор Heiken Ashi Signal предназначен для торгового терминала Мт5. За основу был взят стандартный индикатор Heiken Ashi который есть в терминале Мт5. Индикатор можно применять как в ручной, а также автоматической торговли авторскими советниками. Для применения индикатора Heiken Ashi Signal в торговых экспертах есть сигнальные буферы для входа в рынок и открытия позиций на покупки и продажи.
Об этом читайте ниже подробнее. Возможности и характеристики индикатора Heiken Ashi Signal: Индикато

Индикатор строит текущие котировки, которые можно сравнить с историческими и на этом основании сделать прогноз ценового движения. Индикатор имеет текстовое поле для быстрой навигации к нужной дате.
Параметры :
Symbol - выбор символа, который будет отображать индикатор; SymbolPeriod - выбор периода, с которого индикатор будет брать данные; IndicatorColor - цвет индикатора; Inverse - true переворачивает котировки, false - исходный вид;
Далее идут настройки текстового поля, в которое можн

ПРОгрессивный индикатор нового поколения от INFINITY. Predictor PRO использует собственную стратегию расчета входа и выхода. Индикатор без перерисовки сигналов! Это очень важно для реальной торговли. Индикатор можно использовать для любых валютных пар, металлов, криптовалют или индексов. Лучшее время графика Н1. В отличии от других индикаторов Predictor PRO показывает точку входа Buy/Sell и точку выхода Close. Расчет профита всех сигналов в пунктах на панели помогает подобрать оптимальные на

I do not have the exact indicator for MT4 but the nearest possible look alike can be downloaded from here . Also you may check this link . This is the exact conversion from TradingView: "Donchian Trend Ribbon" By "LonesomeTheBlue". One of the coolest indicators out there to detect trend direction and strength. As a trader you always need such indicator to avoid getting chopped in range markets. There are ten buffers as colors to use in EAs also. The indicator is loaded light and non-repaint. Not

BUY INDICATOR AND GET EA FOR FREE AS A BONUS + SOME OTHER GIFTS! ITALO VOLUME INDICATOR is the best volume indicator ever created, and why is that? The Indicator works on all time-frames and assets, indicator built after 7 years of experience on forex and many other markets. You know many volume indicators around the internet are not complete, does not help, and it's difficult to trade, but the Italo Volume Indicator is different , the Italo Volume Indicator shows the wave volume, when market

To download MT4 version please click here . - This is the exact conversion from TradingView: "Linear Regression Candles" By "ugurvu". - The overall look of the indicator is like Heiken Ashi. - It can be used as a trend confirmation indicator to detect the right trend direction. - This indicator lets you read the buffers for Candles' OHLC. - This is a non-repaint and light processing load indicator - You can message in private chat for further changes you need. Thanks
The Black Swan Trading Panel was designed and built to make trading as easy as possible. Track any trading instruments with multiple time frames on one chart and thus have a complete overview of the market situation. The Black Swan Trading Panel uses three custom indicators that will give you a clear overview of the market situation regarding trend, price deviations and support/resistance zones. This indicator is highly customizable and therefore suitable for every type of trading. With this too

The Mathematical Trader is a new addition to my highly profitable indicator products. It can be used for scalping or catch the beginning of mid-term strong trends . This is an MT5 indicator only that utilises several mathematical formulations and has been designed to run on any instrument and any time frame less than the daily time frame . The lower the timeframe the more frequent the signals. The indicator will signal to you to go long (buy) or short (sell) if you see a green or red arrow next

To download MT4 version please click here . The Volume Oscillator measures volume by analyzing the relationship between two Moving Averages. The Volume Oscillator indicator subtracts a fast MA from slow MA. The fast and slow MA periods are configurable via input tab. Volume indicators are an ingredient of trading systems to avoid entry in thin liquidity markets. Having set a threshold on Volume Oscillator you can avoid entering chop. Buffers are available to access via EA.
FREE

Hello ! If you scroll in one chart, all charts will be scrolled If you change the time frame in one chart, it will change in all charts Of course, you can turn this feature on or off All the charts in which you want changes to be applied are specified through ID in the indicator settings You can scroll the charts of different time frames in two ways at the same time 1: Coordinated based on time That is, 1 hour candle is 60 candles one minute back 2: scroll in the form of number of candles That i
Interval Breakout (IB)
is a Breakout Indicator Mixing with Time Interval.
We can set a Particular Time and Support / Resistance Line Length for a Breakout Scanning. This is strongly recommended to: Check the Video properly to understand the Indicator setup, how does it work and exactly how to take Entries and Exit according to this Indicator. Give preference to Support / Resistance zone to get rid of False signal.
Steps to Setup the Indicator: Install the Custom Indicator; Set all the

To download MT4 version please click here . This is the exact conversion from TradingView: "RSI versus SMA" By "JayRogers". This indicator lets you read the buffers for all Lines on chart. Note: This is an indicator, Not an expert. Meaning It does not take trades. If you want the EA please contact via message. You can easily use the indicator to understand the logic behind trades that the TradingView strategy takes. The strategy is profitable if this indicator is applied to the right symbol at
FREE

To download MT4 version please click here . This is the exact conversion from TradingView: "WaveTrend [LazyBear]" By "zeusuk3". One of the coolest indicators out there to detect overbought and oversold zones. It can be used as a part of more complicated strategy and for confirming a potential trade setup. There are buffers to use in EAs also. The indicator is loaded light and non-repaint. - You can message in private chat for further changes you need. Thanks for downloading

Neural Bands is a scalping indicator. There are 2 different deviation bands for oversold and overbought levels. Color candles are to determine the trend if it passes the deviations and is showing a strong trend or if the color candles stop at the deviations and revert back to the mean. This indicator is a type of regression indicator trading ranges and breakouts in price. 15 min charts and above recommended. TRADE WITH THE LARGER TREND DIRECTION

The trend indicator " Super Trend Flexible Alert " has a minimum of settings. This indicator is designed to be as easy to use as possible. The indicator shows the trend with a main colored line ("SuperTrend" line, which you can see in the "Data Windows" window). Also, in places where the trend changes, the indicator shows colored arrows ( "STBuy" and " STSell" icons, which you can see in the "Data Windows" window ). In places where the trend changes, the indicator doesn't give a s

RaysFX (Average Directional Movement Index)
Technical indicator (ADX) helps to determine the market trend. It was developed and described in detail by Welles Wilder.
The simplest trading method based on the system of directional movement implies comparison of two direction indicators: the 14-period +DI one and the 14-period -DI.
To do this, one either puts the charts of indicators one on top of the other, or +DI is subtracted from -DI.
W. Wilder recommends buying whenever the +DI crosses ab
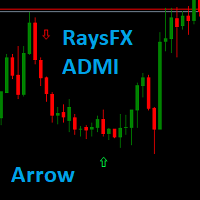
RaysFX (Average Directional Movement Index) to → ARROW
Technical indicator (ADX) helps to determine the market trend. It was developed and described in detail by Welles Wilder.
The simplest trading method based on the system of directional movement implies comparison of two direction indicators: the 14-period +DI one and the 14-period -DI.
To do this, one either puts the charts of indicators one on top of the other, or +DI is subtracted from -DI.
W. Wilder recommends buying whenever the +DI

Когда вы работаете с несколькими активами и имеете несколько открытых позиций по активам, немного сложно визуализировать, когда прибыль или прибыль дает каждая активная проблема, поэтому с учетом этого мы разрабатываем этот индикатор, где он облегчает визуализацию операций с активами. , где вы сможете открыть несколько разных ресурсов и сможете визуализировать индивидуальный результат каждого актива и ускорить принятие решений в своем бизнесе.
FREE

Доброго времени суток!
Представляю вам торговый технический индикатор для синтетических индексов брокера Deriv. Данный индикатор работает ТОЛЬКО с нижеуказанными индексами: Boom 300 Index Boom 500 Index Boom 1000 Index Crash 300 Index Crash 500 Index Crash 1000 Index Индикатор создан для подачи сигналов на открытие среднесрочных сделок в сторону Спайков. Но вы можете открывать сделки и в противоположную Спайкам сторону, на свой риск. Торговля только на М1. Другие ТФ не гарантируют корректную р

Developed by Smart Trader - Smart Reversion Pattern is an indicator capable of identifying reversal patterns , both bullish reversals and bearish reversals.
It is designed to provide fast, real-time awareness of patterns.
We also thought about the interface part, creating a clean and pleasant look to identify formation patterns on the chart.
Note: If any pattern you need is not listed, just contact us and request inclusion - we usually respond within a few hours.
Bearish Reversal P

this indicator has the finality of show in graph the size of candle in formation to show the force of market in some moments of the day. This indicator is free and based on example disponible on the comunity. I'm disponibilizing here to anyone who don't know about programing. Please enjoy this indicator and leave a coment or a rate to help this indicator to other people who needs.
FREE

MT4 Version SMT Divergences MT5
SMT Divergences is one of the most innovative indicators in the market. It offers the possibility of analyzing price divergences between 2 pairs. These divergences highlight and help to foresee what banks and institutions are planning to do. SMT divergences also provides you with a kill zones indicator and the possibility of filtering divergences occurring during these kill zones. This indicator is specially powerful if applied in 2 highly correlated pairs. A pr

This MT5 indicator has been designed to be used on any currency pair and any time frame . It has the scalper and swing trader in mind. The indicator looks for short-term high-probability reversals in price and will indicate to you to go long (buy) or short (sell) if you see a green or red arrow next to the current candlestick respectively. The indicator provides the best trading opportunities to you during the active trading hours of London and New York, but it will continue to give signals al

This MT5 indicator has been designed to be used on any currency pair or indices and on the daily time frame or higher . The indicator looks for medium-term high-probability continuations in price and will indicate you to go long (buy) or short (sell) if you see a green or red arrow next to the current candlestick respectively. The indicator paints an arrow when the specific criteria are met, however, you must wait until the current candlestick has closed until you enter a trade . Therefore you w

This MT5 indicator has been designed to be used on any currency pair, but not indices, on the ONE HOUR time frame only . This indicator has the highest win rate of all my indicators but it is not perfect and there is no holy grail in trading. The indicator looks for short-term high-probability trend continuations in price and will indicate you to go long (buy) or short (sell) if you see a green or red arrow next to the current candlestick respectively. The indicator paints an arrow when the spe

Ichimoku Genius (imG)
is a very Intelligent Indicator for the Perfect Entry & Exit. This is strongly recommended to: Check the Video properly to understand the Indicator setup, how does it work and exactly how to take Entries and Exit according to this Indicator. Please use this Indicator with "Pivot Points" & "Kijun-Sen" to get the Best result. Always give preference to Long Flat area of "KIJUN SEN" Line as this is act like a strong Support -or- Resistance.
Steps to Setup the Indicator: I

A simple and efficient indicator that plots and updates the 50% of the current day, for those who use this point as a reference in day trading.
On trend days the 50% region tends to be a good resistance point, ideal for making new entries.
On non-trend days (sideways) the 50% region is great for carrying out positions.
In addition, for study or back-testing criteria, you can define the amount of previous days to be plotted by the indicator.
For questions or suggestions, please contact u
FREE

The Candle Timer indicator is an Custom Indicator that displays the remaining time before the current candle would close. The Candle Timer indicator works by retrieving the time from the broker’s server. It also retrieves the time when the next candle would begin. Then, it calculates the difference between the projected open time of the next candle and the current time on the broker’s server. The difference between the open time of the next candle and the current server time is then displayed o
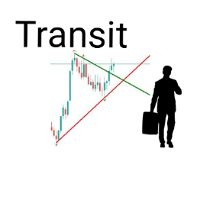
TransitX1 indicator is very useful, with unlimited signals and works on all the timeframes and all the piers. TransitX1 draws two trend lines very short trendlines (+/-20 bars) which can be considered as support and resistance. The support is in red trendline and the resistance is in green trendline. TransitX1 gives buying and selling signals, with only 3 being previous signals and the 4th one being the current signal. Buying signals are in green arrows and are always on the support trendline an
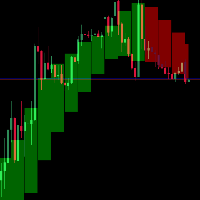
Anyone who is experienced in trading knows that longer time signals are trend signals. That's why it's always good to follow the trends of longer times to make a good trade.
With that in mind, I created the trend indicator in the background
Indicator Parameters TFBar - TimeFrame BackgroundEnabled - Enable Background NumbersOfBars - Numbers of Bar draw ColorUp - Color Up ColorDown - Color Down Smoothing - Heiken-Ashi Smoothing Average inpMA_METHOD - Smoothing Method width - Size Line bor
RSI Traffic Lights Dashboard Trend is you friend, one of the classical Trend following is the Relativ Streng Index (RSI). With RSI Traffic Light Dashboard you get an Overview how the current trend is moving for several Pairs. How many pairs you monitor, can be configured in Indicator settings. The order of symbols is equivalent to your Market Watchlist. The RSI Traffic Light Indicator alerts you if the trend is changing for your pair. Alert can be switched on/off
Important: Get informed about

This Indicator help you to identify trends and patterns. It shows the short-term, medium-term and long-term trend at the same time on the screen. It supports every timeframe except monthly. This indicator NOT implement the ZigZag indicator, but it uses its own algorithm.
Supported markets: - Forex - Metal - Energies Spot - in Energies Futures only o US Crude Oils - in Indices Spot only o US Tech 100 Index o UK 100 Index o US Wall Street 30 I
Tracker Candle Signal est un indicateur simple et pratique, capable de déterminer le mouvement des acheteurs et vendeurs, A savoir, qui aura le dessus à la fin de la chaque bougie en fonction de l'unité de temps choisi. Il est très précis sur les grandes unités de temps 1H, 4H, Daily. En effet, je l'utilises en daily pour comprendre le comportement du marché puis en 1H pour prendre position. Surtout n'hesitez pas à me faire un retour après utilisation.
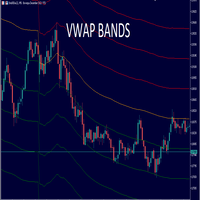
Este indicador contém 6 desvios, ótimo para ativos de alta volatilidade, podendo alterar as cores dos desvios como a largura da linha.
VWAP (Volume Weighted Average Price) nada mais é do que uma média móvel ponderada pelo volume das negociações de um ativo. Esse indicador é um dos mais utilizados pelos grandes investidores – na sua maioria institucionais –, pois permite ampla visualização da liquidez e dos pontos de interesse do ativo em análise. O volume é um dos elementos m

Индикатор дивергенции 10 разных индикаторов. Поиск и отображение классических и скрытых дивергенций. Индикаторы, в которых производится поиск дивергенций: MACD; MACD Histogram; RSI; Stochastic; CCI; Momentum; OBV; VWmacd; Chaikin Money Flow; Money Flow Index. Это реплика индикатора с ресурса tradingview , адаптированная под терминал MT5. MT4-версия доступна здесь: https://www.mql5.com/en/market/product/87846 Настройки: Bars in history for analysis - количество баров для анализа; Divergence Ty

Точки входа Trend ML нужно использовать как точки потенциального разворота рынка. Индикатор работает используя функцию циклично-волновой зависимости. Таким образом, все точки входа будут оптимальными точками, в которых изменяется движение.
Самым простым вариантом использования индикатора является открытие сделки в сторону существующего тренда. Наилучший результат дает сочетание индикатора с фундаментальными новостями, он может выступать в качестве фильтра новостей, то есть показывать наскол

Are you tired of drawing trendlines every time you're analyzing charts? Or perhaps you would like more consistency in your technical analysis. Then this is for you. This indicator will draw trend lines automatically when dropped on a chart. How it works Works similar to standard deviation channel found on mt4 and mt5. It has 2 parameters: 1. Starting Bar 2. Number of bars for calculation The starting bar is the bar which drawing of the trend lines will begin, while the number of bars for c
FREE

Trend Hunter использует в своей основе процесс выявления скорости изменения роста цены и позволяет найти точки входа и выхода с рынка.
Индикатор был создан на основе оригинальных индикаторов поиска экстремумов, индикатор хорошо подходит для определения разворота или большого резкого рывка в одну из сторон благодаря ему вы будете знать когда такое произойдет он вас уведомит появлением точки синего цвета на покупку красного на продажу.
Фундаментальный технический индикатор, который позволяе

Indicator Introduction: The indicator comes from network ,It is more stable relative to RSI or CCI. You can set the indicator to send emails/notifications/alerts when the previous bar has an up or down arrow, you can specify the text of emails by inputing string into the parameter box of "UpMessages/DownMessages". It can be used to analyze market trend and design new expert that is based on trend. If the indicator below the axis ,this is a buy zone. The trend indicator is suitable for M1 and ab
FREE

Promotion $66 lifetime for you.
The principle of this indicator is very simple: detecting the trend with Moving Average, then monitoring the return point of graph by using the crossing of Stochastic Oscillator and finally predicting BUY and SELL signal with arrows, alerts and notifications. The parameters are fixed and automatically calculated on each time frame. Example: If you install indicator on EURUSD, timeframe M5: the indicator will detect the main trend with the Moving Average on this t
RSI Traffic Light Indicator tracks several RSI ( Relativ Streng Index) Periods and informs you, if the trend is changing. Trend is you friend, one of the classical Trend following is the Relativ Streng Index (RSI). With RSI Traffic Light Indicator you will get information about trendchange. The RSI Traffic Light Indicator alerts you if the trend is changing for your pair. Different trendchange criterials and visualisation themes inclusive. Your can adjust the indicator Trendchange criterials by

The Squeezer indicator simply draws ascending lines with Sell signal in the downtrend and descending lines with Buy signal in the uptrend to catch the pullbacks and sniper entries. This is a common successful trading strategy being used by many successful traders, and the good thing about this strategy is that it works with all time frames. The difference is in the take profit level between them. Buy / Sell signals are triggered at the close of the current candles above / below the ascending or

Hello;
Tw79 time zone pivot strategy indicator finds important breakdowns and ensures the continuity of the total profit target by maintaining the profit margin in the same direction after the breakdowns.
Indicator input descriptions;
Start Hours: Indicates the start and reference point. Use a number zero or one.
Offset: It expresses the number of bars to be calculated after the reference. Average values are between 55-144.
Number of bar: It represents the last candle to be calculated

Pivot Point Super trend it can be used to catch price turning points and can show arrows for buying and selling. calculations are based on price peaks . you can control the price turning points by increasing the Pivot point period input on the indicator the ATR factor is for how far apart do you want the bands to be spread apart price break outs are also spotted in their early stages which will make trading much better
FREE

ПОСМОТРИТЕ НАШ НОВЫЙ СОВЕТНИК : : https://www.mql5.com/ru/market/product/95095?source=Unknown#description
Индикатор показывает время до закрытия свечи, а также время сервера на текущем графике. Очень прост в использовании, всего четыре настройки:
Lable Location- расположение таймера на графике; Display server time- показывать время сервера или нет; Sound alert when the candle is closed- использовать звуковой сигнал при закрытии свечи или нет; Colour -цвет цифр таймера. Другие полезные бесп
FREE

Xtrade Trend Detector is an indicator capable of finding the best opportunities to take a position in any stock market. Indeed, it is a great tool for scalpers but also for Daytraders. You could therefore use it to identify areas to trade, it fits easily on a chart. I use it to detect trends on Big timeframes and take positions on Small timeframes. Don't hesitate to give me a feedback if you test it.
MetaTrader Маркет - уникальная площадка по продаже роботов и технических индикаторов, не имеющая аналогов.
Памятка пользователя MQL5.community расскажет вам и о других возможностях, доступных трейдерам только у нас: копирование торговых сигналов, заказ программ для фрилансеров, автоматические расчеты через платежную систему, аренда вычислительных мощностей в MQL5 Cloud Network.
Вы упускаете торговые возможности:
- Бесплатные приложения для трейдинга
- 8 000+ сигналов для копирования
- Экономические новости для анализа финансовых рынков
Регистрация
Вход
Если у вас нет учетной записи, зарегистрируйтесь
Для авторизации и пользования сайтом MQL5.com необходимо разрешить использование файлов Сookie.
Пожалуйста, включите в вашем браузере данную настройку, иначе вы не сможете авторизоваться.