Nuevos indicadores técnicos para MetaTrader 5 - 26

ICT Core Content Concepts turned into indicator plus all previous tools known from the Position Smart Indicator . This makes it the Full PSI Private Version ( read more ) restricted up to now but available only after the Mentorship Core Content was made public on YouTube. You will find many price action study tools like: Central Bank Dealing Range - CBDR Asian Range FLOUT Profiles and SD targets on the CBRD, Asian Range and Flout both on the wicks and on the bodies Seek & Destroy Prof

Macd Sar ! es un indcidaro mcd convinado con el indicador parabolic sar ! cuenta con la estrategia de quiebres , donde la linea gris cruza por arriba de las lineas rosas , y cambio de puntos de parabolic sar , esta marcando compra para la venta es viseversa , sirve para todas las temporalidades ! es buena para hacer scalping , y para hacer largos apta para los mercados de forex y indices sinteticos ! Buen profit ! World Inversor.

Super Treend ! es un indicador cuya estrategia se basa en ropturas de lineas dando señal a venta o compra , como bien se ve cuando te esta marcando una venta te pone un punto rojo , cuando te marca una compra te marca un punto verde , acompañando con lineas azul que te marca la tendencia en venta , y la linea aqua que te marca la tendencia en compra , sirve para todas las temporalidades , sirve para los mercados de forex y indices sinteticos ! Buen Profit ! World Inversor.

Range Move Es un indicador que te muestra clara mente los soportes resistencias y lineas de tendencia , a cada vela que va corriendo , dicho cambiando , las lineas van cambiando acomodando la tendencia para tener una mejor entrada ! el indicador sirve para los mercados de forex para los mercados de indices sinteticos ! y para crypto tambien ! se usa en todas las temporalidades ! Buen profit ! World Inversor.

Channel Oscillador es un indicador oscillador , que va de estrategia marcando los puntos altos , y los puntos bajos , donde va acompañado de una banda que marca esos puntos , donde te marca con señal de un bloque en la banda de arriba cuando es venta, y te marca con un bloque en la banda bajista cuando es compra . sirve para los mercados de forex y indices sinteticos tambien sirve para los mercados de crypto ideal para hacer scalping , Buen Profit World Inversor.

The Double Stochastic RSI Indicator is a momentum indicator which is based on the Stochastic Oscillator and the Relative Strength Index (RSI). It is used help traders identify overbought and oversold markets as well as its potential reversal signals. This indicator is an oscillator type of technical indicator which plots a line that oscillates within the range of zero to 100. It also has markers at levels 20 and 80 represented by a dashed line. The area below 20 represents the oversold area, wh

Macd Divergense ! es un indicador macd donde va con indicador de divergencia y flechas que marcan la venta y compra del par ! es muy facil de usar y a simple viste se ve que no ay que hacer mucho analisis ya que la divergencia la marca en la vela tambien ! se puede usar en todas las temporalidades ! sirve para hacer scalping ! sirve para los mercados de forex para los mercados de indices sinteticos y crypto tambien ! Buen Profit ! World Inversor.

Filling es un indicador oscillador , donde te marca venta y compra claramente , lleva dos colores el rojo y el azul , el rojo te marca compra , y el azul te marca venta , ideal para hacer scalping y largos ! sirve para los mercados de forex sirve para los mercados de indices sinteticos ideal para los volatilitys y jumps ! tambien sirve para crash y boom ! anda en todas las temporalidades ! Buen Profit ! World Inversor .

Macd Rsi es un indicador macd sumado el rsi para captar entradas perfectas en los cruces de medias ! como se ve en el indicador , tiene 2 lineas una de color gold y la otra linea violet , donde se da el cruze de la violet con la gold hacia abajo es señal de venta cuando cruza la violet hacia arriba de la gold es señal de compra ! muy bueno para hacer cortos sirve para los mercados de forex y indices sinteticos se usa en cualquier temporalidad ! Buen Profit ! World Inversor.

The concept of Harmonic Patterns was established by H.M. Gartley in 1932. Harmonic Patterns create by 4 peak (ABCD) or 5 peak (XABCD). In traditional, we have BAT pattern, Gartley pattern, butterfly pattern, crab pattern, deep crab pattern, shark pattern. Each pattern has its own set of fibonacci. In this indicator, we add more extended pattern named ZUP pattern. So we have total 37 pattern as follow This indicator detects all above patterns, takes fibonacci projections as seriously as you do,

Extreme indicator ! es un oscillador que funciona con niveles de volumen de vela , donde consta de colores rojo y verde , donde mide la venta y compra ! donde tambien viene con un formato de cruces de lineas donde reconfirma la compra o venta en esta ocasion , funciona para los mercados de forex y para los mercados de indices sinteticos ! Funciona para todas las temporalidades ! Buen Profit ! World Inversor .

Rango Color ! es un indicador que indica el volumen de la vela dandote entrada o salida segun el color que toque en la vela ! funciona perfecto para hacer largos de H1 o H4 ! tambien funciona para hacer scalping pero ideal para largos ! funciona en cualquier temporalidad funciona para los mercados de forex para los mercados de indices sinteticos ! tambien para crypto . Buen Profit ! World Inversor.

Extrend ! es un indicador oscilador , Donde mide las tendencias alcistas y bajistas ideal para hacer scalping y largos ! la estrategia consta de el cruce de lineas , donde lleva 2 tipos de lineas , una azul y una verde ! donde la linea azul da el cruce por arriba de la verde da señal de entrada , donde la linea verde cruza por abajo la linea azul da señal de venta ! Sirve para todas las temporalidades ! Buen Profit ! World Inversor .

Linea Swing ! es un indicador que capta facil mente un canal de tendencia sea alcista o bajista ! pudiendo cazar facilmente los rebotes , de long y short , tanto como rebote soporte y resistencia del canal ! el indicador esta apto para cualquier temporalidad ! muy bueno para hacer scalping y largos ! sirve para los mercados de forex y indices sinteticos tambien crypto ! Buen Profit World Inversor ,

Trend Line ! indicador de linea tendencial , soporte y resistencia , ideal para cazar largos y cortos ! donde recurre a 2 lineas , la roja y la azul , la roja te marca rebotes para ventas , la azul te marca rebotes para compra y no solo eso si no que tambien te marca , la tendencia alcista y bajista . sirve para cualquier temporalidad , sirve para los mercados de forex y indices sinteticos ! tambien crypto . Buen Profit ! World Inversor .

Volumen estelar . es un oscilador , que indica los rangos altos y los rangos bajos . marcando en el oscilador el techo y piso de cada tendencia , donde la linea violeta cruza la linea gris da entrada de compra , donde la linea violeta cruza hacia abajo la linea roja da señal de venta, muy facil de usar y muy sencillo , sirve para los mercados de forex y indices sinteticos ! y para cualquier temporalidad para operar . Buen Profit ! World Inversor .

Ma Distance Parabolic ! es un indicador moving average con parabolic sar ! ideal para cazar tendencia donde ay dos puntos ideales que muestra entrada son 2 puntos donde son puntos azules que marca el alza y el otro punto verde donde marca la baja el indicador te da la señal de entrada cuando da el segundo punto se toma la posicion . apto para forex y indices sinteticos , tambien crypto ! Buen Profit ! World Inversor .

Zigzag Oscillador . es un indicador programado para cazar cada punto del zigzag de la vela ! como en primer plano de zigzag este oscilador lo lleva a simples medidas , para captar cada rebote del piso al techo ! ideal para hacer scalping y intradiario . sirve para cualquier temporalidad ! para todos los pares de forex ! para todos los pares de indices sinteticos ideal para los volatility 75 y demas jumps ! Buen Profit ! World Inversor .

Oscillador Moving ! es un oscillador donde tiene 3 puntos de entrada donde tiene la linea naranja , la linea roja y la linea azul , donde la linea naranja toca el techo de la linea azul da señal de entrada en compra . donde la linea roja cruza la linea azul da señal de venta ! muy claro de ver y muy simple de usar ! se puede usar en cualquier temporalidad ! se puede usar en los mercados de Forex . En los mercados de indices sinteticos y crypto ! Buen Profit World Inversor .

High Low Expert ! es un indicador donde marca los high y lows en corto y largo plazo funciona como demand and suply y soporte y resistencia tambien ideal para hacer scalp en M1 , tambien funciona para largos en H1 o H4 ! funciona para todas las temporalidades , funciona para los mercados de forex y para los mercados de indices sinteticos ! ideal para los pares de volatilitys y jumps tambien va en crypto ! Buen Profit World Inversor.

Bear Bull ! es un indicador que marca con velas heikin ashi pero modificado , las ventas y compras a largas y cortas tendencia ! con 2 colores verde marca la compra , violeta marca la venta , sirve para cualquier tipo de temporalidad , sirve para los mercados de forex y indices sinteticos ! ideal para cualquier par , tambien sirve para los pares de crypto , Buen Profit ! World Inversor -

The DR IDR Range Indicator PRO plots ADR, ODR and RDR ranges for a given amount of days in the past. A key feature that appears is that it calculates the success rate of the ranges for the shown days. This indicator is perfect for backtest since it shows ranges for all of the calculated days, not just the most recent sessions. In the PRO version you can now: use fully customizable advanced statistics to base your trades on get an edge via calculating statistics on up to 3 different day period
Este Indicador esta basado en el rebote de un soporte o resistencia fuerte con un indicador que tiene interno de fuerza de movimiento. Tiene la opción de ver el soporte y resistencia actual y ver la fuerza que tiene dicho soporte o resistencia.(Activando el parámetro Ver_Sop_Res ) Parámetros: Sop o Res, Fuerza Mayor a...: Con este parámetro podrás ajustar la fuerza del soporte o resistencia, con la cual el indicador evaluara si es una señal bajista o alcista. Velas Historial: Con este parámetro

Recommended broker to use the indicator: https://tinyurl.com/5ftaha7c Indicator developed by Diogo Sawitzki Cansi to show possible trade points. Do not repaint. The results displayed in the past are exactly what happened. We also use it to hold trades longer and not get out on false reversal signals which are actually just a profit taking of trades and no one is trying to reverse the direction of the trend. Indicator Parameters: PERIOD: Period for analyzing the buying or selling force to fin
FREE

Unlock the power of the market with the Investment Castle Multi Time Frame Moving Average Indicator. Simplify your trading journey by easily identifying trends and pullbacks across multiple time frames on one convenient chart. This indicator is a must-have tool for any serious trader. Available for MT4 and MT5, and exclusively on the MQL5 market, customize your experience by adding as many indicators as you need on the chart, each with their own unique time frame or period. Enhance your strat

The Rubdfx swing indicator is a useful tool for traders looking to identify trend changes in a particular instrument they are trading. It is designed to draw a line on the main chart, and the signals are indicated by color changes with signal alerts. The color green is used to indicate a bullish trend, while the color pink is used to indicate a bearish trend. These colors can be customized to fit the trader's preferences or theme. The Rubdfx swing indicator has the ability to spot both long-te

The rubdfx divergence indicator is a technical analysis tool that compares a security's price movement. It is used to identify potential changes in the price trend of a security. The indicator can be applied to any type of chart, including bar charts and candlestick charts.
The algorithm is based on MACD, which has been modified to detect multiple positive and negative divergences. Settings
___settings___ * fastEMA * slowEMA * signalSMA *Alerts: True/False
#Indicator Usage
B

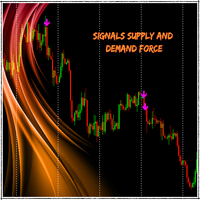
Think of an indicator that instantly shows you all supports, resistances and turncoats and can send a notification to your phone or an alarm on your computer. In addition to all these, it groups how many times it has entered each field and, accordingly, the strength of the field. Supply Demand And Turncoat is at your service. Setup for any TimeFrame and Chart you want and enjoy easy trading. Features: Ability to select the fields to be shown (weak, untested, turncoat, verified, proven) Merge fie
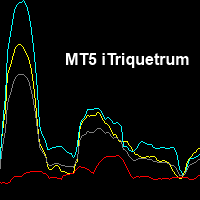
Индикатор показывает отклонения корреляции трех валютных пар, после резкой волатильности пар возвращает их к состоянию сбалансированости Выбор периода отклонения даст возможность наблюдать за более длительными отклонениями Цветные линии хорошо помогают распознать на какой валютной паре произошло отклонение цены, можно наблюдать как резко уходят цены по всем парам, и возвращаются к своему среднему значению
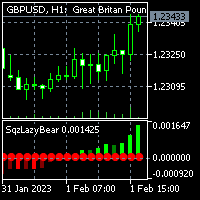
For MT4 version please click here . - This is the exact conversion from TradingView source: "Squeeze Momentum Indicator" By "LazyBear". - This is a non-repaint and light processing load indicator. - Buffers and inputs are available for use in EAs and optimization purposes. - You can message in private chat for further changes you need.
Thanks for downloading...

UR Vortex MT5
The Probabilistic UR Vortex Formula: An Accurate System for Predictive Market Analysis using Volatility and Standard Deviation Calculations. The UR Vortex MT5 indicator is a technical analysis tool that uses volatility and standard deviation calculations to predict potential tops and bottoms in a market. It measures the strength of a trend by calculating the distance between the current price and a moving average, and then standardizing this distance by dividing it by the average

¡Los 11 indicadores se apagan y encienden rápidamente!
Conjunto de indicadores:
2 indicadores "TENDENCIA" :
- rápido = línea 4 colores - lento = puntos 4 colores
El color de los indicadores depende de la dirección de la tendencia y del indicador RSI: 1) tendencia alcista y RSI <50% 2) tendencia alcista y RSI>50%
3) tendencia bajista RSI <50%
4) tendencia bajista RSI > 50% Establezca períodos de indicador para cada período de tiempo: M5 M10 M15 M30 H1 H2 H4 H6 H12 D1 W1 MN
No i

Las zonas de no repintado son un indicador de base de tiempo que busca una posible reversión del mercado para una entrada perfecta. Lea la historia y dibuje la zona posible para nuestra comodidad. El indicador posee cuatro zonas diferentes que lee la historia del mercado sobre 10,000 barras anteriores y predice el posible punto de entrada.
Vuelve a escanear en cada cambio de tendencia del mercado para darnos la zona posible, se usa para operar en todo tipo de mercado y no para repintar.
El i
FREE

** All Symbols x All Timeframes scan just by pressing scanner button ** *** Contact me after the purchase to send you instructions and add you in "M W Scanner group" for sharing or seeing experiences with other users. Introduction: Double Top(M) and Double Bottom(W) is a very repetitive common type of price reversal patterns. Double Top resembles M pattern and indicates bearish reversal whereas Double Bottom resembles W pattern and indicates a bullish reversal that they have high win r
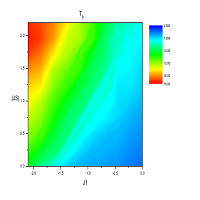
Se puede aplicar a cualquier activo financiero: divisas, criptomonedas, metales preciosos, acciones, índices. Proporcionar puntos de negociación precisos para decirle el mejor momento para abrir y cerrar posiciones. Común para expertos y principiantes La Guía de usuario paso a paso utiliza ejemplos especiales para ilustrar cómo operar el indicador, incluso si lo usa por primera vez. El indicador tiene en cuenta valores de tres dimensiones: tiempo, precio y media cuadrada Está prohibido volver a

FRB Aggression Balance - Indicator shows the Agression Balance of the TIMEFRAMES chosen by the user through a histogram in a new window. - This indicator can only be used if the broker provides data on Volumes. Forex market brokers do not report this data. - B3 (Bovespa - Brazil) informs the data and with that it is possible to use it in Brazilian brokerages.
Settings Color - Define the color that will be shown in the histogram. Use Historical Data - Defines whether the indicator will calcu
FREE

Day Points
Indicadtor that shows the points considered important for X days. (Open,Close, High, Low) Used a lot by those who do day trade. These points can be used for decision making by a trader. You will choose the amount of days ago for it to show.
Settings High/Low/Close/Open Show - True/False. Days - Number of days that will show on the chart. Color - Line Color. Style - Line Style.
FREE

FRB Trader - Our mission is to provide the best support for our clients through content and tools, so they can achieve their expected result. - If you have any questions or suggestions, please contact us. Your feedback is very important to us.
FRB Buy Agression
The indicator displays the Buy Aggression Balance of the selected TIMEFRAME through a histogram in a new window. This indicator can only be used if the broker provides data on volumes. In the forex market, most brokers do not provide
FREE

FRB Sell Agression - Indicator shows the Sell Agression Balance of the TIMEFRAMES chosen by the user through a histogram in a new window. - This indicator can only be used if the broker provides data on Volumes. Forex market brokers do not report this data. - B3 (Bovespa - Brazil) informs the data and with that it is possible to use it in Brazilian brokerages.
Settings Color - Define the color that will be shown in the histogram. Use Historical Data - Defines whether the indicator will calc
FREE

This indicator can be considered as a trading system. It offers a different view to see the currency pair: full timeless indicator, can be used for manual trading or for automatized trading with some expert advisor. When the price reaches a threshold a new block is created according to the set mode. The indicator beside the Renko bars, shows also 3 moving averages.
Features renko mode median renko custom median renko 3 moving averages wicks datetime indicator for each block custom notificatio
FREE

This indicator can be considered as a trading system. It offers a different view to see the currency pair: full timeless indicator, can be used for manual trading or for automatized trading with some expert advisor. When the price reaches a threshold a new block is created according to the set mode. The indicator beside the Renko bars, shows also 3 moving averages.
Features renko mode median renko custom median renko 3 moving averages wicks datetime indicator for each block custom notificatio
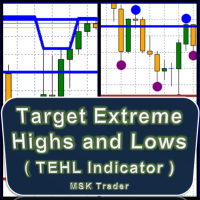
TEHL Indicator is an automatic indicator designed and optimized to highlight the highest highs and the lowest lows in several convenient ways. Using deep calculations, it spots the extreme highs and lows automatically, and facilitates to you defining the resistance and support levels. The indicator has several options for changing marking icon, drawing style, bars range (period) and more as will be detailed below. This indicator does very well along normal and consolidation (aggressive) zones.

The Supertrend etradro indicator is volatility based and is more of a trend following indicator in function. The ATR indicator, which is integrated into the calculation of the super trend, also calculates course gaps (gaps) and does not overlook them. This allows more accurate values to be calculated. When measuring volatility, the mean value of the current price serves as the basis. Since the Supertrend indicator features sliding stop and reversal lines, it is quite similar in function to the P
FREE

AC Pivot Panel
AC Pivot Panel is a pivot point indicator including favorite selection panel accessible in the chart. For pivot traders, It is well convenient to easily and quickly can adjust their pivots setting in the chart. To reaching this goal, a panel has been considered to user can easily switch to each pivot levels by different method and time period. In the current version: All pivots including supports and resistance can be selected to display or disappear in the chart just by
FREE

[ MT4 Version ] [ Kill Zones ] [ SMT Divergences ] How to trade using Order Blocks: Click here Experience the ultimate in trading precision with the Order Blocks ICT indicator, designed to empower traders with unparalleled insights into market dynamics. This advanced tool leverages order flow and volume analysis to reveal crucial buying and selling pressures driving price action. Why Choose Order Blocks ICT? Unleash Market Insights: Order Flow Analysis: Discern buying and selling pressure
Premium Signal es un oscilador que marca claramente cuando se agota la tendencia y esta por arrancar la nueva lleva 1 linea green que va marcando donde esta llendo el precio y 2 barras 1 de color azul y la otra de color coral la de color azul muestra la fuerza de la vela de subida y el color coral muestra la fuerza de la vela de bajada . se usa en los mercados de forex y en los mercados de indices sinteticos ideal para cualqier temporalidad !

MA Project es un indicador con un conjunto de medias moviles programado en arcoiris donde en 1 cruze te marca tendencia larga para agarrar , es ideal para hacer largos en h1 o h4 ! sirve para los mercados de Forex sirve para los mercados de indices sinteticos tambien funciona muy bien en los volatilitys jumps ! de adapta a cualqier temporalidad ! pero esta programada para hacer largos y agarrar tendencias ! Buen Profit !

Crossing Signal , Es un indicador programado para cazar tendencias y cortos , esta programado tambien para cazar soportes y resistencias , donde da tambien señal sniper con circulo verde y rojo , para la venta o para la compra , da señales con flechas amarillas para la venta , da señales con flechas aqua para la compra ! funciona muy bien para los mercados de forex y indices sinteticos ! se adapta a cualquier temporalidad !

Volatility Premium ! es un oscillador que sirve para cazar la fuerza de la vela y agarrar sniper la tendencia el oscillador te muestra niveles de altura donde capta la fuerza de la vela acompañando la tendencia se ve claramente ! sirve para los mercados de forex sirve para los mercados de indices sinteticos se adapta a todos los pares y a todas las temporalidades ! Buen Profit !

Rsi Project es un Rsi programado para hacer scalping en m1 , m5 y m15 , ideal para cazar revotes y a simple vista el rsi te marca los picotazos en los techos y pisos para agarrar esas velas ! sirve tambien para hacer a largas temporalidades ! Sirve para los mercados de forex sirve para los mercados de indices sinteticos se adapta a todos los pares ideal para los volatilitys y jumps ! Buen profit !

Trend Volatil Es un indicador programado para cazar romputas de indices , viene con 2 colores de ropturas , el primero es el Blue que caza la roptura hacia el ALZA el segundo es el color LightBlue que caza la roptura hacia la BAJA . es muy facil de usar y muy completo , se adapta a los mercados de Forex a los mercados de indices sinteticos ! Se usa en caalquier temporalidad ! Se puede hacer scalping y largos ! Buen Profit !

Drop Volatil , es un indicador donde te marca entradas perfectas con la linea de color tomato , donde ay una linea de bajo de esa que te marca el SL Stop loss , y una linea por arriba que te marca TP Take Profit , es linea es color Blue , donde te marca entrada , tp y sl muy facil de usar ! se usa en los mercados de forex y indices sinteticos todos los pares estan aptos ! se usa en todas las temporalidades tambien ! Facil para hacer scalp o largos Buen Profit !

BB Premium , es una nueva tecnica de bandas de bollinger , pero esta es la 2,0 donde te marca rebotes de venta , rebotes de compra , y ropturas , donde en el medio toca la linea dorada , y muestra señal de venta marca la mancha roja como que ay tendencia bajista , donde rebota en el piso que se sale de la banda , marca señal de compra y marca la mancha gris muy facil de usar y facil para cazar scalp o tendencias largas apta para todas las temporalidades y los mercados de Forex y indices si

Price Channel ! Es un indicador Programado para captar entradas de piso y ventas de techo ! da multiples entradas segun la temporalidad que lo uses sirve para soporte y resistencia tambien ! FUnciona en cualquier temporalidad , funciona para los mercados de divisas de forex ! para los pares de indices sinteticos ! Ideal para los volatilitys y jumps ! sirve tambien para crash y boom ! Buen Profit , World Inversor.

Range Target ! indicador que te marca las agotadas de fuerza de la vela donde toca piso y agarra tendencia sea alza o baja el indicador cuenta con dos lineas de soporte donde te marca el piso y el techo donde en la misma linea te marca la entrada para alza o baja , las lineas cuentan con colores Gold y Blue la linea gold muestra la compra la linea blue muestra la venta sirve para cualquier temporalidad , sirve para los mercados de forex sirve para los mercados de indices sinteticos ! Bu

MMA Target es un indicador que indica sessiones de medias moviles donde ay cruzes claros que marcan entradas perfectas va en un conjunto de colores de agresivo a pasivo donde el cruze de verde arriba del rojo da entrada en compra donde va el cruze de rojo a verde da entrada en venta , ideal para hacer entradas en largo ! sirve para hacer scalping tambien ! sirve para los mercados de forex sirve para los mercados de indices sinteticos ! Buen Profit , World Inversor .

This powerful tool is designed to help traders identify key reversal patterns in their charts, including the hammer and star bar formations. With this indicator, you can quickly and easily spot these patterns as they form, allowing you to make well-informed trades and potentially increase your profits. The Hammer Start indicator is customizable, allowing you to set your own parameters for identifying patterns and alerts. Whether you're a seasoned trader or just starting out, the Hammer and Star

The ORB The Opening Range Breakout or the OPR 'Open Price Range' MT5 Indicator is a powerful tool designed to enhance your trading experience by automatically tracking market openings range, custom ranges, sessions, and Asian ranges. This dynamic indicator is perfect for price action traders, offering unparalleled precision and accuracy without any manual effort. Key Features: London ORB The Opening Range Breakout : Automatically displays the London open price range. New York ORB The Openin

Stochastic Profesional 3 in 1 ! es un indicador programado para operar profesional mente ! y muy facil de usar , donde te da alertas , te marca las ventas y compras , mandandote las alertas en cualquier temporalidad , donde te reconfirma la entrada con flechas verde y roja para venta y compra , muy efectiva para hacer scalping y largos ! apta para Forex y Indices sinteticos ! Buen Profit ! World Inversor .

MULTI MARKET SPEED INDICATOR FOR MARKET FLOW & PERFORMANCE CATEGORIZING Specially developed for pattern detection and multi market and cross / intermarket research, volatility , and performance research. Measure in real time, speed & performance on multi markets Detect price and time cycles , squeezes, performance, pattern in structure, pattern in price and structure, patterns over different individual markets and how they move together, time and price action and of course upcomin

Arrows Scalp Oscillador que indica la compra y venta , va sumado con flechas que te indican sell y buy , cruces de medias moviles donde indican la roptura para entrar mejor siendo la venta o la compra ! perfecto para hacer scalping ! en los mercados de Forex y indices sinteticos ! Tambien sirve para crypto ! apto para cualquier temporalidad , sirve para hacer largos tambien ! Buen Profit ! World Inversor .

Renko Gold ! indica clara mente los pisos y techos donde va de 4 lineas , la linea de abajo que marca el piso en color verde confirmando con la linea mas fina aclara la entrada en compra , lo mismo es para la venta , la linea de arriba marca el techo y la mas fina de color rojo marca la venta , este indicador sirve para todas las temporalidades ! Para los mercados de Forex y Indices sinteticos ! Tambien sirve para los mercados de crypto ! Buen Profit! World Inversor.

Channel Profesional ! indicador que marca claramente los canales alcistas y bajistas marcando tambien soporte y resistencia ! la linea tiene 3 colores donde el color verde marca compra ! la linea de color azul es de rebote y la linea roja es la que marca el techo osea la venta ! sirve para todas las temporalidades para los mercados de forex y indices sinteticos tambien para los mercados crypto ! Buen Profit World inversor.

Indicador Monte Carlo Simulation Indicador faz uma regressão linear nos preços de fechamento do ativo escolhido e gera uma simulação de Monte Carlo de N preços aleatórios para definir 3 níveis de sobrecompra e 3 níveis de sobrevenda. O primeiro processo é a Regressão Linear dos preços de fechamento do ativo, no qual é regido pela equação: Y = aX + b + R Onde Y é o valor do ativo escolhido, X é o tempo, a é a inclinação da reta, b é a intersecção da reta e R é o resíduo. O resí
FREE

Positions panel
This is a panel for counting current icon holdings. Convenient traders at any time to view the position and profit and loss situation. Perfect for traders who like to hold multiple orders at the same time. Main functions: Position statistics Total profit Average price calculation TP price calculation ST price calculation Positions valume
FREE

MT4 Version Kill Zones
Kill Zones allows you to insert up to 3 time zones in the chart. The visual representation of the Kill Zones in the chart together with an alert and notification system helps you to ignore fake trading setups occurring outside the Kill Zones or specific trading sessions. Using Kill Zones in your trading will help you filter higher probability trading setups. You should select time ranges where the market usually reacts with high volatility. Based on EST time zone, f
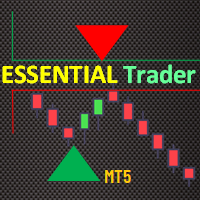
The Essential Trader indicator is more comfortable with whipsaw/ranging market conditions. It is not a complicated trading indicator and can be used on any timeframe with high level of confidence. Besides, it has notifications and alerts. The dotted essential points show spots where you can make immediate entries and benefit from breakout on either side of the region. On the other hand, the color filled points display reversal regions. These are important in that you can trade along the trend

Introduction Poppsir is a trend-range indicator for metatrader 5 (for now), which distinguishes sideways phases from trend phases.
With this tool it is possible to design a trend following-, meanreversion-, as well as a breakout strategy.
This indicator does not repaint!
The signal of the Poppsir indicator is quite easy to determine. As soon as the RSI and Popsir change their respective color to gray, a breakout takes place or in other words, the sideways phase has ended.
Interpret
FREE

To get access to MT4 version please click here . - This is the exact conversion from TradingView: "Stochastic Momentum Index" By "UCSgears". - This is a popular version of stochastic oscillator on tradingview. - This is a light-load processing and non-repaint indicator. - Buffers are available for the lines on chart. - You can message in private chat for further changes you need. Thanks for downloading
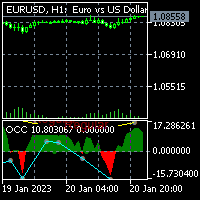
For MT4 version please click here . This is the exact conversion from TradingView: "Open Close Cross Alert R6.2 by JustUncleL" By "JayRogers". - This indicator implements Alerts as well as the visualizations but does not support multi-time frame. - Hidden/Regular divergences supported. - This is a non-repaint and light processing load indicator. - You can message in private chat for further changes you need.
¿Sabe usted por qué MetaTrader Market es el mejor lugar para vender estrategias comerciales e indicadores técnicos? Con nosotros, el desarrollador no tiene que perder tiempo y fuerzas en publicidad, protección del programa y ajustes de cuentas con los compradores. Todo eso ya está hecho.
Está perdiendo oportunidades comerciales:
- Aplicaciones de trading gratuitas
- 8 000+ señales para copiar
- Noticias económicas para analizar los mercados financieros
Registro
Entrada
Si no tiene cuenta de usuario, regístrese
Para iniciar sesión y usar el sitio web MQL5.com es necesario permitir el uso de Сookies.
Por favor, active este ajuste en su navegador, de lo contrario, no podrá iniciar sesión.