Mira cómo encargar de forma rápida un robot comercial
Lea las reglas antes de empezar el trabajo
Cómo encargar un robot comercial en MQL5 y MQL4
Mire el ejemplo de Tarea Técnica para encargar un robot
Nuevas solicitudes en la categoría:
50 - 200 USD
30+ USD
Tarea técnica
Key Features....
.................................
*We need TWO VERSIONS.
1 for Forex Tester 2 (.dll) file
1 for MT4/MQL4 Language (.ex4) file
*No Stop Loss
*Starting lot size .01
*Target/Take Profit(TP) 50 pips
* We want to Draw a GREEN LINE for BUY STOP or, SELL STOP by placing the GREEN LINE Above or Below the Current Price/Candle.... If Placed Above Price, BUY STOP. If Placed Below Price, SELL STOP.
*Takes the Best Trending 2 Pairs, out of 15 Pairs (All 15 Pairs/Charts must be open)
Aud/Usd Aud/Jpy Eur/Usd Eur/Jpy Eur/Gbp Gbp/Usd Gbp/Jpy Cad/Jpy Nzd/Usd Nzd/Jpy Usd/Cad Usd/Chf Usd/Jpy Xau/Usd Xag/Usd
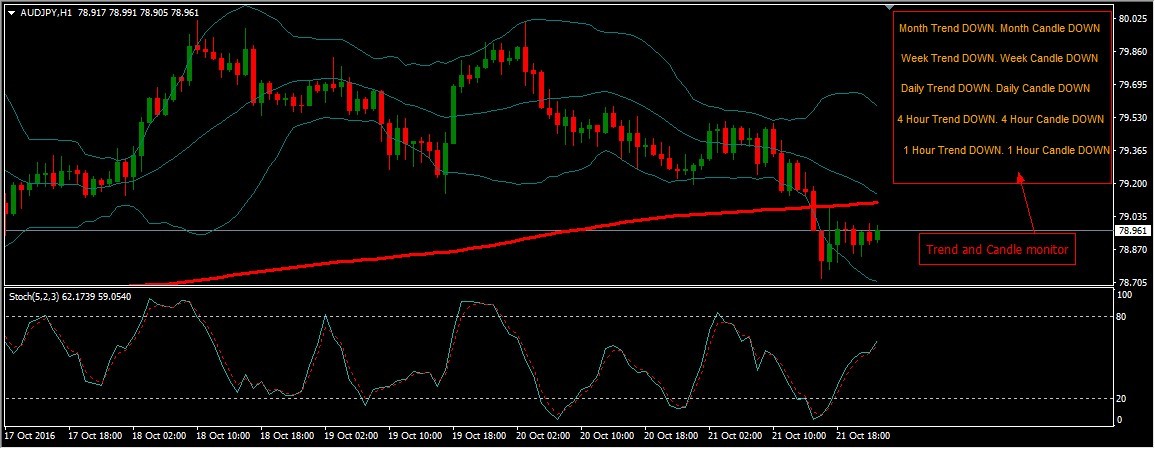
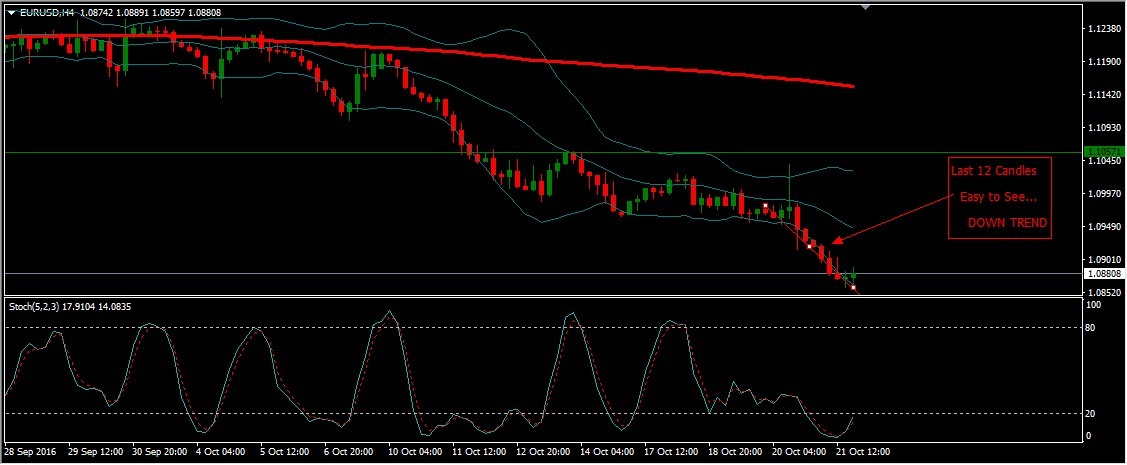
*How does it Calculate the Trend?... Answer: (Counts the last 12 Candles for each TimeFrame)... Is it UP, or DOWN Direction, based on the last 12 Candles, for each Timeframe?
*How does it Calculate which Two Pairs to Choose out of the 15 Pairs?... The Pairs with the Most Green (UPs) or, Red (DOWNs)
*If there is a Tie... Choose the Pair with the Most Pips, according to the last 3, 4 Hour Candles.
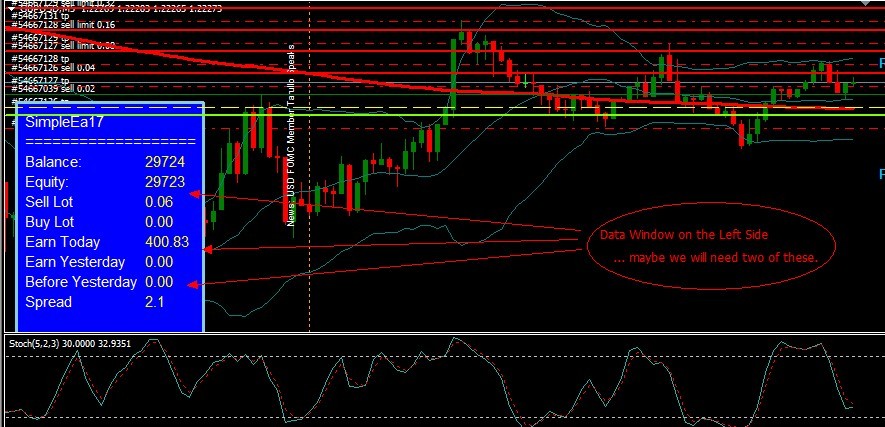
*An Example of the Information we want on the LEFT side of each chart, in 2 Data Window, for All 15 Pairs, that we trade:
AUD/USD
| CANDLES >> H1 (Arrow) H4 (Arrow) D1 (Arrow) W1 (Arrow) MN (Arrow)
| TREND >> H1 (Arrow) H4 (Arrow) D1 (Arrow) W1 (Arrow) MN (Arrow)
AUD/JPY
| CANDLES >> H1 (Arrow) H4 (Arrow) D1 (Arrow) W1 (Arrow) MN (Arrow)
| TREND >> H1 (Arrow) H4 (Arrow) D1 (Arrow) W1 (Arrow) MN (Arrow)
EUR/JPY
| CANDLES >> H1 (Arrow) H4 (Arrow) D1 (Arrow) W1 (Arrow) MN (Arrow)
| TREND >> H1 (Arrow) H4 (Arrow) D1 (Arrow) W1 (Arrow) MN (Arrow)
EUR/USD
| CANDLES >> H1 (Arrow) H4 (Arrow) D1 (Arrow) W1 (Arrow) MN (Arrow)
| TREND >> H1 (Arrow) H4 (Arrow) D1 (Arrow) W1 (Arrow) MN (Arrow)
EUR/GBP
| CANDLES >> H1 (Arrow) H4 (Arrow) D1 (Arrow) W1 (Arrow) MN (Arrow)
| TREND >> H1 (Arrow) H4 (Arrow) D1 (Arrow) W1 (Arrow) MN (Arrow)
GBP/USD
| CANDLES >> H1 (Arrow) H4 (Arrow) D1 (Arrow) W1 (Arrow) MN (Arrow)
| TREND >> H1 (Arrow) H4 (Arrow) D1 (Arrow) W1 (Arrow) MN (Arrow)
GBP/JPY
| CANDLES >> H1 (Arrow) H4 (Arrow) D1 (Arrow) W1 (Arrow) MN (Arrow)
| TREND >> H1 (Arrow) H4 (Arrow) D1 (Arrow) W1 (Arrow) MN (Arrow)
CAD/JPY
| CANDLES >> H1 (Arrow) H4 (Arrow) D1 (Arrow) W1 (Arrow) MN (Arrow)
| TREND >> H1 (Arrow) H4 (Arrow) D1 (Arrow) W1 (Arrow) MN (Arrow)
NZD/USD
| CANDLES >> H1 (Arrow) H4 (Arrow) D1 (Arrow) W1 (Arrow) MN (Arrow)
| TREND >> H1 (Arrow) H4 (Arrow) D1 (Arrow) W1 (Arrow) MN (Arrow)
NZD/JPY
| CANDLES >> H1 (Arrow) H4 (Arrow) D1 (Arrow) W1 (Arrow) MN (Arrow)
| TREND >> H1 (Arrow) H4 (Arrow) D1 (Arrow) W1 (Arrow) MN (Arrow)
USD/CAD
| CANDLES >> H1 (Arrow) H4 (Arrow) D1 (Arrow) W1 (Arrow) MN (Arrow)
| TREND >> H1 (Arrow) H4 (Arrow) D1 (Arrow) W1 (Arrow) MN (Arrow)
USD/CHF
| CANDLES >> H1 (Arrow) H4 (Arrow) D1 (Arrow) W1 (Arrow) MN (Arrow)
| TREND >> H1 (Arrow) H4 (Arrow) D1 (Arrow) W1 (Arrow) MN (Arrow)
USD/JPY
| CANDLES >> H1 (Arrow) H4 (Arrow) D1 (Arrow) W1 (Arrow) MN (Arrow)
| TREND >> H1 (Arrow) H4 (Arrow) D1 (Arrow) W1 (Arrow) MN (Arrow)
XAU/USD
| CANDLES >> H1 (Arrow) H4 (Arrow) D1 (Arrow) W1 (Arrow) MN (Arrow)
| TREND >> H1 (Arrow) H4 (Arrow) D1 (Arrow) W1 (Arrow) MN (Arrow)
XAG/USD
| CANDLES >> H1 (Arrow) H4 (Arrow) D1 (Arrow) W1 (Arrow) MN (Arrow)
| TREND >> H1 (Arrow) H4 (Arrow) D1 (Arrow) W1 (Arrow) MN (Arrow)
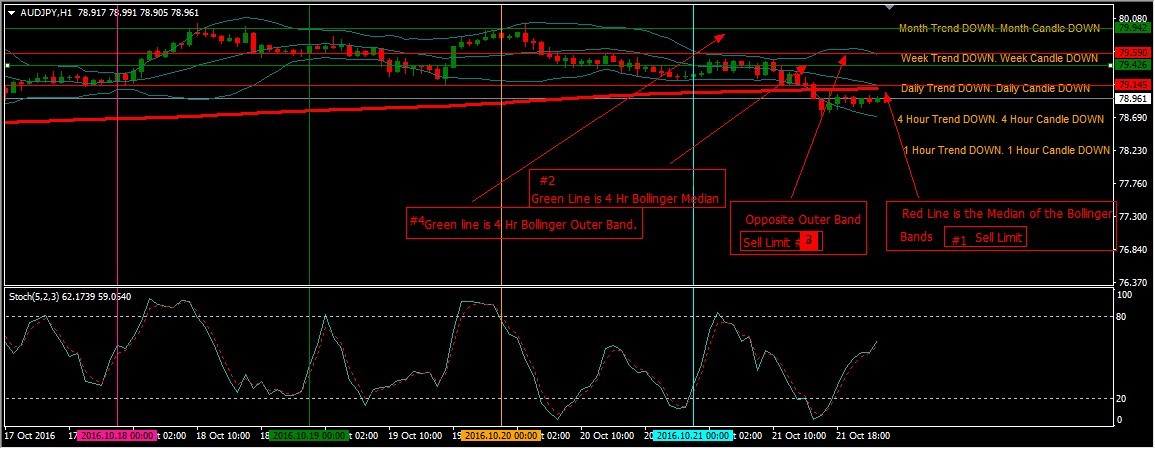
*Gets into more positions when price retraces, at certain points, also known as the Price Pull-Backs. OK First...
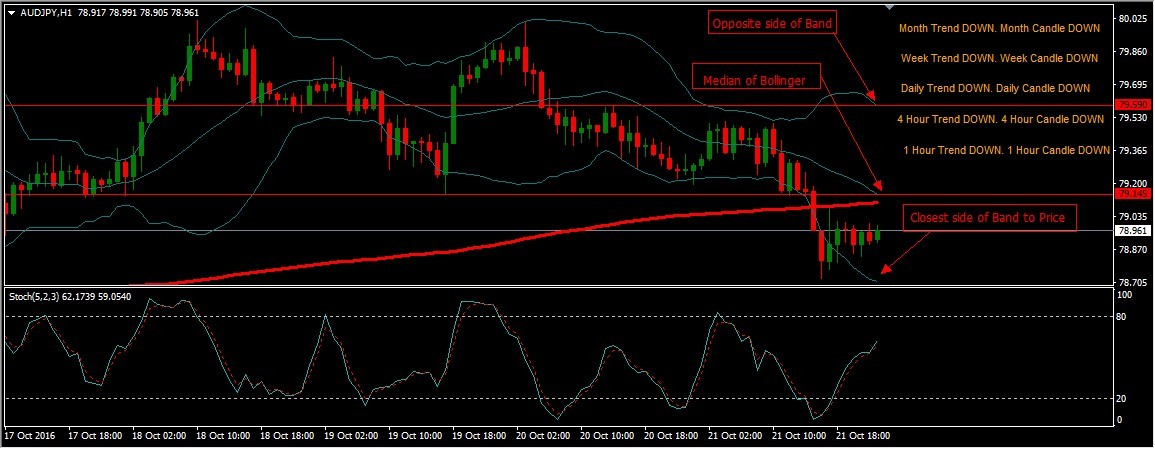
1st Position, is according to trend of the BEST TWO TRENDING CHARTS/PAIRS(Just Gets in once Calculated, going the direction of the Trend... with Option in Settings to get in after first Pull-back). 2nd Position, when it pulls back to the Middle of the Bollinger Median Point.
For Example... [See Attachment]
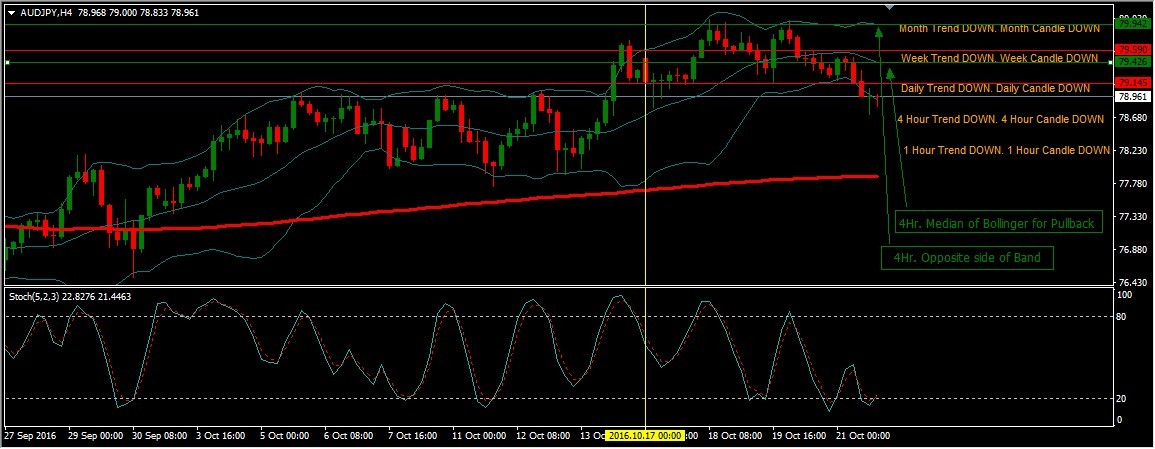
Then, Opposite Side of the Bollinger Band, from where you ENTERED a Position, According to the 1 HR. & 4HR. Charts, Median and Opposite Band(Furthest Band) Points. (We call Pull Backs, High Fives).
For Example... [See Attachment]
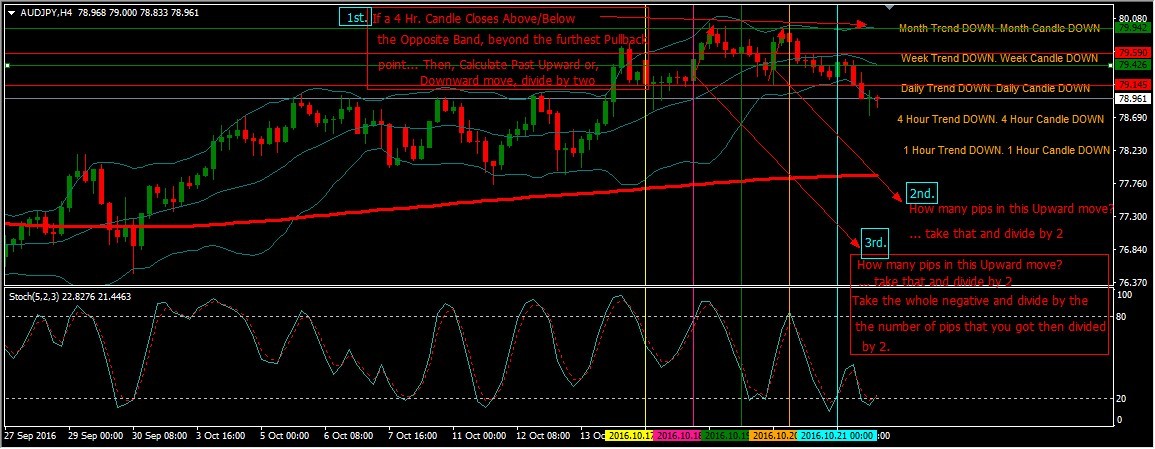
*We Will look to go the Opposite Direction ONLY After.... Price Closes Above or, Below the Opposite Point of Entry, Furthest Pullback Point, with both 1 hour and 4 hour Median ond Opposite Band Points, from where we 'started from/entered from'.
&, we need the EA to calculate how many pips the 4 Hour Candles last Move Upward or Downward was.
For Example... [See Attachment]
Also,
*Calculation Example... 0.01 in 4 negative positions... Lets say those 4 Negative Postions are: -$3.00 + -5.00 + -$8.00 + -$11.00 = -$27+ $50 Profit = $77 Goal.
80pips last Upward move / 2 = 40 pips... So, $77 / 40 = $1.93 a LOT. (.19) or, you can round up to (.20) lot size... Then, if the Price Stops going up and Goes against us again, for some strange reason after another 4 Pullback points, then the opposite way with now be (.20 LOT X 4 positions negative... example -$50, -$100, -$150,- $200) = $-500 + 200 profit = $700... 80 pips last Downward move / 2 = 40 pips... So, $700 Goal /40 pips = 17.5 a LOT (1.75 LOT size) or, you can round up to (1.8 LOT size)
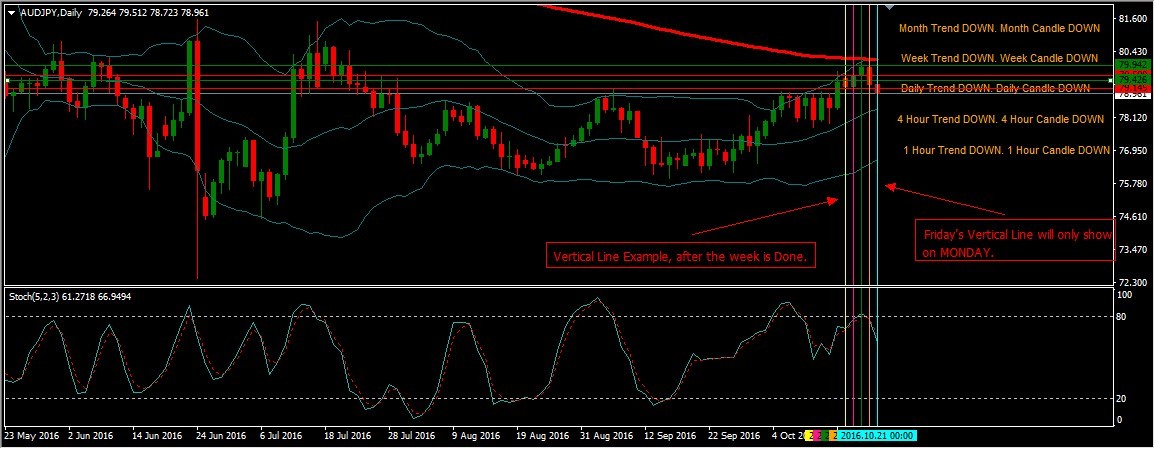
*We want Vertical lines to be drawn for Only the Current Week Only(5 days (M-F) after each day has closed/finished).
We want Monday(Yellow) Tuesday(Pink) Wednesday(Green) Thursday(Gold) Friday(Sky Blue & Friday only showed on Mondays)For Example....
*Horizontal Lines for the Closing and Opening of EACH DAILY CANDLE for the CURRENT WEEK ONLY.
For Example....
*On the Right Side of the Chart, Where it is empty after pushing (button)
We want Every Chart/Pair to Show(the BELOW) on the Right Side of the Chart:
Month Trend DOWN/UP - Month Candle DOWN/UP side note:(8 size font) (DOWN in Red) (UP in Green)
Week Trend DOWN/UP - Week Candle DOWN/UP side note:(8 size font) (DOWN in Red) (UP in Green)
Day Trend DOWN/UP Day - Candle DOWN/UP side note: (8 size font) (DOWN in Red) (UP in Green)
4 Hr. Trend DOWN/UP - 4 Hr. Candle DOWN/UP side note: (8 size font) (DOWN in Red) (UP in Green)
1 Hr. Trend DOWN/UP - 1 Hr. Candle DOWN/UP side note: (8 size font) (DOWN in Red) (UP in Green)
Also, Other Details Underneath like:
2 BEST TRENDING PAIRS/Charts(Currently)
Balance
Equity
Total Sell Lots
Total Buy Lots
Earned Today
Earned Yesterday
Before Yesterday
Spread (in pips, NOT POINTS)
Han respondido
1
Evaluación
Proyectos
201
42%
Arbitraje
44
9%
/
68%
Caducado
47
23%
Libre
2
Evaluación
Proyectos
73
16%
Arbitraje
13
8%
/
92%
Caducado
37
51%
Libre
Solicitudes similares
Hello The EA will work on particular zone choose by the user and can mark it on any TF and with some rules can open trades and mange the trade by some unique rules. the EA need to check the difference by RSI as well and with some extra rules . developer should have good attitude and good communication (englsih) with high performence and knowledge with coding EA. THREE TYPES OF ENTRIES 1: AGGRESSIVE 2: DIVERGENCE 3
Simple NinjaTrader Robot
60+ USD
Indicator in use: Bollinger Bands Mechanism (See diagrams provided for help) Sells: 1. Trigger candle: When candle low is above the top Bollinger band - accurate to the lowest point scale (e.g. On EURUSD if candle low is 1.07915 and the value of top bollinger is 1.07914 - this is a sell signal; or if on Futures if the increment is .25 or .10 then this is used) 2. Enter sell ONLY on the next candle if price breaks
Simple trading robot
80+ USD
Indicator in use: Bollinger Bands Mechanism: (See diagrams provided for help) Sells: 1. Trigger candle: When candle low is above the top Bollinger band - accurate to the point scale (e.g. On EURUSD if candle low is 1.07915 and the value of top bollinger is 1.07914 - this is a sell signal) 2. Enter sell ONLY on the next candle if price breaks below the trigger candle LOW (using the e.g. above- if next candle price
Mt5 web app license system needed
100 - 500 USD
hey guys, im looking for an auto mt5 license system through a web app i have already, i simply want it so a unique license key is generated for memebers, they input this onto the EA input and then it checks if its valid. active license per user capped at 5. i already have an mt5 coder and dec team for the app so i dont know if youd prefer to intergrate onto the webapp yourself or simply provide the code and doc so my
Create a trade assistant
30 - 60 USD
I need a simple panel to execute both buy and sell operations with very basic things like stopp loss take profit that functions for both market orders such as buy stop sell stop buy limit sell limit I don't care about colors or design I just want how you can do it what interests me most are the functions
I want to create an EA that can take bids according to information of a logic I have developed to give indication of a BUY or SELL opportunity. The EA will then be able to activate the BUY at the lowest possible position once the indicator clears it for a BUY and take bid upwards or identify the highest point and clears it for a SELL and take bids downwards. As you can see from example of JULY 2024 data to see how
We are seeking a skilled developer who can convert a Tradingview indicator written in Pinescript to a NinjaTrader indicator written in C#. The goal is to create a profitable trading strategy using this indicator. The successful candidate will have expertise in both Pinescript and C# programming languages, as well as a strong understanding of trading indicators and strategies. The main responsibilities will include
I am seeking an experienced MQL5 developer to create a user-friendly manual Grid Trading Expert Advisor (EA) with the following key features: Dynamic Grid Trading: Adjustable Grid Distance: Traders can manually input grid distance in pips via an intuitive, movable table. Take Profit Management: Fixed TP for the initial positions (e.g., first 5 trades). Stop-Loss (Optional): Traders can choose to use a stop-loss with
I want have the possibility to increase lotsize not alone by Lot-multiplier rather I want add a fix-lot increase for excample for 0,05 lot. I want have this for buy / sell and hedge-buy and hedge sell
Develop EA to track performance metrics of strategies I would like to develop an EA that will track the performance metrics of the strategies I have running on a terminal, If any of the metrics start to under perform then the EA/Indictor should alert me with a pop up alert that specify's the metric that has triggered the alert. The EA should also display the metrics in a dashboard - please see my example screen shot
Información sobre el proyecto
Presupuesto
80 - 100 USD
Para el ejecutor
72
- 90
USD
Plazo límite de ejecución
de 14 a 21 día(s)