Assista a como encomendar um robô de negociação
Leia as Regras antes começar a trabalhar
Como Encomendar um Robô de Negociação em MQL5 e MQL4
Consulte o exemplo de Termos de Referência para solicitar um robô
Novo na categoria:
100 - 200 USD
30 - 100 USD
30 - 40 USD
30+ USD
50+ USD
Termos de Referência
Key Features....
.................................
*We need TWO VERSIONS.
1 for Forex Tester 2 (.dll) file
1 for MT4/MQL4 Language (.ex4) file
*No Stop Loss
*Starting lot size .01
*Target/Take Profit(TP) 50 pips
* We want to Draw a GREEN LINE for BUY STOP or, SELL STOP by placing the GREEN LINE Above or Below the Current Price/Candle.... If Placed Above Price, BUY STOP. If Placed Below Price, SELL STOP.
*Takes the Best Trending 2 Pairs, out of 15 Pairs (All 15 Pairs/Charts must be open)
Aud/Usd Aud/Jpy Eur/Usd Eur/Jpy Eur/Gbp Gbp/Usd Gbp/Jpy Cad/Jpy Nzd/Usd Nzd/Jpy Usd/Cad Usd/Chf Usd/Jpy Xau/Usd Xag/Usd
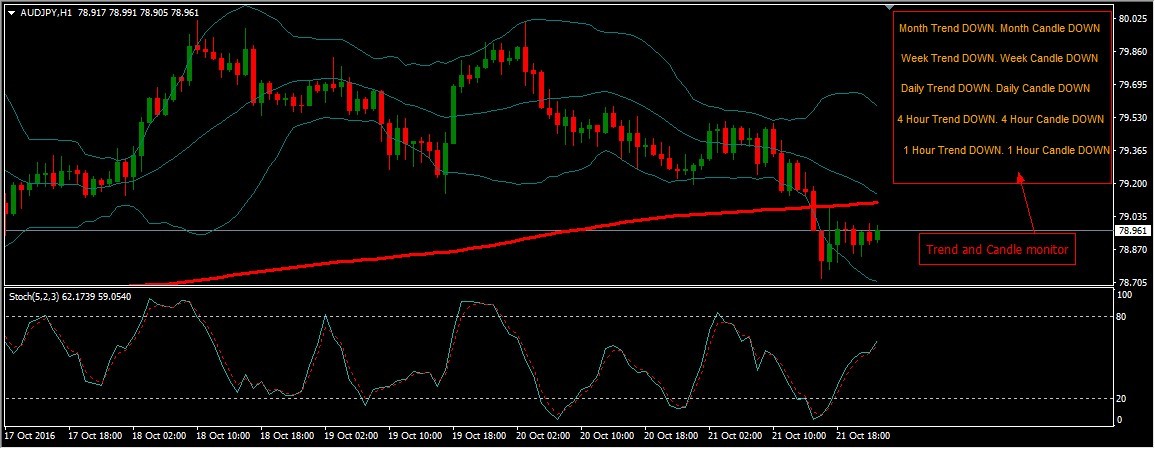
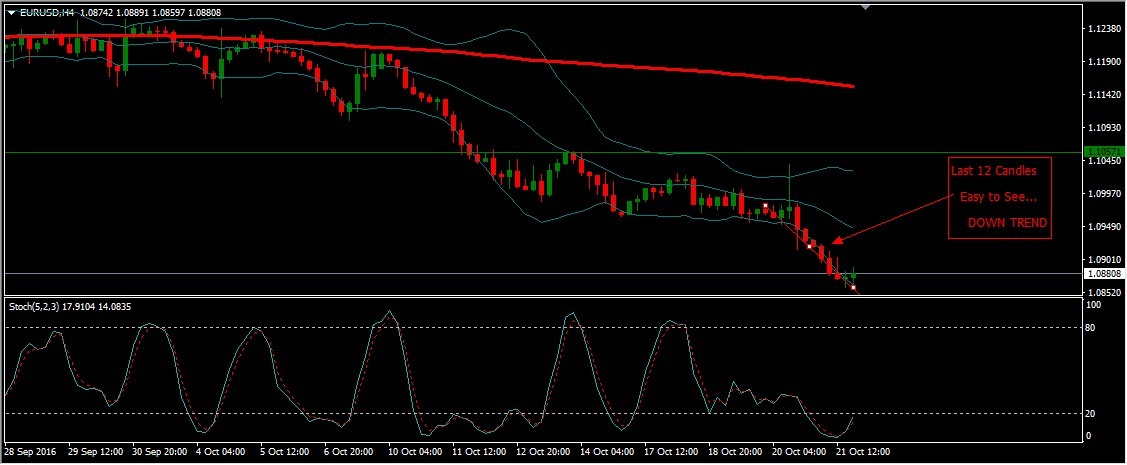
*How does it Calculate the Trend?... Answer: (Counts the last 12 Candles for each TimeFrame)... Is it UP, or DOWN Direction, based on the last 12 Candles, for each Timeframe?
*How does it Calculate which Two Pairs to Choose out of the 15 Pairs?... The Pairs with the Most Green (UPs) or, Red (DOWNs)
*If there is a Tie... Choose the Pair with the Most Pips, according to the last 3, 4 Hour Candles.
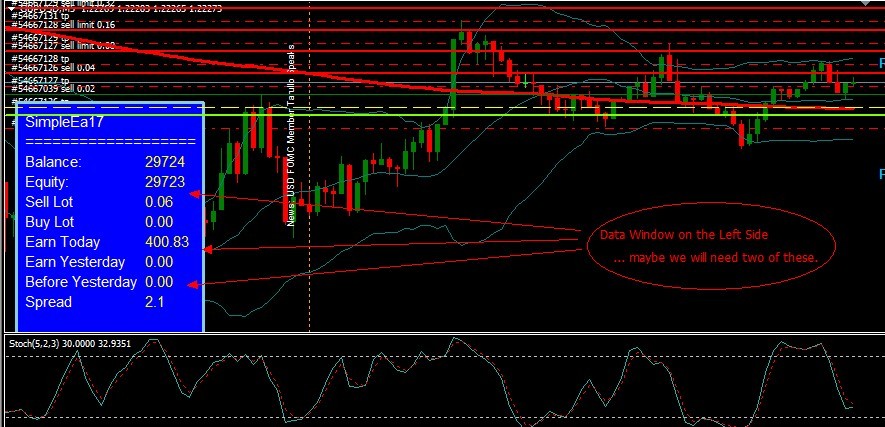
*An Example of the Information we want on the LEFT side of each chart, in 2 Data Window, for All 15 Pairs, that we trade:
AUD/USD
| CANDLES >> H1 (Arrow) H4 (Arrow) D1 (Arrow) W1 (Arrow) MN (Arrow)
| TREND >> H1 (Arrow) H4 (Arrow) D1 (Arrow) W1 (Arrow) MN (Arrow)
AUD/JPY
| CANDLES >> H1 (Arrow) H4 (Arrow) D1 (Arrow) W1 (Arrow) MN (Arrow)
| TREND >> H1 (Arrow) H4 (Arrow) D1 (Arrow) W1 (Arrow) MN (Arrow)
EUR/JPY
| CANDLES >> H1 (Arrow) H4 (Arrow) D1 (Arrow) W1 (Arrow) MN (Arrow)
| TREND >> H1 (Arrow) H4 (Arrow) D1 (Arrow) W1 (Arrow) MN (Arrow)
EUR/USD
| CANDLES >> H1 (Arrow) H4 (Arrow) D1 (Arrow) W1 (Arrow) MN (Arrow)
| TREND >> H1 (Arrow) H4 (Arrow) D1 (Arrow) W1 (Arrow) MN (Arrow)
EUR/GBP
| CANDLES >> H1 (Arrow) H4 (Arrow) D1 (Arrow) W1 (Arrow) MN (Arrow)
| TREND >> H1 (Arrow) H4 (Arrow) D1 (Arrow) W1 (Arrow) MN (Arrow)
GBP/USD
| CANDLES >> H1 (Arrow) H4 (Arrow) D1 (Arrow) W1 (Arrow) MN (Arrow)
| TREND >> H1 (Arrow) H4 (Arrow) D1 (Arrow) W1 (Arrow) MN (Arrow)
GBP/JPY
| CANDLES >> H1 (Arrow) H4 (Arrow) D1 (Arrow) W1 (Arrow) MN (Arrow)
| TREND >> H1 (Arrow) H4 (Arrow) D1 (Arrow) W1 (Arrow) MN (Arrow)
CAD/JPY
| CANDLES >> H1 (Arrow) H4 (Arrow) D1 (Arrow) W1 (Arrow) MN (Arrow)
| TREND >> H1 (Arrow) H4 (Arrow) D1 (Arrow) W1 (Arrow) MN (Arrow)
NZD/USD
| CANDLES >> H1 (Arrow) H4 (Arrow) D1 (Arrow) W1 (Arrow) MN (Arrow)
| TREND >> H1 (Arrow) H4 (Arrow) D1 (Arrow) W1 (Arrow) MN (Arrow)
NZD/JPY
| CANDLES >> H1 (Arrow) H4 (Arrow) D1 (Arrow) W1 (Arrow) MN (Arrow)
| TREND >> H1 (Arrow) H4 (Arrow) D1 (Arrow) W1 (Arrow) MN (Arrow)
USD/CAD
| CANDLES >> H1 (Arrow) H4 (Arrow) D1 (Arrow) W1 (Arrow) MN (Arrow)
| TREND >> H1 (Arrow) H4 (Arrow) D1 (Arrow) W1 (Arrow) MN (Arrow)
USD/CHF
| CANDLES >> H1 (Arrow) H4 (Arrow) D1 (Arrow) W1 (Arrow) MN (Arrow)
| TREND >> H1 (Arrow) H4 (Arrow) D1 (Arrow) W1 (Arrow) MN (Arrow)
USD/JPY
| CANDLES >> H1 (Arrow) H4 (Arrow) D1 (Arrow) W1 (Arrow) MN (Arrow)
| TREND >> H1 (Arrow) H4 (Arrow) D1 (Arrow) W1 (Arrow) MN (Arrow)
XAU/USD
| CANDLES >> H1 (Arrow) H4 (Arrow) D1 (Arrow) W1 (Arrow) MN (Arrow)
| TREND >> H1 (Arrow) H4 (Arrow) D1 (Arrow) W1 (Arrow) MN (Arrow)
XAG/USD
| CANDLES >> H1 (Arrow) H4 (Arrow) D1 (Arrow) W1 (Arrow) MN (Arrow)
| TREND >> H1 (Arrow) H4 (Arrow) D1 (Arrow) W1 (Arrow) MN (Arrow)
*Gets into more positions when price retraces, at certain points, also known as the Price Pull-Backs. OK First...
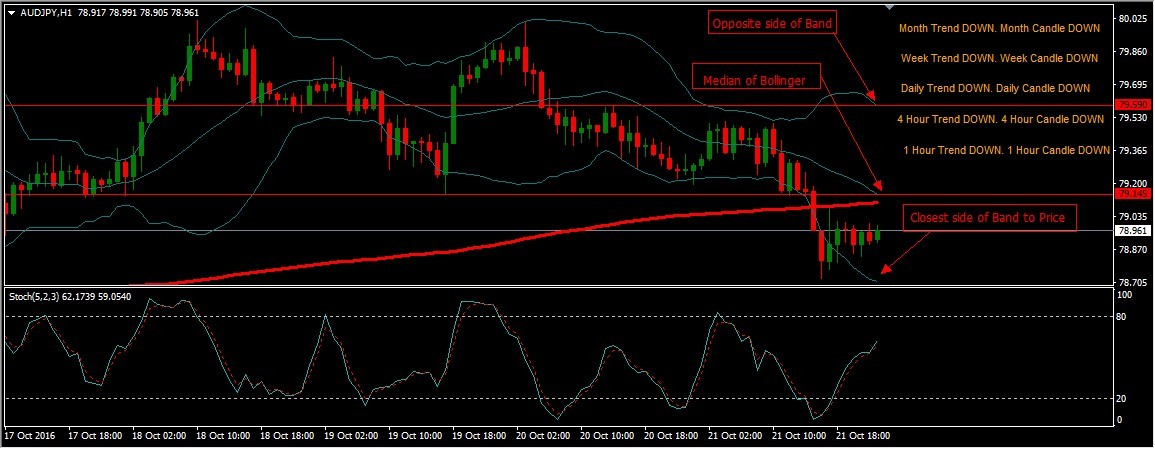
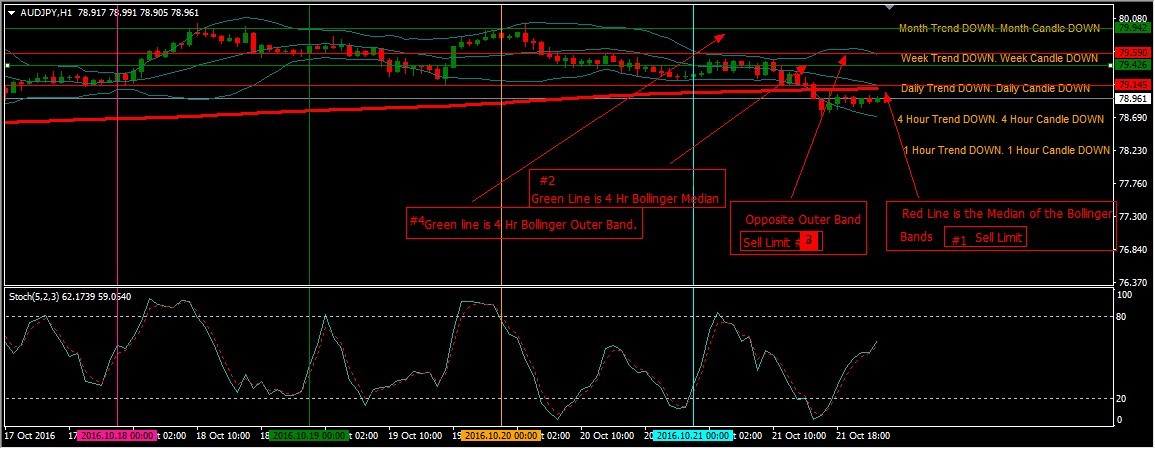
1st Position, is according to trend of the BEST TWO TRENDING CHARTS/PAIRS(Just Gets in once Calculated, going the direction of the Trend... with Option in Settings to get in after first Pull-back). 2nd Position, when it pulls back to the Middle of the Bollinger Median Point.
For Example... [See Attachment]
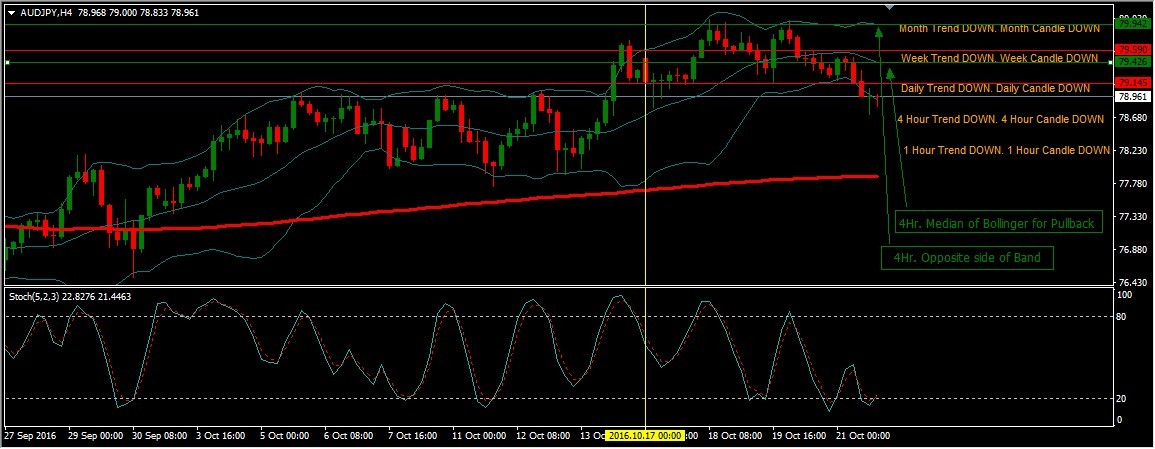
Then, Opposite Side of the Bollinger Band, from where you ENTERED a Position, According to the 1 HR. & 4HR. Charts, Median and Opposite Band(Furthest Band) Points. (We call Pull Backs, High Fives).
For Example... [See Attachment]
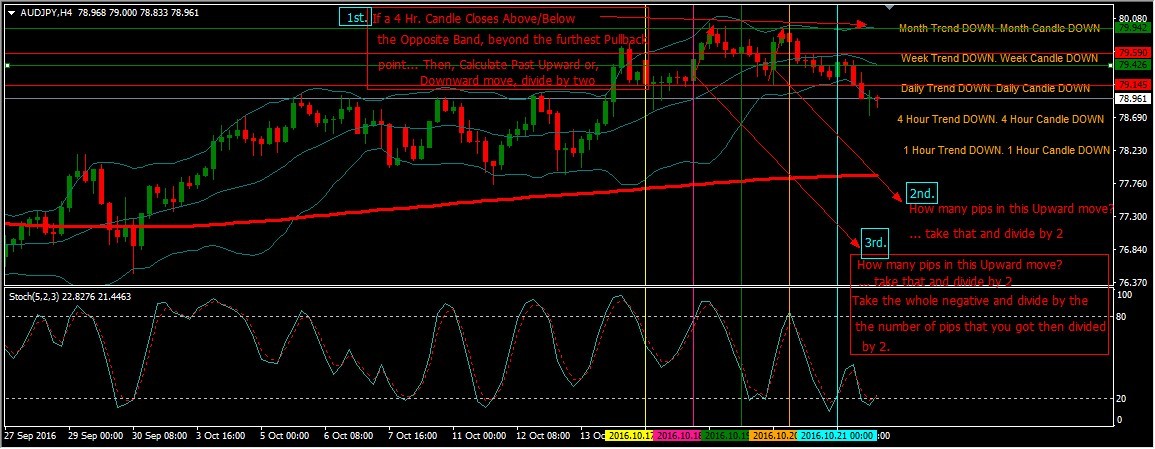
*We Will look to go the Opposite Direction ONLY After.... Price Closes Above or, Below the Opposite Point of Entry, Furthest Pullback Point, with both 1 hour and 4 hour Median ond Opposite Band Points, from where we 'started from/entered from'.
&, we need the EA to calculate how many pips the 4 Hour Candles last Move Upward or Downward was.
For Example... [See Attachment]
Also,
*Calculation Example... 0.01 in 4 negative positions... Lets say those 4 Negative Postions are: -$3.00 + -5.00 + -$8.00 + -$11.00 = -$27+ $50 Profit = $77 Goal.
80pips last Upward move / 2 = 40 pips... So, $77 / 40 = $1.93 a LOT. (.19) or, you can round up to (.20) lot size... Then, if the Price Stops going up and Goes against us again, for some strange reason after another 4 Pullback points, then the opposite way with now be (.20 LOT X 4 positions negative... example -$50, -$100, -$150,- $200) = $-500 + 200 profit = $700... 80 pips last Downward move / 2 = 40 pips... So, $700 Goal /40 pips = 17.5 a LOT (1.75 LOT size) or, you can round up to (1.8 LOT size)
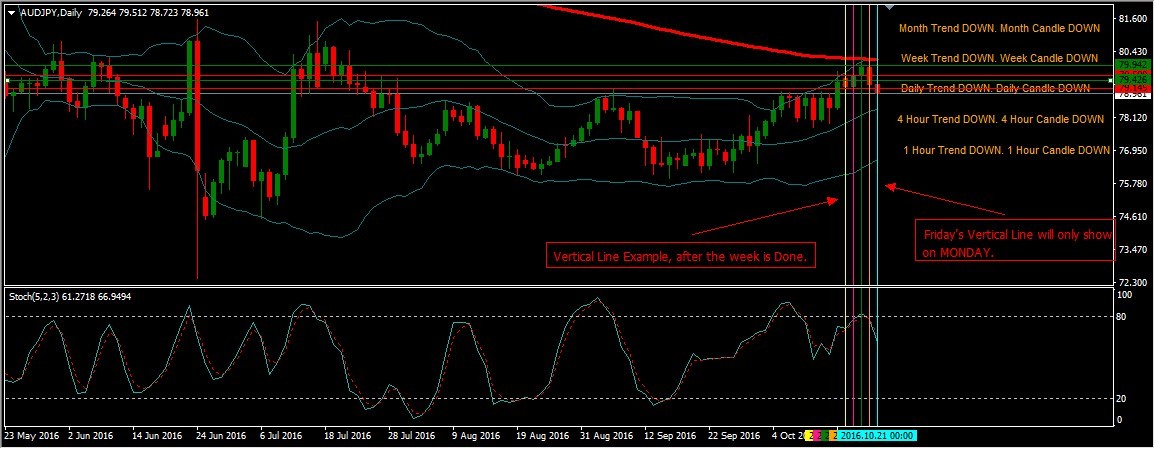
*We want Vertical lines to be drawn for Only the Current Week Only(5 days (M-F) after each day has closed/finished).
We want Monday(Yellow) Tuesday(Pink) Wednesday(Green) Thursday(Gold) Friday(Sky Blue & Friday only showed on Mondays)For Example....
*Horizontal Lines for the Closing and Opening of EACH DAILY CANDLE for the CURRENT WEEK ONLY.
For Example....
*On the Right Side of the Chart, Where it is empty after pushing (button)
We want Every Chart/Pair to Show(the BELOW) on the Right Side of the Chart:
Month Trend DOWN/UP - Month Candle DOWN/UP side note:(8 size font) (DOWN in Red) (UP in Green)
Week Trend DOWN/UP - Week Candle DOWN/UP side note:(8 size font) (DOWN in Red) (UP in Green)
Day Trend DOWN/UP Day - Candle DOWN/UP side note: (8 size font) (DOWN in Red) (UP in Green)
4 Hr. Trend DOWN/UP - 4 Hr. Candle DOWN/UP side note: (8 size font) (DOWN in Red) (UP in Green)
1 Hr. Trend DOWN/UP - 1 Hr. Candle DOWN/UP side note: (8 size font) (DOWN in Red) (UP in Green)
Also, Other Details Underneath like:
2 BEST TRENDING PAIRS/Charts(Currently)
Balance
Equity
Total Sell Lots
Total Buy Lots
Earned Today
Earned Yesterday
Before Yesterday
Spread (in pips, NOT POINTS)
Respondido
1
Classificação
Projetos
201
42%
Arbitragem
44
9%
/
68%
Expirado
47
23%
Livre
2
Classificação
Projetos
73
16%
Arbitragem
13
8%
/
92%
Expirado
37
51%
Livre
Pedidos semelhantes
Create an EA VWAP + RSI for MT5
50 - 100 USD
I need EA that works on MT5 to be able to do the following: - Can recognize Support/Resistance area - Can recognize VWAP direction. - Can recognize RSI. - Can recognize Double Top/bottom, Bullish/Bearish hammer candle, Bullish/bearish engulfing candle. - Ability to set Stoploss below/above support/resistance, but risk must be fixed at a certain price. - Stoploss
Boulē’s Full Margin Trader
30 - 50 USD
I want a program that will help calculate and enter the market on full margin for me. I just need to put in the price for entry, Stop loss and TP then it will calculate the lot sizes for entering the trade on full margin on Mt5
Stochastic Divergence EA
30 - 50 USD
"I need an expert advisor (EA) based on stochastic divergence and candlestick formation. It should be able to identify both hidden and regular divergences. The EA should also include modified risk-reward ratios, modified timeframes, and a trailing stop loss. It is important that the EA is 100% accurate. Once an experienced developer applies, I will share the complete strategy."
I am seeking a highly skilled and experienced developer to assist with an important project. I need a development of an automated trading bot for NinjaTrader, utilizing a 4 SMA (Simple Moving Average) crossing strategy, with additional custom diversions for trade entries. The bot needs to be based on a strategy involving the crossing of four different SMAs. The exact periods for these SMAs and the conditions for
Expert advisor for backtesting historical trade
30 - 70 USD
I need someone that can make expert advisor for backtesting purpose. The input file is History trade report export file from MQl5 the expert advisor should open position the exact time of open trade on the report. The same as the close time
Copier EA triggered via Mobile
30 - 100 USD
So i have copier EA. The idea is the EA will triggered through manual OP by user via mobile or whatever platform. Let's say 0.01 lot to trigger it. After the EA takes master's position, the EA will be standby mode. If the master take more OP, the EA still not take the master's position (OP) until the user input manually once again via mobile for another 0.01 lot. Since this is a MT4 EA, Whenever user want to close
Robot for the day, make money during the week
30 - 100 USD
Hello, send robot models with a solid strategy (to trade forex), I want to use it to make money for the week. It is important that you present me with your profitability graph and a test. I also want to hire him for future jobs
Developer for Automated Trading Bot with 4 SMA Crossover Strategy and NinjaTrader Customizations
30 - 50 USD
I am looking to develop an automated trading bot based on a strategy involving the crossing of four Simple Moving Averages (SMA). The bot should be capable of entering trades based on this strategy. Additionally, I would like to incorporate some custom diversions tailored for NinjaTrader
Create Harmonic patterns advisor
50 - 80 USD
Seeking an experienced MQL5 developer to create a sophisticated Expert Advisor focused on harmonic pattern trading . The EA will be designed to identify and trade based on popular harmonic patterns in the forex market. Entry and Exit Logic: Develop smart entry and exit rules based on pattern completions and price action confirmations. Risk Management: Incorporate adjustable risk-per-trade settings and position sizing
Criação de robo com base em 2 medias móveis
30 - 50 USD
preciso de um robô com duas médias móveis, uma exponencial high e uma exponencial low. preciso também ter a opção de utilizar e todos os tempos gráficos e alterar os parâmetros das médias. entrada de compra será feita quando um candle de alta romper e fechar a cima da média high e fechará a posição quando um candle de baixa romper e fechar a baixo da média low. a venda será feita quando o candle de baixa romper e
Informações sobre o projeto
Orçamento
80 - 100 USD
Desenvolvedor
72
- 90
USD
Prazo
de 14 para 21 dias