Watch how to order a trading robot
Read the Rules before you post an order or execute it
How to Order a Trading Robot in MQL5 and MQL4
See a sample Requirements Specification to order a robot
New orders in the category:
30+ USD
50+ USD
50 - 100 USD
30 - 50 USD
30 - 50 USD
30 - 70 USD
30 - 100 USD
Specification
Key Features....
.................................
*We need TWO VERSIONS.
1 for Forex Tester 2 (.dll) file
1 for MT4/MQL4 Language (.ex4) file
*No Stop Loss
*Starting lot size .01
*Target/Take Profit(TP) 50 pips
* We want to Draw a GREEN LINE for BUY STOP or, SELL STOP by placing the GREEN LINE Above or Below the Current Price/Candle.... If Placed Above Price, BUY STOP. If Placed Below Price, SELL STOP.
*Takes the Best Trending 2 Pairs, out of 15 Pairs (All 15 Pairs/Charts must be open)
Aud/Usd Aud/Jpy Eur/Usd Eur/Jpy Eur/Gbp Gbp/Usd Gbp/Jpy Cad/Jpy Nzd/Usd Nzd/Jpy Usd/Cad Usd/Chf Usd/Jpy Xau/Usd Xag/Usd
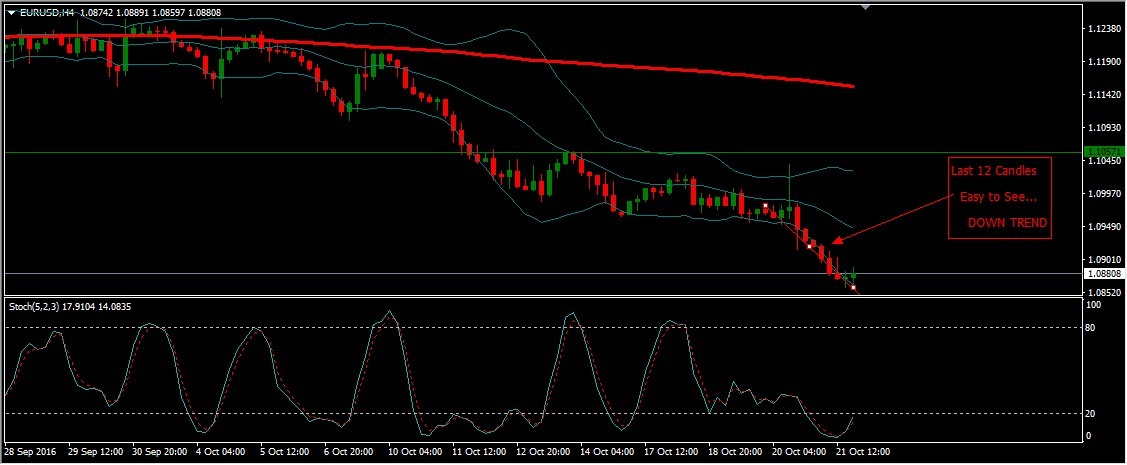
*How does it Calculate the Trend?... Answer: (Counts the last 12 Candles for each TimeFrame)... Is it UP, or DOWN Direction, based on the last 12 Candles, for each Timeframe?
*How does it Calculate which Two Pairs to Choose out of the 15 Pairs?... The Pairs with the Most Green (UPs) or, Red (DOWNs)
*If there is a Tie... Choose the Pair with the Most Pips, according to the last 3, 4 Hour Candles.
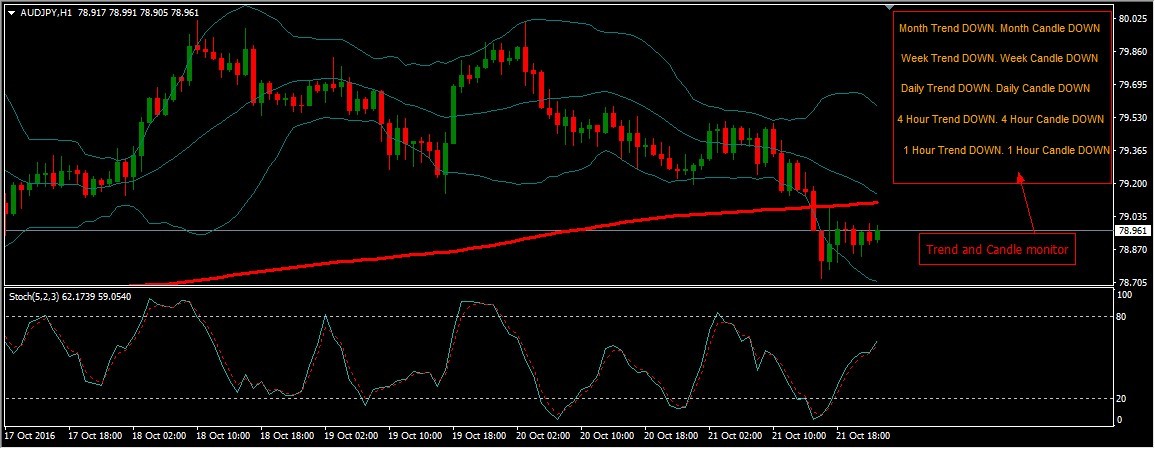
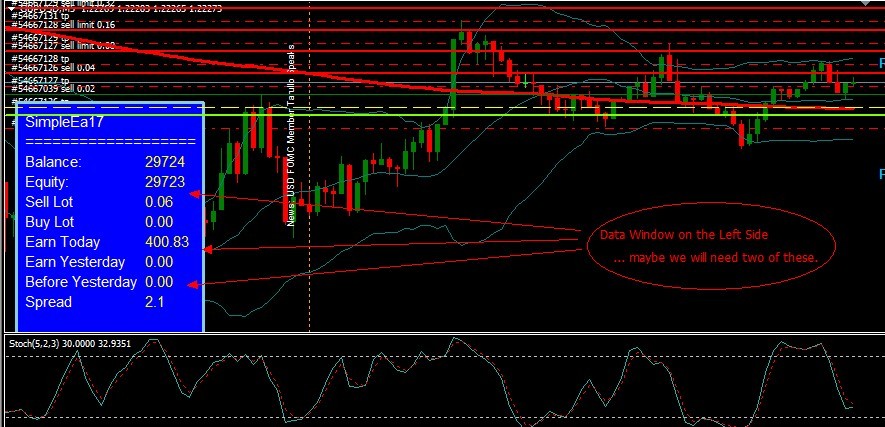
*An Example of the Information we want on the LEFT side of each chart, in 2 Data Window, for All 15 Pairs, that we trade:
AUD/USD
| CANDLES >> H1 (Arrow) H4 (Arrow) D1 (Arrow) W1 (Arrow) MN (Arrow)
| TREND >> H1 (Arrow) H4 (Arrow) D1 (Arrow) W1 (Arrow) MN (Arrow)
AUD/JPY
| CANDLES >> H1 (Arrow) H4 (Arrow) D1 (Arrow) W1 (Arrow) MN (Arrow)
| TREND >> H1 (Arrow) H4 (Arrow) D1 (Arrow) W1 (Arrow) MN (Arrow)
EUR/JPY
| CANDLES >> H1 (Arrow) H4 (Arrow) D1 (Arrow) W1 (Arrow) MN (Arrow)
| TREND >> H1 (Arrow) H4 (Arrow) D1 (Arrow) W1 (Arrow) MN (Arrow)
EUR/USD
| CANDLES >> H1 (Arrow) H4 (Arrow) D1 (Arrow) W1 (Arrow) MN (Arrow)
| TREND >> H1 (Arrow) H4 (Arrow) D1 (Arrow) W1 (Arrow) MN (Arrow)
EUR/GBP
| CANDLES >> H1 (Arrow) H4 (Arrow) D1 (Arrow) W1 (Arrow) MN (Arrow)
| TREND >> H1 (Arrow) H4 (Arrow) D1 (Arrow) W1 (Arrow) MN (Arrow)
GBP/USD
| CANDLES >> H1 (Arrow) H4 (Arrow) D1 (Arrow) W1 (Arrow) MN (Arrow)
| TREND >> H1 (Arrow) H4 (Arrow) D1 (Arrow) W1 (Arrow) MN (Arrow)
GBP/JPY
| CANDLES >> H1 (Arrow) H4 (Arrow) D1 (Arrow) W1 (Arrow) MN (Arrow)
| TREND >> H1 (Arrow) H4 (Arrow) D1 (Arrow) W1 (Arrow) MN (Arrow)
CAD/JPY
| CANDLES >> H1 (Arrow) H4 (Arrow) D1 (Arrow) W1 (Arrow) MN (Arrow)
| TREND >> H1 (Arrow) H4 (Arrow) D1 (Arrow) W1 (Arrow) MN (Arrow)
NZD/USD
| CANDLES >> H1 (Arrow) H4 (Arrow) D1 (Arrow) W1 (Arrow) MN (Arrow)
| TREND >> H1 (Arrow) H4 (Arrow) D1 (Arrow) W1 (Arrow) MN (Arrow)
NZD/JPY
| CANDLES >> H1 (Arrow) H4 (Arrow) D1 (Arrow) W1 (Arrow) MN (Arrow)
| TREND >> H1 (Arrow) H4 (Arrow) D1 (Arrow) W1 (Arrow) MN (Arrow)
USD/CAD
| CANDLES >> H1 (Arrow) H4 (Arrow) D1 (Arrow) W1 (Arrow) MN (Arrow)
| TREND >> H1 (Arrow) H4 (Arrow) D1 (Arrow) W1 (Arrow) MN (Arrow)
USD/CHF
| CANDLES >> H1 (Arrow) H4 (Arrow) D1 (Arrow) W1 (Arrow) MN (Arrow)
| TREND >> H1 (Arrow) H4 (Arrow) D1 (Arrow) W1 (Arrow) MN (Arrow)
USD/JPY
| CANDLES >> H1 (Arrow) H4 (Arrow) D1 (Arrow) W1 (Arrow) MN (Arrow)
| TREND >> H1 (Arrow) H4 (Arrow) D1 (Arrow) W1 (Arrow) MN (Arrow)
XAU/USD
| CANDLES >> H1 (Arrow) H4 (Arrow) D1 (Arrow) W1 (Arrow) MN (Arrow)
| TREND >> H1 (Arrow) H4 (Arrow) D1 (Arrow) W1 (Arrow) MN (Arrow)
XAG/USD
| CANDLES >> H1 (Arrow) H4 (Arrow) D1 (Arrow) W1 (Arrow) MN (Arrow)
| TREND >> H1 (Arrow) H4 (Arrow) D1 (Arrow) W1 (Arrow) MN (Arrow)
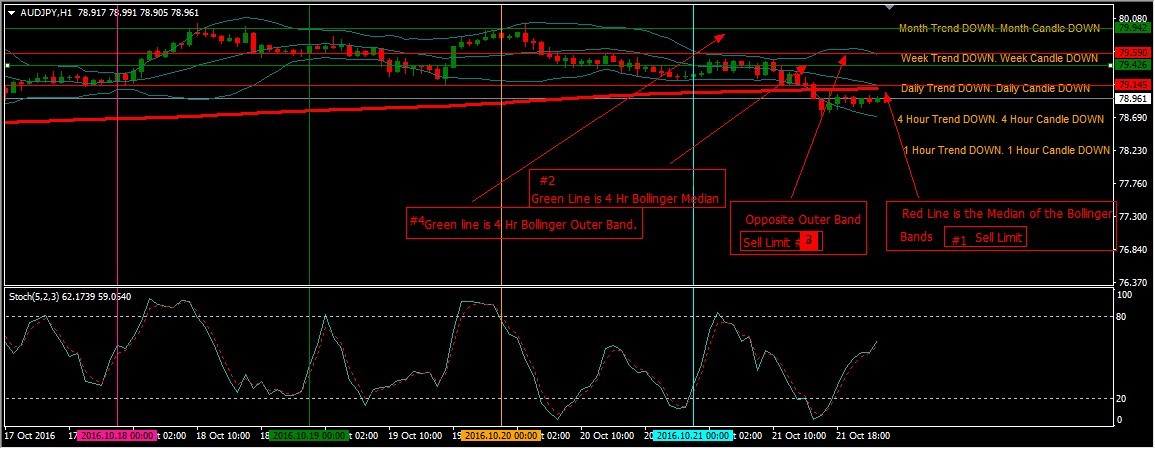
*Gets into more positions when price retraces, at certain points, also known as the Price Pull-Backs. OK First...
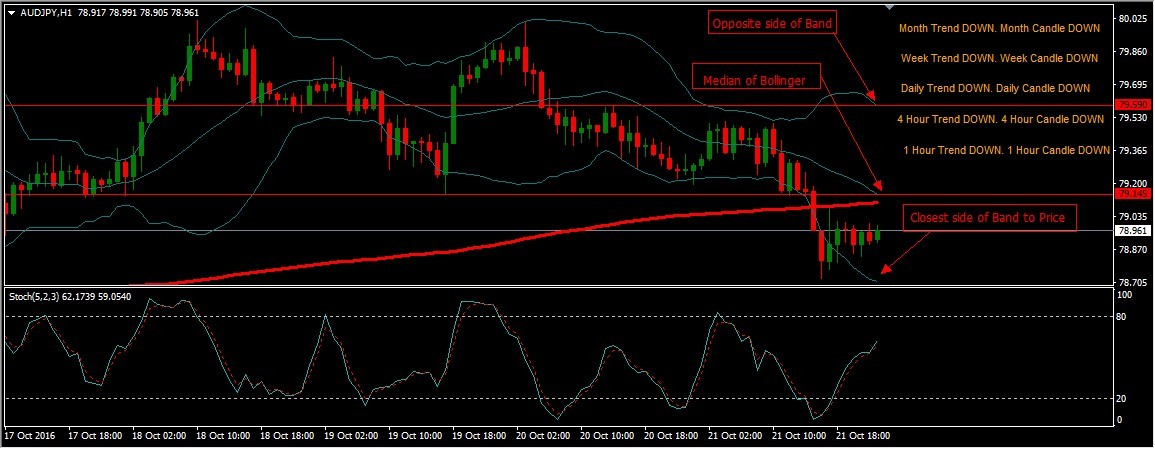
1st Position, is according to trend of the BEST TWO TRENDING CHARTS/PAIRS(Just Gets in once Calculated, going the direction of the Trend... with Option in Settings to get in after first Pull-back). 2nd Position, when it pulls back to the Middle of the Bollinger Median Point.
For Example... [See Attachment]
Then, Opposite Side of the Bollinger Band, from where you ENTERED a Position, According to the 1 HR. & 4HR. Charts, Median and Opposite Band(Furthest Band) Points. (We call Pull Backs, High Fives).
For Example... [See Attachment]
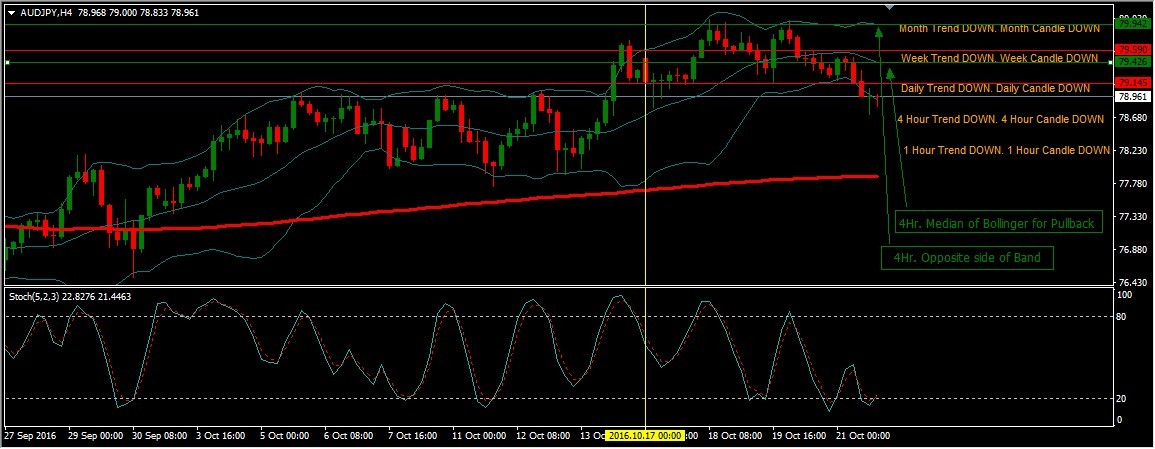
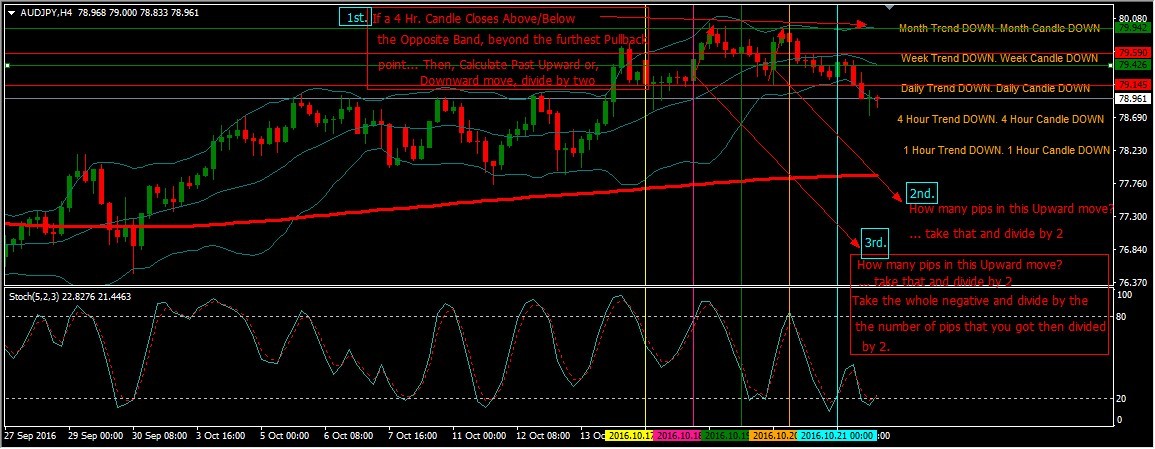
*We Will look to go the Opposite Direction ONLY After.... Price Closes Above or, Below the Opposite Point of Entry, Furthest Pullback Point, with both 1 hour and 4 hour Median ond Opposite Band Points, from where we 'started from/entered from'.
&, we need the EA to calculate how many pips the 4 Hour Candles last Move Upward or Downward was.
For Example... [See Attachment]
Also,
*Calculation Example... 0.01 in 4 negative positions... Lets say those 4 Negative Postions are: -$3.00 + -5.00 + -$8.00 + -$11.00 = -$27+ $50 Profit = $77 Goal.
80pips last Upward move / 2 = 40 pips... So, $77 / 40 = $1.93 a LOT. (.19) or, you can round up to (.20) lot size... Then, if the Price Stops going up and Goes against us again, for some strange reason after another 4 Pullback points, then the opposite way with now be (.20 LOT X 4 positions negative... example -$50, -$100, -$150,- $200) = $-500 + 200 profit = $700... 80 pips last Downward move / 2 = 40 pips... So, $700 Goal /40 pips = 17.5 a LOT (1.75 LOT size) or, you can round up to (1.8 LOT size)
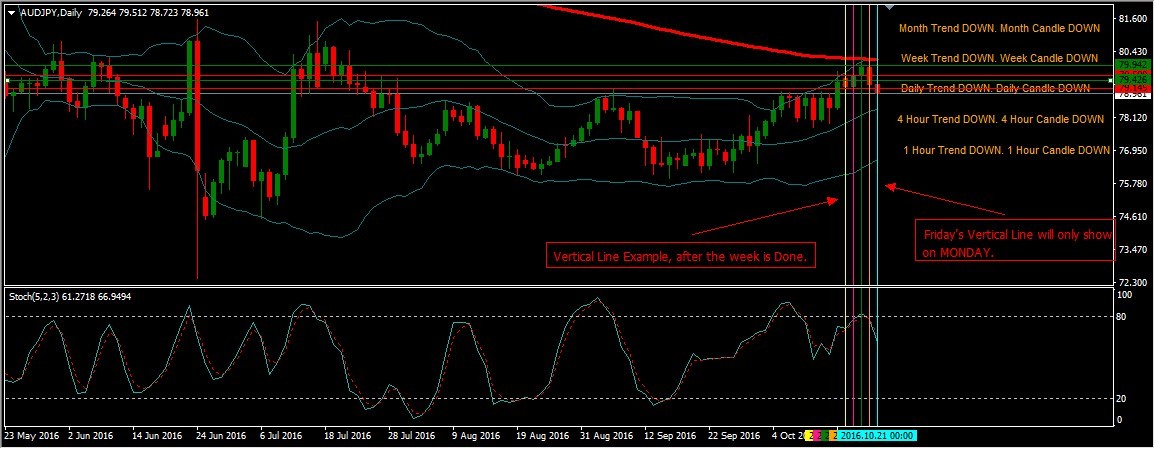
*We want Vertical lines to be drawn for Only the Current Week Only(5 days (M-F) after each day has closed/finished).
We want Monday(Yellow) Tuesday(Pink) Wednesday(Green) Thursday(Gold) Friday(Sky Blue & Friday only showed on Mondays)For Example....
*Horizontal Lines for the Closing and Opening of EACH DAILY CANDLE for the CURRENT WEEK ONLY.
For Example....
*On the Right Side of the Chart, Where it is empty after pushing (button)
We want Every Chart/Pair to Show(the BELOW) on the Right Side of the Chart:
Month Trend DOWN/UP - Month Candle DOWN/UP side note:(8 size font) (DOWN in Red) (UP in Green)
Week Trend DOWN/UP - Week Candle DOWN/UP side note:(8 size font) (DOWN in Red) (UP in Green)
Day Trend DOWN/UP Day - Candle DOWN/UP side note: (8 size font) (DOWN in Red) (UP in Green)
4 Hr. Trend DOWN/UP - 4 Hr. Candle DOWN/UP side note: (8 size font) (DOWN in Red) (UP in Green)
1 Hr. Trend DOWN/UP - 1 Hr. Candle DOWN/UP side note: (8 size font) (DOWN in Red) (UP in Green)
Also, Other Details Underneath like:
2 BEST TRENDING PAIRS/Charts(Currently)
Balance
Equity
Total Sell Lots
Total Buy Lots
Earned Today
Earned Yesterday
Before Yesterday
Spread (in pips, NOT POINTS)
Responded
1
Rating
Projects
201
42%
Arbitration
44
9%
/
68%
Overdue
47
23%
Free
2
Rating
Projects
73
16%
Arbitration
13
8%
/
92%
Overdue
37
51%
Free
Similar orders
Robot for the day, make money during the week
30 - 100 USD
Hello, send robot models with a solid strategy (to trade forex), I want to use it to make money for the week. It is important that you present me with your profitability graph and a test. I also want to hire him for future jobs
Developer for Automated Trading Bot with 4 SMA Crossover Strategy and NinjaTrader Customizations
30 - 50 USD
I am looking to develop an automated trading bot based on a strategy involving the crossing of four Simple Moving Averages (SMA). The bot should be capable of entering trades based on this strategy. Additionally, I would like to incorporate some custom diversions tailored for NinjaTrader
Create Harmonic patterns advisor
50 - 80 USD
Seeking an experienced MQL5 developer to create a sophisticated Expert Advisor focused on harmonic pattern trading . The EA will be designed to identify and trade based on popular harmonic patterns in the forex market. Entry and Exit Logic: Develop smart entry and exit rules based on pattern completions and price action confirmations. Risk Management: Incorporate adjustable risk-per-trade settings and position sizing
Criação de robo com base em 2 medias móveis
30 - 50 USD
preciso de um robô com duas médias móveis, uma exponencial high e uma exponencial low. preciso também ter a opção de utilizar e todos os tempos gráficos e alterar os parâmetros das médias. entrada de compra será feita quando um candle de alta romper e fechar a cima da média high e fechará a posição quando um candle de baixa romper e fechar a baixo da média low. a venda será feita quando o candle de baixa romper e
Simple EA, placing Sell trades in EUR/USD
30 - 200 USD
Description - An expert advisor(s), placing sell trades in EUR/USD, based on the close price of the previous two candles, as shown in the figure below. The trades would be made in the 5 minute, 1 hour, and 1 day timeframes. In the 5 minute and 1 hour timeframes the market orders would be placed at the start of a new candle, at specific times EST. The order would be cancelled at the close of that candle, i.e after 5
Copy indicator for mt5
30+ USD
Hi, I have an indicator from my friend, I want to copy it to my own Traidingview or MT5 can you do that for me. Here is the link
Develop a simple trading robot from rainbow oscillator Additional features Include timeframe specification in rainbow oscillator trailing features moving average filter TP (true/false) SL (true/false) Fixed lot Risk percentage Percentage profit lock
Copy indicator for Mt5
30+ USD
Hi, I have an indicator from my friend, I want to copy it to my own Traidingview or MT5 can you do that for me. Here is the link
Dashboard design
30+ USD
I need a dashboard that shows my various accounts that shows balance, equity, number of trades open, drawdown and some more information. I want to use it to monitor my accounts in one screen or chart. If there is anyone who can do it please show me the screenshot of your sample
Hi, I need a robot, which wil get instructions to trade in 3 symbols at the same time based on few parameters and calculations. Example: There is 1 symbol called Gold-Near and the rate for it is 1000-1002 If i specify that when the rate reaches 1050, it should sell 1 lot Upon execution it will have to sell 1 lot of cme gold, buy 3 lots of mcx gold and buy currently (lots will be based on calculation). All the
Project information
Budget
80 - 100 USD
For the developer
72
- 90
USD
Deadline
from 14 to 21 day(s)