Watch the Market tutorial videos on YouTube
How to buy а trading robot or an indicator
Run your EA on
virtual hosting
virtual hosting
Test аn indicator/trading robot before buying
Want to earn in the Market?
How to present a product for a sell-through
Expert Advisors and Indicators for MetaTrader 5 - 24
Indicator that synchronizes the charts, that is, when the asset is replaced in one of the charts, all those that appear with the synchronized indicator are changed, with the same timeframe (Same_Timeframe = true) or with different timeframes (Same_Timeframe = false). The graphics to be synchronized are identified by color (Label). To synchronize the indicators, the indicator must be inserted in all charts to be synchronized, using the same color (Label). A box with the chosen color (Label) and

Introducing EMA CrossPro EA: The Ultimate Trend-Following Solution! Take your trading to the next level with EMA CrossPro EA, a sophisticated yet user-friendly Expert Advisor designed to maximize profits in trending markets. This EA leverages the power of Exponential Moving Averages (EMAs) to detect and capitalize on strong market trends with precision and efficiency. The Logic Behind EMA CrossPro EA:
Buy Signal: The EA initiates a buy trade when the Fast EMA crosses above the Slow EMA, signali

MT4 Version https://www.mql5.com/en/market/product/129411 MT5 Version https://www.mql5.com/en/market/product/129412
The Dashboard Scanner Kalman is an advanced multi-symbol and multi-timeframe scanning tool designed to simplify your trading process by leveraging the powerful Kalman trend level and support-resistance calculations. This indicator combines trend-following algorithms and precision support-resistance analysis to help you quickly identify optimal trading opportunities across multipl

The program allows you to easily copy transactions between MetaTrader 4 (MT4) and MetaTrader 5 (MT5) in any direction. The program is designed to work on "Windows PC" and "Windows VPS". Any type of copying is available
MT4 - MT4 MT5 - MT5 MT5 - MT4 MT4 - MT5 *The copier works only on forex and only with currency pairs
*two versions of the Trade Copier for MT4 + Trade Copier for MT5 product are required for copying between MT4 - MT5 terminals.
MT4 - https://www.mql5.com/en/market/product/85
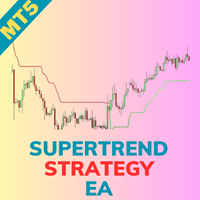
Supertrend Strategy Expert Advisor for MetaTrader 5 Introduction: Welcome to the Supertrend Strategy EA, an advanced tool designed exclusively for MetaTrader 5. This expert advisor streamlines trading activities by harnessing the power of the Supertrend indicator, automating trade entries buy or sell signal. The EA also facilitates reverse trading setups within these zones, offering a versatile approach to managing trades. For detailed documentation Overall Settings/Input Guide | Indicator Set
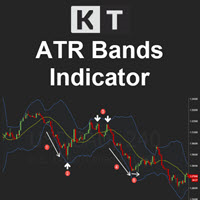
KT ATR Bands draws the volatility envelops and bands using a combination of Average True Range and Moving average. They are typically used to identify the potential reversal points and the periods of high and low volatility.
Features
Multi-Timeframe Ability: For example, you can have the atr bands from the daily timeframe on the H1 timeframe. Smart Alerts: You can turn on/off alerts for each band separately. Also, you can choose a minimum time interval between each alert to stop unnecessary, an

Trade Like the Big Players! ITZ is the ultimate tool for traders looking to align with institutional movements. It keeps you informed about incoming and outgoing market sessions while leveraging highly optimized strategies for session signals.
Key Features: Multi-Currency Support – Trade across different assets effortlessly. Optimized for M1 to M30 Timeframes – Ideal for scalpers and day traders. 3 Powerful Signal Strategies – Designed for high-probability trades. Session Markers & Alerts

This is an advanced multi-timeframe version of the popular Hull Moving Average (HMA) Features Two lines of the Hull indicator of different timeframes on the same chart. The HMA line of the higher timeframe defines the trend, and the HMA line of the current timeframe defines the short-term price movements. A graphical panel with HMA indicator data from all timeframes at the same time . If the HMA switched its direction on any timeframe, the panel displays a question or exclamation mark with a tex

The DR IDR Range Indicator PRO plots ADR, ODR and RDR ranges for a given amount of days in the past. A key feature that appears is that it calculates the success rate of the ranges for the shown days. This indicator is perfect for backtest since it shows ranges for all of the calculated days, not just the most recent sessions. In the PRO version you can now: use fully customizable advanced statistics to base your trades on get an edge via calculating statistics on up to 3 different day period

KT Higher High Lower Low marks the following swing points with their respective S/R levels: Higher High: The swing high made by the price that is higher than the previous high. Lower High: The swing high made by the price that is lower than the previous high. Lower Low: The swing low made by the price that is lower than the previous low. Higher Low: The swing low made by the price that is higher than the previous low.
Features The intensity of swing high and swing low can be adjusted by chan

Indicator for manual trading and technical analysis for Forex.
It consists of a trend indicator with the opening level of the trading day and a arrow indicator for determining entry points.
The indicator does not recolor; it works when the candle closes.
Contains several types of alerts for signal arrows.
Can be configured to work on any chart, trading instrument or time frame.
The work strategy is based on searching for price movements along the trend.
To make " Buy " transactions: The tre
A neural network Expert Advisor based on two moving averages with the training mode. Train the Expert Advisor on selected examples and make a profit in real life. The EA can work on any instrument and in any timeframe.
Trading Algorithm of the EA Two moving averages are analyzed by the neural network core, which produces commands to buy or sell. the values of two moving averages, fast (FMA) and slow (SMA), are provided to the first layer, at the second layer it calculates two neurons responsibl
FREE
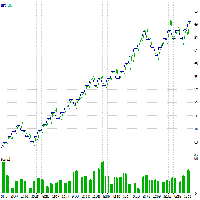
Strategy description The idea is to go with trend resumption. Instruments Backtest on XAUUSD shows profitability over a long period Simulation Type=Every tick Expert: GoldScalper Symbol: XAUUSD Period: H1 (2020.01.01 - 2023.02.28) Inputs: magic_number=1234 ob=90.0 os=24.0 risk_percent=2.64 time_frame=16385 Company: FIBO Group, Ltd. Currency: USD Initial Deposit: 100 000.00 Leverage: 1:100 Results History Quality: 51% Bars: 18345 Ticks: 2330147 Symbols: 1 Total Net Profit: 77 299.48 Balance Draw
FREE

Assistant: Trade Assistant-MT4 (click to download) Trade Assistant-MT5 (click to download)
Please read the operating instructions carefully.
Basics: Quick opening and closing of positions, one-click opening and closing of positions, one-click placing of orders Draw-Line Trade Auto sl/tp Close By Symbols Profit Protected Move SL Protect Trailing SL Account RiskControl Order's Shadow Auto-Add Orders Auto-Close Orders Close ReOpen Symbols Infomation Chats Open Data Statistics Support language

Pivot Classic, Woodie, Camarilla, Fibonacci and Demark Floor/Classic Pivot points, or simply pivots, are useful for identifying potential support/resistance levels, trading ranges, trend reversals, and market sentiment by examining an asset's high, low, and closing values. The Floor/Classic Pivot Points can be calculated as follows. Pivot Point (P) = (High + Low + Close)/3 S1 = P * 2 - High S2 = P - (High - Low) S3 = Low – 2*(High - P) R1 = P * 2 - Low R2 = P + (High - Low) R3 = High + 2*(P - Lo
FREE

Divergence is one of the vital signals that depicts the upcoming price reversal in the market. KT Stoch Divergence shows the regular and hidden divergences build between the price and stochastic oscillator.
Limitations of KT Stoch Divergence
Using the Stochastic divergence as a standalone entry signal can be risky. Every divergence can't be interpreted as a strong reversal signal. For better results, try to combine it with price action and trend direction.
Features
Marks regular and hidden di

This tool adds an original time scale with a specified or automatically calculated time difference to the bottom of the chart.
By using this handy tool, you can improve the readability of the chart and reduce mental stress by displaying it in a time format familiar to you or your country.
Even if you don't need to calculate time differences, simply replacing the default time scale with Local_Time can improve the chart's readability.
Local_Time supports various time formats such as "DD.MM hh:m
FREE
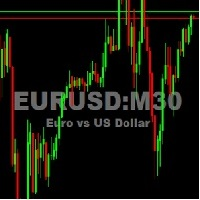
This utility tool shows the ticker symbol, timeframe, and description information as a watermark on the chart. Text resizes automatically according to chart size. It is useful to identify the correct chart when multiple charts are shown on the screen. Want more control over text apperance? Check out our Chart Watermark MT5 Premium utility. See the demonstration video below!
Inputs: Font Size: Initial font size for the ticker symbol and timeframe text (Default; 50). Description text font size
FREE

Because style matters I know how annoying it is to click properties every time to change the candle’s color, the background to light or dark, and put or remove the grid. Here is the solution with one click: Three customizable buttons to choose the candle style that traders want. One button to switch between Day and Night mode. One button to show or hide the Grid on the charts. *****On the settings, you can choose where the buttons should be displayed on the screen***** Also, consider checking m
FREE
This indicator is the mql version of the SSLHybrid indicator. Description of TradingView version: This script is designed for the NNFX Method, so it is recommended for Daily charts only.
Tried to implement a few VP NNFX Rules
This script has a SSL / Baseline (you can choose between the SSL or MA), a secondary SSL for continiuation trades and a third SSL for exit trades.
Alerts added for Baseline entries, SSL2 continuations, Exits.
Baseline has a Keltner Channel setting for "in zone" Gra
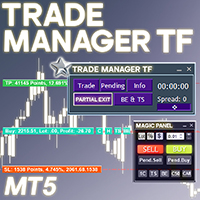
Trade Manager TF Expert MT5 The Trade Manager TF Expert is a specialized tool designed to enhance trade execution, risk management, and capital allocation for traders. It provides a structured approach to managing trades with advanced functionalities, accessible through two primary panels: the Trade Manager panel and the Magic Panel . This expert advisor includes essential features such as Partial Exit, BreakEven, Trailing Stop, order execution, position sizing, and setting profit targets . Thes
FREE

EA Gold Trader for Prop-Firms Your ally to successfully pass Prop Firms challenges with precision and reliability! “EA Gold Trader for Prop-Firms” is an Expert Advisor specifically designed to tackle and successfully complete the challenges of the most renowned Prop Firms while maintaining control and stability during subsequent phases. Thanks to its flexible configuration and optimized parameters, this EA is ideal for meeting Prop Firms’ requirements, offering a reliable and controlled trading

Indicator determines the direction of price movement, calculates the possibility of entering the market using an internal formula and displays a breakout entry signal. Indicator signals appear both at the beginning of trend movements and in the opposite direction, which allows you to open and close orders as efficiently as possible in any of the market conditions. Version for МТ4: https://www.mql5.com/en/market/product/58349
Benefits: a unique signal calculation formula; high signal accuracy; d
FREE

#property copyright "Copyright 2023, MetaQuotes Ltd." #property link " https://www.mql5.com " #property version "1.00" #include <Most_Common_Classes.mqh>
// Define parameters for the moving averages input int fastMAPeriod = 10; // Fast MA period (e.g., 10 for scalping) input int slowMAPeriod = 20; // Slow MA period (e.g., 20 for scalping) input ENUM_MA_METHOD maMethod = MODE_SMA; double lotSize; int maShift_current = 0; int maShift_Previous = 1; bool enou
FREE

Universal trading adviser on custom indicators for MetaTrader 5. Builder of strategy. Write the name of your indicator with Arrow and signal buffers, and our EA xCustomEA trades on these signals. You can also use many of our built-in functions. Version for MetaTrader4: The xCustomEA version for MetaTrader 4 terminal The functionality of the universal trading adviser The xCustomEA exactly duplicates all the parameters of our advisor The X except one: The xCustomEA works on a custom indicat

The main advantage of this indicator is filtering of buy and sell signals in the direction of the market impulse and ranking them by strength. Configuration of the indicator is simple and intuitive. All you need to do is to react only to strong signals. Adhere to the money management rules.
Description The Color Stochastic with an analytical panel indicator consists of the Stochastic indicator itself and the information/analytics panel. The indicator provides options for configuring the paramet

The Prop Max Daily Loss Manager is designed for traders who trade with Prop companies. This utility will help you avoid exceeding the maximum daily loss set by the prop company. You can set your own daily loss level, upon reaching which trades will be closed and you will receive a corresponding message. This way, you will close your trades on time and not lose your account. It is recommended to set the risk at 10-20% lower than the company's set level, because there may always be slippages that

This robot works with crossing of moving averages. Moving averages are used mainly to follow trends, the strategy of crossing moving averages has the main purpose of taking advantage of large bullish and bearish movements. All parameters are editable and easy to use, this is an experimental project. Use this robot to carry out studies and share with us the bes information you find. Aurélio Machado.
FREE
This strategy ensures significantly lower risk by employing advanced techniques and AI-driven filters to identify only the highest quality setups on a 1-minute timeframe. Configurations Based on Investment: $100 : Utilize an FBS broker cent account to convert $100 to $10,000 (cents). $1,000 : Apply a 0.25 lot size using the precise configurations detailed in the provided screenshot. $10,000 : Execute trades with a 10 lot size, adhering strictly to the specified configurations. $100,000 : Operat

Introducing our Expert Advisor (EA) that empowers you to create custom timeframes in MetaTrader 5, defined in seconds—from as short as 1 second. This EA generates a new symbol with your specified timeframe, updating with every tick. Utilize this symbol for real-time analysis, trading, and backtesting your strategies. Additionally, our EA allows you to adjust your chart's time zone independently of your broker's. Given that brokers operate across various time zones, their charts can differ. With

The purpose of Impulse Release is to prevent trading in the wrong direction. While the Impulse System operates in a single timeframe, Impulse Release is based on two timeframes. It tracks both the longer and the shorter timeframes to find when the Impulse points in the same direction on both. Its color bar flashes several signals: If one timeframe is in a buy mode and the other in a sell mode, the signal is "No Trade Allowed", a black bar. If both are neutral, then any trades are allowed, showi
The Omega Trend Indicator is an advanced tool that has been specifically designed to detect market trends early, and follow them efficiently. The indicator draws two lines. The main (thicker) Trend Line represents the presumed lower or upper volatility limits of the current market trend. A break in the main Trend Line indicates a potential reversal or shift in the movement of the trend. The Trend Line also indicates the best point to place a stop loss order. In Omega Trend Indicator, the Trend L
FREE

Introduction to X3 Chart Pattern Scanner X3 Cherart Pattern Scanner is the non-repainting and non-lagging indicator detecting X3 chart patterns including Harmonic pattern, Elliott Wave pattern, X3 patterns, and Japanese Candlestick patterns. Historical patterns match with signal patterns. Hence, you can readily develop the solid trading strategy in your chart. More importantly, this superb pattern scanner can detect the optimal pattern of its kind. In addition, you can switch on and off individu

Fully automatic trading system that trades Renko bars and trend indicators. Renko bars are drawn in the indicator window below the chart. The signal to sell or buy is the intersection of renko and indicator signal. The default settings for the euro / dollar pair, t he EA has shown the best results for the pair GBPJPY and GOLD . The timeframe for trading is m1. There is a time filter. The EA has an autolot system. Our telegram channel After installing the EA, download the installation set
FREE

Quarterly Cycles
Quarterly Cycles is based on the Quarterly Theory developed by Daye ( traderdaye on X ). This is an aid to the user to find Cycles and it is NOT automatic detected, user can select AMDX or XAMD in each Cycle and it will be visually drawn on the chart. Quarterly Cycles: Yearly, Monthly, Weekly, Daily, 6 Hour (90 minutes)
– Yearly Cycle : The year is divided in four sections of three months each Q1 - January, February, March Q2 - April, May, June Q3 - July, August, Septemb

Volume and RSI-based sniper entry signals for Boom and Crash synthetics feature robust entry alert systems. For more advanced filter signals, consider the Harmonic Hybrid Pro. When trading spikes, three orders are strategically placed to manage risk, with the third order positioned close to the highest probability of a spike. Signals are no longer valid fifteen minutes after the final order, and any losses should be closed promptly. For take profit (Tp), it is advisable to exit shortly after a s
FREE
Automatically scans the chart to find Harmonic Patterns, and give you the chance to enter early in good operations. Also if selected, it will alert you in advance when future patterns appears, showing you a projection of a posible future pattern. The main goal for this algorithm is to determine with high precision the moment when a trend ends and a new one begins. Giving you the best price within a reversal. We have added the "Golden Trade", we define it as the perfect order: For those ord

Check my version of the moving average convergence divergence (MACD) indicator based on Heikin Ashi calculations. Here you find multi-colored histogram which corresponds to bull (green) / bear(red) trend. Dark and light colors describes weakness/strenght of price trend in time. Also you can switch calculations between normal and Heikin Ashi price type.
Note: Buffers numbers for iCustom: 0-MACD, 2-Signal line
FREE

Only 2 copies for the price of 199 USD. Next price 249 USD WARNING : ECN accounts
Golden Arrow - is a novelty in the Forex market, developed by a team of practicing analysts in the world of trading with many years of experience. This trading algorithm broke into the global markets with excellent profitability, reliability and safety indicators. Golden Arrow - is a syndicator-free fully automated trading algorithm, which is based on the methods of cluster market analysis in combination with pri

This Indicator Automator for MT5 is a flexible MT-5 Expert Advisor targeting the trading strategy development and the automated trading based on up to 4 external indicators.
Benefits:
Import of up to 4 indicators (no source file needed) Fast development of trading strategies Automated trading without coding expenses Support of different money management methods Optional use of grid and martingale techniques Powerful virtual trailing stop also applicable in grid mode
Characteristics: Entries

Get alerts when a trend is breaking out. This indicator signals when price makes a large move in the direction of the dominant trend. These signals can serve as entry points, or points to add to an existing position in a trend. Note: Trend following has a low win rate (less than 50 percent), but the return of the average winning trade is typically 3 to 5 times larger than the average losing trade. Simple Setup Drag and drop onto any chart, at any timeframe. Enable alerts (optional) And you're d
FREE

The KPL Swing indicator is a simple trend following mechanical trading system which automates the entry and exit. The system works with a hard stoploss and a trailing stoploss for exit with profitable trades. No targets are given as no one knows how high (or low) a Price can move. A trailing stoploss locks in the gains and removes emotions from trading. Convert from indicator Amibroker with modified Perfect if combining with KPL Chart Uptrend & Downtrend
FREE
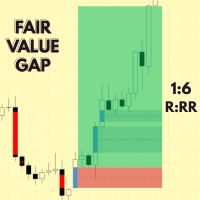
Fair value gap indicator MT5 – Advanced Fair Value Gap Detection for MT5 Enhance Your Trading with Fair value gap indicator MT5! Are you looking to identify Fair Value Gaps (FVGs) effectively and integrate them into your trading strategy? The Fair value gap indicator MT5 for MetaTrader 5 (MT5) offers a comprehensive solution to detect and utilize FVGs, providing you with a trading edge. Key Features: Dynamic FVG Detection: Automatically scans and highlights FVGs on your cha
FREE

This is one of the most popular and highly rated volatility index (VIX) indicators on the market. It provides the same readings as the VIX does for stock indexes. However, this indicator works across all asset classes. VIX Fix Finds Market Bottoms. This indicator is not for inexperienced traders. Use it for day and swing trading. MT4 Version - https://www.mql5.com/en/market/product/112238 Join To Learn Market Depth - https://www.mql5.com/en/channels/suvashishfx
Bernard Baruch summe
FREE

Note = After the purchase please send me a private message to receive the set file. FCK Emperor EA is best for session's high-low break trading strategy. Option shows for trading. Note = After the purchase please send me a private message to receive the set file. Common set file available in comments. Connect with other traders by joining our MQL5 community of over 390 members. Stay up to date with the latest product updates, tips, and exclusive content. FCK Emperor EA stands o
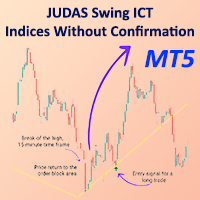
Judas Swing ICT Indices Without Confirmation for MetaTrader 5 The Judas Index Indicator is an essential tool in MetaTrader 5, designed to help traders recognize deceptive price movements. Many market participants misinterpret the initial price fluctuations, leading to incorrect trade entries. This indicator assists traders in detecting these false moves and provides signals for potential trade opportunities. The Judas Indices ICT Indicator specifically monitors price swings between the most rec
FREE

Do you love VWAP? So you will love the VWAP Cloud . What is it? Is your very well known VWAP indicator plus 3-levels of Standard Deviation plotted on your chart and totally configurable by you. This way you can have real Price Support and Resistance levels. To read more about this just search the web for "VWAP Bands" "VWAP and Standard Deviation".
SETTINGS VWAP Timeframe: Hourly, Daily, Weekly or Monthly. VWAP calculation Type. The classical calculation is Typical: (H+L+C)/3 Averaging Period to
FREE
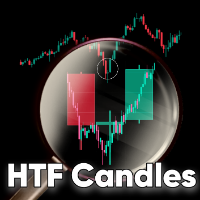
HTF Candles is an indicator which plots the outline of the higher time-frame candles on the lower candle. The indicator plots only closed candles, with no lag or repainting. Features No objects drawn on chart: The indicator does not plot any lines or rectangle objects on the chart, it simply draws the htf candles. This keeps your chart simple and clean. MTF Selection: The indicator allows you to choose all the different higher time-frames for each lower period in one go, and goes changing accord
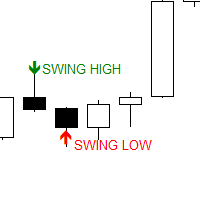
The Swing Point scanner scans for Swing High and Swing Low in real time and on the strategy Tester. It works on all time frames. Swing High is a candlestick High that has a Lower High on both side. Swing Low is a candlestick Low that has a Higher Low on both side.
Past Swing points are area where buy-side and sell-side liquidity can be found. This are areas where most traders place their buy and sell stops.
FREE

The Inside Bar pattern is a very well known candlestick formation used widely by traders all over the world and in any marketplace. This approach is very simple and adds a little confirmation candle, so it adds a third past candlestick to the count to confirm the direction of the move (upward or downward). Obviously, there is no power on this candlestick formation if the trader has no context on what it is happening on the market he/she is operating, so this is not magic, this "radar" is only a
FREE

Introduction This indicator detects volume spread patterns for buy and sell opportunity. The patterns include demand and supply patterns. You might use each pattern for trading. However, these patterns are best used to detect the demand zone (=accumulation area) and supply zone (=distribution area). Demand pattern indicates generally potential buying opportunity. Supply pattern indicates generally potential selling opportunity. These are the underlying patterns rather than direct price action. T
FREE

The Opening Gap EA is particularly suitable for trading the gaps at the opening of stock prices. Since stocks generally rise more than they fall, only buy positions are opened. The trade is placed shortly before the end of trading hours and closed the next day immediately after opening. The gap created here is then taken as profit. Good profits were generated in the backtest with NVDA. This EA is a good addition to the EA portfolio.
Advantages of the EA:
No martingale, no grid system Every tra
FREE

BreakRunner - Automated Trading with Advanced Risk Management
BreakRunner is an Expert Advisor designed for traders seeking to automate their operations with a Price Action scalping strategy and advanced risk control. The robot identifies price accumulations and executes buy or sell trades when key highs or lows are broken. Key Features Trading Strategy: Identifies price accumulation breakouts to execute scalping trades. Recommended for 5-minute timeframes, configurable. Risk Management: Variab
FREE
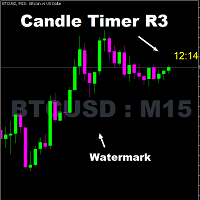
Timer remaining to finish the candle. A simple informative indicator of how much time is left until the current candle ends. In a simple, easy and objective way. In the input parameters, enter the desired color of the clock, the font size and the displacement to the right of the candle. I hope I helped with this useful and free tool. Make good use and good business.
FREE

Place price Alerts on extended Rectangles and Trendlines - Risk reward indicator mt5 Extend Rectangles & Trendlines to the right edge Mark your supply demand zones with extended rectangle and draw support resistance lines with extended trendline. Find detailed manuals here . Find contacts on my profile . MT4 Rectangle extender indicator will simplify and make it easier for you to analyze markets and stay notified about important events. When you extend rectangle or trendline the a
Pro version: https://www.mql5.com/en/market/product/135280
Live account: https://www.mql5.com/en/signals/2280760
Breakout Evo – Intelligent EA powered by Machine Learning Breakout Evo is an automated Expert Advisor (EA) developed by Machine Learning (ML) and advanced algorithms to analyze the market and enter orders based on Breakout patterns intelligently. This EA is designed to help traders make accurate profits and minimize risks.
Key Features: Powered by Machine Learning –
FREE

The Order Block Indicator for MT5 is a powerful tool designed for traders who use smart money concepts and institutional trading strategies. It automatically detects key order blocks on the chart, helping traders identify high-probability reversal and continuation zones.
Key Features: • Automatic Order Block Detection – Highlights strong buying and selling zones based on price action and volume. • Multi-Timeframe Support – Analyze order blocks across different timeframes for better market in
FREE

Description. The basis for the formation of the Renko chart is the price range. If the price goes beyond its limits, the chart shows a box above or below the previous one. As a result, we see price movement without additional "noise" and important support and resistance levels. Features.
For use in conjunction with the Expert Advisor, an additional buffer is implemented-a box counter. For convenience and to increase the speed of testing, the user can use the "new box" event, which the indicator
FREE

Professional tool for professional traders It allows you to browse all available financial instruments and select best ones to trade with lightning speed.
Fastest market screening ever
Move your mouse over the instruments and instantly see 3 charts with selected timeframes and predefined indicators! Click on the symbol name to hold it. Use UP and DOWN keys to select previous / next instrument.
Ultimate charting Smooth scale, automatic indicator lines width, smart grid and much more. You'll li

Descrição do produto
Este Expert Advisor (EA) foi desenvolvido para a plataforma MetaTrader 5, especificamente para operar no par de moedas XAU/USD (Ouro) no timeframe M15. Ele utiliza uma combinação de 15 indicadores técnicos para tomar decisões automáticas de entrada e saída de negociações, fornecendo uma solução robusta e configurável.
Características Principais:
• Lotes de Entrada: 0,01 • Número Mágico Base: 100 • Máximo de Posições Abertas: 100 • Spread Permitido: 0 pontos (máximo) • Pat
FREE

Automated trading system it's a professional instrument that allows you to achieve results without the negative influence of a human factor. Effectiveness is confirmed by trading on a real account since 2017. Perform all the tests with the modelling type RealTicks or EveryTick. LINKS Full description of the algorithm; Signal monitoring ( WeTrade + BOA System ); Presets for popular symbols. TRADING STRATEGY DESCRIPTION The trading strategy is based on a breakout of accumulation. Such tra
FREE

Quantum Dow Jones Quantum Dow Jones Settings Symbol: US30 Timeframe: 5M Lots: Lots Average Trade Profit Maximum Drawdown (MAX DD) Net Profit in 2 Years 0.01 $0.20 $2.76 $240 0.10 $2.00 $27.6 $2,400 1.00 $20.0 $276 $24,000 10.0 $200 $2,760 $240,000
Overview The Quantum Dow Jones is a sophisticated automated trading tool, specifically designed to operate on the Dow Jones. With an average frequency of 45-50 trades a week, this bot combines advanced machine learning algorithms with price action tec
FREE

Time your Entry and Exits with Average True Range (ATR) Trailing Stops ATR Trailing Stops are primarily used to protect capital and lock in profits on individual trades but they can also be used, in conjunction with a trend filter, to signal entries. The indicator will help make your calculation of stop loss easier as it will be visually aiding you in choosing where to put your stoploss level on the chart by calculating the current value of ATR indicator. For those who are unfamiliar with ATR, i
FREE

The "Speedometer" Expert Advisor is based on a tick speed analysis strategy that identifies entry and exit points based on changes in the tick data rate. The Expert Advisor monitors tick dynamics and opens positions when a specified tick speed threshold is reached, allowing timely market entries during high activity and avoiding trades during low volatility. The Expert Advisor supports the following settings and parameters: Main Strategy Parameters : FixedLot : Fixed lot size for each trade. Re

POPEYE GOLD BOT - XAUUSD H1 Introducing the Popeye Gold Bot Your new best ally in XAUUSD trading, designed and optimized for H1 timeframes! This EA uses an advanced algorithm to navigate the volatile gold market, providing consistent and high-performing results. The bot has been thoroughly tested and optimized, showing exceptional performance with the broker Darwinex, and is ready to be used on platforms such as IC Markets, VT Markets, FTMO, and Exness. Statistics Breakdown : Net Pr
FREE

This comprehensive technical indicator calculates and plots up to 3 moving averages with 3 different periods. By employing three moving averages of distinct lookback periods, the trader can confirm whether the market has indeed experienced a change in trend or whether it is merely pausing momentarily before resuming its prior state. SX Golden MA Pack for MT4 is available here . The shorter the moving average period, the more closely it tracks the price curve. When a security initiates an upt
FREE
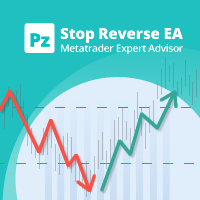
This EA recovers losing trades using a sequential and controlled martingale: it places consecutive trades with increasing lot sizes until the initial trade is recovered, plus a small profit. It offers a complete hassle-free trading framework, from managing initial trades to recovery. Please note that the EA implements a martingale, which means that it takes balance losses that are recovered later. [ User Guide | Installation Guide | Update Guide | Troubleshooting | FAQ | All Products ]
Feature
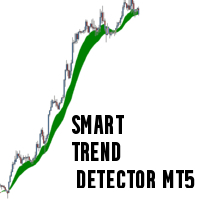
Market Trend Levels Detector The Market Trend Levels Detector is an MQL5 indicator designed to help traders visualize dynamic market trends and potential reversal points. It operates by calculating two exponential moving averages (EMAs)—a fast EMA and a slow EMA—to assess the current trend direction. Key features include: Dynamic Trend Fill:
The area between the fast and slow EMAs is filled with different colors depending on the market regime. When the fast EMA is above the slow EMA (suggesting
FREE
Thank you users for all your great reviews !
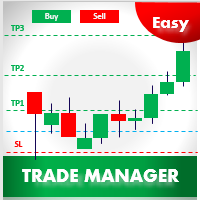
Enter the Risked Amount or Lot size or % of Balance (New!) Drag the RED line on the chart to fix the Stop-Loss. Drag Blue line (New!) for Limit/Stop orders automatically ! Adjust TP1, TP2 and TP3 lines You are ready to Buy/Sell > Adjust the lines even after the trade Reviews - https://tinyurl.com/etmreviews
Check the user video - https://tinyurl.com/etmmt4ea Check updated information on - easytrademanager.com
Automatic Breakeven TP1/2 | Book Part

Introducing Stop Guardian: Elevating Your Risk Management with Trailing Stop and Profit Closure. Stop Guardian is an Expert Advisor (EA) designed to optimize risk management in your trading strategies, combining trailing stop and an automatic position closure system based on profits. Key Features
Automated Risk Management : Automatically adjusts open positions using trailing stop to protect profits and minimize losses.
Customizable Settings : Allows you to adjust trailing stop parameters (Tra
FREE
The MetaTrader Market is the best place to sell trading robots and technical indicators.
You only need to develop an application for the MetaTrader platform with an attractive design and a good description. We will explain you how to publish your product on the Market to offer it to millions of MetaTrader users.
You are missing trading opportunities:
- Free trading apps
- Over 8,000 signals for copying
- Economic news for exploring financial markets
Registration
Log in
If you do not have an account, please register
Allow the use of cookies to log in to the MQL5.com website.
Please enable the necessary setting in your browser, otherwise you will not be able to log in.