Watch the Market tutorial videos on YouTube
How to buy а trading robot or an indicator
Run your EA on
virtual hosting
virtual hosting
Test аn indicator/trading robot before buying
Want to earn in the Market?
How to present a product for a sell-through
Paid Technical Indicators for MetaTrader 4 - 15

GS trendS is a trend indicator that can be used for any Forex financial instrument.
The indicator does not redraw and does not lag. Recommended timeframe H1.
It is possible to select the trend algorithm settings {Only Open, Average Open/Close, Average High/Low}
The color indicates the direction of the trend: yellow - direction can be SELL or BUY (S_B)
blue - uptrend (BUY)
red - downward trend (SELL) The indicator panel displays trend values of 5 timeframes for the current price level. The va

MT5 Version Elliot Wave Oscillator MT4 Elliot Wave Oscillator MT4 is an indicator designed to support Elliot Wave counts. The default settings help filtering out the noise in the market allowing a clear perception for the waves counts in differnt timeframes. Elliot Wave Oscillator high customization level allows the you to optimize this indicator to your personal preferences. Shorter Periods and faster reactive MAs will provide more infomation but will require a higher level of experience for

Currency Correlation Plus is an expensive version of the indicator. It is equipped with the signal and is more equipped than its cheaper brother. The indicator helps us understand and see a correlation. Second chart makes it easy to analyze and trade multiple currencies. On the chart, you can post multiple pairs. Type in the selected currency pair in the settings and add it to the chart.
Inputs One indicator on chart=True / two or more=False Alert Signal buy and sell for first chart and second

Blahtech Fisher Transform indicator is an oscillator that displays overbought and oversold locations on the chart. The Fisher Transform algorithm transforms prices with any distribution shape into a normal distribution. The end result is a curve with sharp turning points that may help to identify bullish or bearish trends. Fisher Transform values exceeding 1.66 on the daily chart are considered to be good areas for reversal trades. Links [ Install | Update | Training | All Products ]
F

40% off. Original price: $50
Ichimoku Trend Finder is a multi symbol multi timeframe trend dashboard that helps traders to monitor and identify potential market trends from one chart. This panel scans the Ichimoku Kinko Hyo indicator in 28 configurable instruments and 9 timeframes for classic Ichimoku trend signals with a deep scan feature to scan all market watch symbols (up to 1000 instruments!).
Download Demo here (Scans only M1 and M5) Settings description here MT5 version here

This indicator shows the crossing between three moving averages (slower, middle and faster ones). When fast MA crosses up middle MA and middle MA crosses up slow MA, the bullish alert is issued. When fast MA crosses down middle MA and middle MA crosses down slow MA, the bearish alert is issued. Signals to close buy positions are generated if fast MA crosses middle MA downwards, signals to close sell positions are generated if fast MA crosses middle MA upwards.
Inputs Fast MA Setup MAPeriod1 = 5

This indicator provides the analysis of tick volume deltas. It calculates tick volumes for buys and sells separately, and their delta on every bar, and displays volumes by price clusters (cells) within a specified bar (usually the latest one). This is a limited substitution of market delta analysis based on real volumes, which are not available on Forex. The indicator displays the following data in its sub-window: light-blue histogram - buy (long) volumes; orange histogram - sell (short) volumes
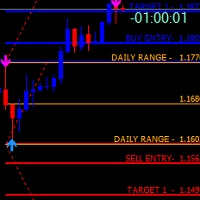
FiboZZ Trade Panel is trade assistants designed for manual trading and include account information panel with automatic drawing of ZigZag Extreme Arrows , Daily Fibonacci Extension with 3 levels for targets. You can use it with the following tow strategies or to use the indicators to create your own strategies. The information panel shows you: -Today and Yesterday Profits, -Balance, -Last Profit, -Last Open Lot Size, -All Open Buy/Sell Position and total lots , -Free Margin Level, -Equity, -24 h

TIL Multi RSI indicator applies RSI to 28 currency pairs all at once and displays the most current signal of each one in a two-column list. The currency pairs involved are the combinations of the eight major currencies (USD, EUR, GBP, CHF, JPY, CAD, AUD, and NZD). All the currency pairs are sorted automatically from the one with the highest signal down to the one with the lowest signal in a two-column list starting from the top left to the bottom right. Just a quick recap on what the Relative St

Currency Strength Meter is the easiest way to identify strong and weak currencies. This indicator shows the relative strength of 8 major currencies + Gold: AUD, CAD, CHF, EUR, GBP, JPY, NZD, USD, XAU. Gold symbol can be changed to other symbols like XAG, XAU etc.
By default the strength value is normalised to the range from 0 to 100 for RSI algorithm: The value above 60 means strong currency; The value below 40 means weak currency;
This indicator needs the data of all 28 major currency pairs

This indicator monitors the vital constants of your trading account to keep it healthy and away from excessive risks. It monitors all trades, absolute exposure, account floating point and leverage currently in use, using different color codes for your interpretation. [ Installation Guide | Update Guide | Troubleshooting | FAQ | All Products ] Amazingly easy to understand The indicator is clean and simple It calculates exposure by pairs and currencies Keep your used leverage controlled at all ti

The indicator generates early signals basing on ADX reading data combined with elements of price patterns. Works on all symbols and timeframes. The indicator does not redraw its signals. You see the same things on history and in real time. For better visual perception signals are displayed as arrows (in order not to overload the chart).
Features Easy to use. Filter configuration only requires selection of sensitivity in the " Sensitivity of the indicator " input.
Signals can be filtered using

Multi Timeframe Indicator includes a lot of functions and can be considered as a universal helper for a trader. It's main objective is to display up to 10 indicators at a time using just one small brick per each of them. These indicators involve Awesome Oscillator, CCI, DeMarker, MACD, RSI, RVI, Stochastic, Larry Williams' Percent Range, Bulls Power and Bears Power. An important function of the indicator is an ability to monitor signals from different timeframes. You can choose different combina

1. Compound Drawings (1) Line segment with arrow (2) Continuous line segment (broken line) (3) Parallelogram (4) Polygon (5) Profit and loss ratio measurement tools
2. Backtracking By the Z key in the process of drawing the line Line types that support Z-key backtracking: continuous line segments (broken line) ,channels,parallelograms,polygons, and fibo extensions.
3.Automatic Adsorption (1) Click the "Lock-Button" to switch the automatic adsorption switch before drawing the line (2) The
The indicator can be used with any time frame and forex pair. One easy to use parameter in the indicator will allow you to adapt the signals to any forex pair and time frame you want to trade.
The Arrows DO NOT REPAINT !
Information Panel: We've equipped this indicator with a user-friendly Panel. one side of the panel, the time frame is displayed, while on the other side, the currency pair is shown. Below that, the direction of the trend is identified, showing whether it is an uptrend or a d

The indicator calculates volume profiles dynamically and displays the result as VAL, VAH and POC curves.
Indicator features The indicator uses the historical data of the lower (relative to the current) timeframes for calculations: M1 - for timeframes up to H1, M5 - for timeframe H1, M15 - for timeframe H4, H1 - for timeframe D1, H4 - for timeframe W1, D1 - for timeframe MN. The color of the DPOC curve sections is determined by comparing the volume of the POC levels of all profiles that make up

Ichimoku Signals Dashboard To test the indicator please download demo version here. Find Ichimoku signals as easy as you can. Ichimoku is one of the most powerful trends recognition indicators. And it has valid signals for the trades. This indicator scans several symbols and time-frames by the Ichimoku to find all the signals that you want and show in a dashboard. It's easy to use, just drag it onto the chart. It's better to add Ichimoku indicator to chart before adding this indicator. Ichimo
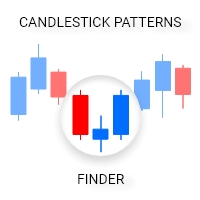
Candlestick Patterns Finder is a great tool to analyze candlestick charts. Indicator contains an advanced search algoritm and friendly graphic interface based on modified EasyAndFastGUI library. Has the ability to recognize 24 candlestick patterns. It was designed with the idea of simple and more efficient use of the indicator. It supports decision-making by automatically identifying candlestick patterns on the chart. The indicator has the ability to run in mode with and without a graphic

Contact me through this email address to download the FREE strategy PDF for this indicator tharindu999lakmal@gmail.com
Download MT5 version here -- >> https://www.mql5.com/en/market/product/119467
Introduction The "VIP Buy Sell Signals MT" is designed to provide BUY and SELL trade signals based on the current market conditions. A Trading Strategy (Chee sheet) has been provided for this trading indicator. (Read the description). This indicator has time tuned e ntry signals . so

Was: $99 Now: $49
Blahtech Daily Range indicator displays the average daily range alongside the individual session ranges. Using the daily open price as a reference the indicator shows fixed range and dynamic range targets as lines on the charts. These lines clearly show when the average range has been exhausted. Daily and session ranges can be useful for confirming entries or setting targets and is an excellent odds enhancer for many trading systems. Links [ Documentation | Install
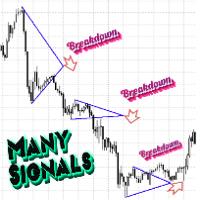
Индикатор уровней треугольник подскажет в какую сторону может двинуться цена при пробитии одной из них.
Если вы сомневаетесь в какую сторону торговать, то этот индикатор вы можете использовать как фильтр на любом инструменте и любом таймфрейме.
Индикатор разработан таким образом , чтобы помочь выявлять направление движения цены.
Стратегия построения прямоугольника работает по авторскому алгоритму нахождения определённых консолидаций.
Цена на индикатор минимальна для первых продаж.
Далее цена 99

This is an alert for when price is above the 200 ema, macd is below its zero line and the slow ma crosses above the fast ma and vice versa for sells. It has been tested 100 times as seen on youtube and has a 65% win rate on the 30 minute time frame.
I've attached a video to explain how to use it. Under the vuideo is a link to Trading Rush video where he tests the strategy 100 times on 30 minute.
(1) INDICATOR PARAMETERS
MA Period . Default is 200 MA Type . Default is

Fibonacci Sniper MT4 - No Repaint
Features:
- Indicator sends signals and notifications on key Fibonacci Retracement and Fibonacci Extensions Levels
- Once the buy/sell signal is set, targets ( TP1 TP2 TP3 )and stop loss levels are drawn by the indicator.
- Fibonacci Calculations and Custom Patterns are identified by the last 3 or 5 Zig Zag exterum.
- You can easily identify key harmonic patterns like Gartley, Bat, Butterfly and Crab patterns.
Important Settings: - Choose the Zig Zag Set

Buy with a discount of 75% for the unlimited licence the FOTSI! Offer valid from 01/04/2025 to 10/04/2025! Hurry Up & Rate the indicator!
FOTSI (Forex Overview True Strength Index) for MT4 FOTSI is an indicator that analyzes the relative strength of currencies in major Forex pairs. It aims to anticipate corrections in currency pairs following strong trends by identifying potential entry signals through overbought and oversold target areas. Theoretical Logic of Construction: Calculation of Indi
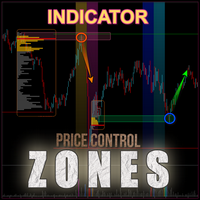
The Bull and Bear Zones indicator is specifically designed for the automatic identification and visual display of support and resistance zones directly on the chart. Its unique algorithm allows it to display not only the zones already tested by the market but also potential target zones that have yet to be tested. The indicator tracks ranges where an imbalance between supply and demand is observed. Key Features: Automatic identification of support and resistance zones : The indicator calculates
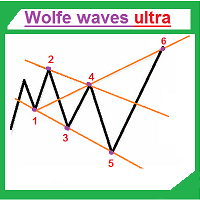
Wolfe waves ultra draws Wolfe Waves automatically. The indicator searches for the Wolfe Waves on three timeframes. This indicator is especially accurate because it waits for a breakout in the wave direction before signaling the trade, resulting in a very high winning ratio.
Features Amazingly easy to trade. The indicator is able to recognize all Wolfe Wave patterns in a specified interval. Thus, we check each extremum for the potential 1,2,3,4,5 points apart from ZigZag vertices. The indicator
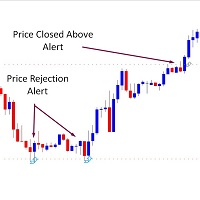
*** Introductory Offer! *** Ends soon - do not miss it! The Price Alerts 3 in 1 Indicator is part of my suite of Price and Trendline Alerts Indicators. I'm excited to introduce the Price Alerts 3 in 1 Indicator – part of my new suite of Price and Trendline Alert Indicators – fantastic tools designed to: … alerts you when 1. candles close above or below significant prices 2. price breaks above or below significant prices 3. price rejects significant prices in the markets you trade. With t
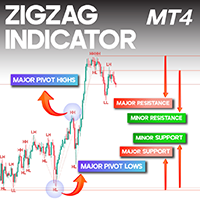
ZigZag with Labels Indicator for MT4
The ZigZag with Labels indicator for MetaTrader 4 highlights key turning points on a price chart where notable fluctuations occur, linking these points to help traders identify market trends. Additionally, it marks pivot points where price direction shifts. These pivots, also referred to as reversal points, arise due to the interaction between supply and demand. There are two main pivot types: major pivots, which indicate substantial price reversals, and min

API TicksVolume mtf - Volume Analysis for Trading The API TicksVolume mtf indicator is a tool for traders who want tick volume analysis to make trading decisions. Designed for MetaTrader 4 , this multi-timeframe (MTF) indicator provides tick volume data with color-coded visual cues , helping traders assess volume strength and possible volume direction across different timeframes. Key Features: Multi-Timeframe Analysis: Monitor tick volume from different timeframes in real time for a broader
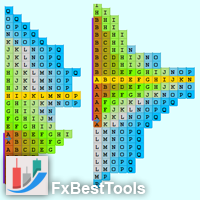
Definition : A Market Profile is an intra-day charting technique (price vertical, time/activity horizontal). Market Profile is best understood as a way to see order in the markets. Market Profile was a way for traders to get a better understanding of what was going on, without having to be on the trading floor. The current indicator is developed based on Easy-to-Use architecture including a wide range of visual settings.
Major Features of Indicator : Various Views of Market Profile The indicat
Special offer! https://www.mql5.com/ru/users/bossik2810
Signal Trend Super Indicator of accurate market entry.
Very good entry indicator for your trading system, I recommend to use it together with - System Trend Pro and Professional Trade Arrow
The indicator does not redraw and does not change its data. Wait until the candle closes.
Any questions? Need help?, I am always happy to help, write me in private messages or
In Telegram

Introduction The "Two Moving Average Crossover" indicator for MetaTrader 4 (MT4) is a technical analysis tool that displays two moving averages and notifies when the moving averages cross each other. The indicator calculates and plots two moving averages, one of which is faster and the other is slower. When the faster moving average crosses above the slower moving average, it is considered a bullish signal, indicating a potential trend reversal or the start of a new uptrend. Conversely, when th
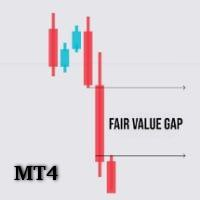
FVG Analyzer – The Ultimate Tool for Precise Fair Value Gap (FVG) Detection FVG Analyzer is a powerful and fully customizable indicator built for serious traders who leverage Fair Value Gaps (FVG) in their strategies. With smart detection and clean visuals, this tool allows you to quickly identify market inefficiencies—areas where price is likely to return before continuing in its trend. Key Features: Automatic Detection of Fair Value Gaps (bullish and bearish) based on candlestick patt

Binary Win 60 Description of the Binary Win 60 Indicator for MT4 Binary Win 60 is a professional tool for binary options trading, designed to operate on the M5 (5-minute) timeframe. The indicator is ideal for trading popular currency pairs, such as: AUDCAD, AUDNZD, CHFJPY, EURCAD, EURAUD, EURCHF, EURGBP, EURNZD, GBPAUD, GBPJPY, GBPUSD, USDJPY. Key Features: Clear arrow signals: Green arrow — Buy option signal. Red arrow — Sell option signal. Instant alerts: When a signal appears, the in

Qv² OBOS is an indicator that aims to identify overbought and oversold regions considering price standard deviation and volume analysis.
Oversold signals are indicated by arrows pointing upwards.
Overbought signals are indicated by arrows pointing downwards. Can be used in all timeframes. Can be used on all pairs. I use in H1 Important note, the histogram is displayed to improve the trader's analysis. But the signs of overbought and oversold are the arrows as mentioned above.
Important note:

Currency Strength Gauge incicator
The currency strength gauge is an indicator to measure of the strength or weakness of currencies in the Forex market. Comparing the strength of currencies in a graphic representation will lead to a good overview of the market and its future trends. You will see in a graphic chart both the strength of the currencies and their correlation, and this will help you in your decisions to get better trades. -To easy detection of over Overbought and Oversold points,

Данный индикатор отмечает участки разворота тренда, в точках разворота давая сигнал на вход в рынок в виде стрелок соответствующего цвета и направления движения в виде линий, а также звукового оповещения. Основан на закономерностях рынка FOREX, точных определениях текущего экстремума и нахождения свечных моделей на вершинах/низах рынка. Универсальный алгоритм помогает определить точки разворота указывая стрелками где осуществить вход в рынок. Дополнительно Индикатор не перерисовывается. Выводит
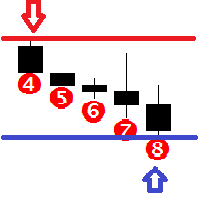
Features This indicator determines consecutive bullish and bearish bars; Determines the High and Low for the last N bars (N can be changed in the settings); It shows the Buy and Sell signals based on the values of other indicators, such as Bollinger Bands, Stochastic and MACD; It graphically displays from 4 to 12 consecutive bullish and bearish bars with an alert; It is possible to disable the alert and unnecessary graphical elements; It is also possible to adjust the number of bars in history,

Определение текущей тенденции - одна из самых важных задач трейдера независимо от стиля торговли. Индикатор Speed Trend поможет с достаточно высокой вероятностью это сделать. В расчетах индикатора используется авторская методика. Speed Trend подходит для любой валютной пары, любого таймфрейма, и не меняет свои показания. Индикатор очень просто в настройке, что является хорошим преимуществом для исследований.
Параметры
Основные настройки ( Main Settings ): IndicatorPeriod - период для рас

The Future Price indicator shows the probable variants of a future price movement based on the searching for matches in the quotes history. The indicator works in two modes: the first iterates over and displays the specified number of variants, the second - the indicator displays one specified variant.
Settings Static_VARIANTS = 0; - display a specific variant; if = 0, iterates over all variants TOTAL_VARIANTS = 20; - the number of variants in the set, not greater than 30 is recommended Time_Se

Price Predictor is an indicator that shows precise price reversals taking into account a higher time frame and a lower time frame candle patterns calculations it is great for scalping and swing trading . Buy and sell arrows are shown on the chart as for entry signals. BIG Arrows indicates the trend - SMALL Arrows signal a trade (BUY/SELL) - A Green BIG UP Arrow with a support green line indicates a Bull Market : wait for buy signal - A Green SMALL Up Arrow after a BIG green arrow is

The Buyside & Sellside Liquidity indicator aims to detect & highlight the first and arguably most important concept within the ICT trading methodology, Liquidity levels. SETTINGS
Liquidity Levels
Detection Length: Lookback period
Margin: Sets margin/sensitivity for a liquidity level detection
Liquidity Zones
Buyside Liquidity Zones: Enables display of the buyside liquidity zones.
Margin: Sets margin/sensitivity for the liquidity zone boundaries.
Color: Color option for buysid

Kumo Breakout Indicator is a trading system based on Ichimoku Kumo levels.
Parameters
Trader can set Ichimoku parameters like: Tenkan-Sen (tk) Kijun-Sen (kj) Sekou-Span-A (ku) that are the classic parameters allowed on Ichimoku indicator on Metatrader.
Other interesting parameters: "Configure Alerts" PopUpAlert= true or false PushAlert=true or false Mail= true or false and personalized texts for eMails: TextMailUp1="WP Buy "; TextMailUp2="WP Buy write here your text"; TextMailUp3=""; TextM
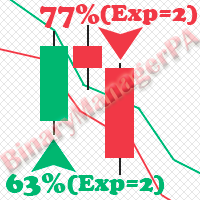
BinaryManagerPA is an indicator for binary options based on the analysis of the Price Action and indicator setups using complex filters. The main advantage of the indicator is that it estimates the current state of the market in advance with using several expiration times. As a result, the indicator generates the statistics on the percentage of successful trades (WinRate) for the selected instrument and timeframe. In addition, the indicator displays the win rate and the recommended expiration fo

Overview: The Candle Pattern Weekly RSI is a powerful MT4 indicator designed to detect high-probability trade setups on the 1h -timeframe chart while aligning with the weekly trend . It filters signals using a unique three-candle pattern and other Pri ce actions , a minimum price move from the weekly open , and RSI confirmation to enhance accuracy and reduce false signals. Key Features: Weekly Trend Confirmation: Only takes buy trades when the Weekly candle is bullish and sell trades when i

Description Candle Power Color indicator which shows when the market is trending and when it is in a sideway movement KEY LINKS: How to Install – Frequent Questions - All Product How is this indicator useful? It allow to detect trend and sideway movements in market NEVER repaints. It adapts to any market and asset. It can support any other trading strategy. Note 1: This indicator should only be considered as a part of any trading strategy. You should complement this with other filters (e.

The indicator displays Renko bars on the chart and uses them to plot the ZigZag - trend lines connecting the local Lows and Highs of the price movement. Renko - specialized display of the price action, in which the graph is displayed not every bar of the time frame, but only under the condition that the price had passed more than the specified number of points. Renko bars are not bound to a time frame, so the indicator can work on any time frame with the same efficiency. This implementation of t

Naked Forex Kangaroo Tail Pro Indicator Kangaroo Tail Pro Indicator is a pattern recognition indicator for Forex, Stocks, Indices, Futures, Commodities and Cryptos.
The Kangaroo Tail is a multi-bar pattern.
The Kangaroo Tail pattern is very effective and is very simple to trade.
The strategy that comes with the Kangaroo Tail is based on price action.
The indicator does what it was designed for: displaying Kangaroo Tail patterns. Don't expect to follow the up and down arrows and make money

OneWayTicket indicator is based on CCI indicator. In fact, it analyzes multiple CCIs from several timeframes. There are four Ways of OneWayTicket, read from left to right - 15 min, 30 min, 1 hour and 4 hours. The idea is to enter the market when all four CCIs agree on a trend. A trader chooses which timeframes to monitor. When all four ways of the OneWayTicket are green - Buy . When all four ways of the OneWayTicket are bright red - Sell . Original idea from the author: tageiger, revised for the

Bermaui Pin Bars
Or (BPB) is an indicator that finds Pin Bars price action pattern on the chart. Pin Bars is a shortcut for "Pinocchio Bars" which is a classic bar pattern alternative to Japanese candlesticks with tall upper or lower shadows and very small bodies like Hammer, Inverted-Hammer, Hanging Man, Shooting Star, Dragon Fly Doji or Grave Stone Doji. Bermaui Pin Bars indicator find this pattern depending on a formula that can be explained in the next steps:
At first BPB calculate the ce

The idea of this indicator is to draw RSI in the form of candles that can be compared with price charts to generate buy and sell signals. The indicator is not my invention. I founded it on the internet several years ago. I updated the code, added alert functions, added the Bermaui Utilities group of tools.
The indicator calculates the RSI of all the prices that are used to draw candlesticks (RSI of the open, high, low & close). It uses the highest of them to draw the RSI candles high wick & the

Important notice! This indicator does not automatically select waves. This is your job.
Features: calculate risk calculate position size mark Elliott waves mark Fibonacci levels change object parameters
Input parameters: Keyboard shortcuts - enable/disable keyboard shortcuts External capital - fill in if you do not keep all your capital in broker account. The risk will be calculated from the sum of the broker account and external capital. Select object after create - if true, then every create

The Liquidation Estimates (Real-Time) experimental indicator attempts to highlight real-time long and short liquidations on all timeframes. Here with liquidations, we refer to the process of forcibly closing a trader's position in the market.
By analyzing liquidation data, traders can gauge market sentiment, identify potential support and resistance levels, identify potential trend reversals, and make informed decisions about entry and exit points.
USAGE (Img 1) Liquidation refers

Pattern Finder is a MULTICURRENCY indicator that scans the entire market seeking for up to 62 candlestick patterns in 15 different pairs/currencies all in one chart! You can also filter the scanning by following the trend by a function based on exponential moving average.
Indicator parameters Alerts ON/OFF: Alert on screen ON/OFF : enables or disable screen alters. Notification by email ON/OFF : enable or disable email alerts. Push notification ON/OFF : enable or disable push notification on mo

Buy Sell Zones Simple indicator for BUY / Sell Zones moving Buy and Sell zones : Closest zone is wide and clear : Red for Sell zone , Green for Buy zone >>> old far zones are in bold lines :::BUY Zones (GREEN) appear only in UP Trend and disappear in DOWN Trend :::SELL Zones (RED) appear only in DOWN Trend and disappear in UP Trend input parameters ::: index bars : bars range for zone calculation levels : number of zones Up move/Down move arrows mail and message Alerts !! used on any symbol u

Features This is an indicator that recognizes a special type of Inside Bar formation which is formed by a Master candle followed by 4 smaller candles (please see the strategy explanation below). Plots buy/sell stop lines on the chart as well as well as take profit and stop loss levels. The TP/SL levels are based on the Average True Range (ATR) indicator. Object colors are changeable. Sends you a real-time alert when a Master candle formation is identified - sound / pop-up / email / push notifica

Price Action Breakout is one of the most popular trading strategy. This Price Action Breakout indicator is designed using several indicators combined to be one strategy. It is very useful for traders that trade based on the breakout strategy. It will make it easier to identify the support and resistance levels. This Price action indicator will draw the support and resistance levels on the chart, so it will make it easier to identify the support and resistance levels. It will inform about the sup

https://www.mql5.com/en/users/earobotkk/seller#products FIBO ARROW This indicator draws a Fibonacci Retracement based on daily time frame. It draws arrows, sends pop-up alert and phone notification whenever price crosses Fibonacci levels. This tool is useful for users who trade with Fibonacci. INPUT ON Alert: set to true will pop-up alert whenever arrow appears. ON Push: set to true will send phone notification whenever arrow appears. ===== FIBO(High & Low)===== Time Frame: Fibonacci is drawn f

Smart and simple Indicator based on wolves waves reversal pattern also near to falling and rising wedge and butterfly patterns with Stoploss and entry signal preferred time frame M30 : with parameters bars count used for calculation = 200 and moving average for accuracy = 100; you can try it for other higher or lower parameters and try your own set of inputs higher timeframe = lower input !!! important note ::: Indicator don't back draw when first installed on Chart
once installed wait for new

Simple indicator for BUY / Sell Zones moving Buy and Sell zones : Closest zone is wide and clear : Red for Sell zone , Green for Buy zone >>> old far zones are in bold lines :::BUY Zones (GREEN) appear only in UP Trend and disappear in DOWN Trend :::SELL Zones (RED) appear only in DOWN Trend and disappear in UP Trend input parameters ::: index bars : bars range for zone calculation levels : number of zones Up move/Down move arrows mail and message Alerts !! used on any symbol used on any timefr

Crazy Dancing moving RES/SUP Levels Automatic redrawing of moving Supports and resistances levels to indicate price breaking supports (signal SELL) or breaking resistance levels (signal BUY) Very simple appearing indicator but very clever and smart too !!!! Main Inputs: # of bars for the support and resistances levels + the initial shift from start + moving average for filter signaling Smaller values for bars /shift inputs when using Higher Time frames (D1-H4) and the reverse higher values for
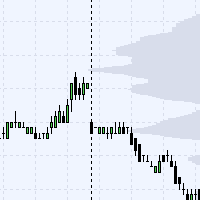
This indicator is showing level's density prices on background's graph.
Theses levels are showing the prices that are the most traded by the market. This means that these levels can be used in order to place stoploss or takeprofit for swing orders, or for scalping manually in short time periods. This gives a statistical advantage as these levels are more likelely to be reached or pullbacked by the market. It is also usefull on VIX for example to determine when to enter local low volatility.
T
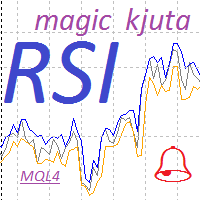
Индикатор RSI magic kjuta.
Пользовательский Индикатор ( RSI magic kjuta ) на основе стандартного Индикатора Силы ( Relative Strength Index, RSI ) с дополнительными настройками и функциями. К стандартной линии RSI добавлены линии максимального и минимального значения RSI на графике. Теперь можно визуально наблюдать прошедшие максимумы и минимумы RSI , а не только значения по закрытию баров, что позволяет избежать путаницы при анализе торгов. Например, советник открыл или закрыл ордер, но на

This is a multi-timeframe (MTF) indicator displaying support and resistance lines. Support and Resistance lines are calculating automatically from three higher timeframes (TF). Traders may use Support and Resistance to enter positions and update a Stop Loss value.
Input Parameters bPeriod - use this parameter to optimize indicators for each timeframe; VisibleBars - for how many Bars (from the current one) the indicator's lines will be visible. Any changes are possible.

At the very least, this indicator is able to entertain you. It builds a moving line based on interpolation by a polynomial of 1-4 powers and/or a function consisting of a sum of 1-5 sine curves. Various combinations are possible, for example, a sum of three sine curves about a second order parabola. The resulting line can be extrapolated by any of the specified functions and for various distances both as a single point at each indicator step (unchangeable line), and as a specified (re-painted) f
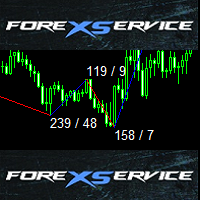
This is standard ZigZag indicator with some cool additional features - colored range, amount of pips between highs and lows and also amount of candles between indicator range.
Default ZigZag indicator variables depthZigZag deviationZigZag backstepZigZag
Bullish market variables lineUpColor - line color lineUpStyle - line style lineUpWidth - line thickness textUpColor - color of text with amount of pips and candles textUpFont - font of text with amount of pips and candles textUpSize - size of t

SMOOTH STRENGTH METER INDICATOR (SMOOTH LINE) it draws Currencies TREND Volatility Power / Strength lines : - Detects the 2 highly TRENDED Volatile pairs ( will be the Bold Lines ) - A very Helpful Indicator - It draws smooth lines for up to 20 currencies pairs representing Volatility strength and power - First it indicates the most powerful trended direction pairs : Strongest / Weaker - MAIN FUNCTION :it gives indication of the UP trend most Volatile Line and the DOWN

This scanner is monitoring the entire market for trade opportunities for all symbols and for all time frames. You don't have to look to all the charts, for all symbols and for all time frames. This scanner will alert you on your computer, or on your mobile, when a trade opportunity has been found. You never have to miss a trade opportunity! This indicator is designed to scan all pairs and symbols, for all time frames, to find a cross of the MACD main and signal line. MACD Definition
The
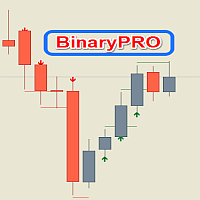
BinaryPRO- is a multi-currency and multi-timeframe signal indicator, created according to the author's algorithm. It produces high-quality and timely trading signals in the form of arrows on any financial assets traded on Meta Trader 4. It is a good alternative to paid signal services. The indicator can be used with any broker (with 4/5-digit quotes). The received trading signals can and should be used when trading binary options and cryptocurrency.
Advantages of BinaryPRO: accurately shows the

Identify over 30 candlestick patterns with precision
This indicator recognizes over 30 Japanese Candlestick Patterns and highlights them beautifully on the chart. It is simply one of those indicators price action traders can't live without. [ Installation Guide | Update Guide | Troubleshooting | FAQ | All Products ]
Boost your technical analysis overnight Detect japanese candlestick patterns easily Trade reliable and universal reversal patterns Hop onto established trends safely using continua
MetaTrader Market - trading robots and technical indicators for traders are available right in your trading terminal.
The MQL5.community payment system is available to all registered users of the MQL5.com site for transactions on MetaTrader Services. You can deposit and withdraw money using WebMoney, PayPal or a bank card.
You are missing trading opportunities:
- Free trading apps
- Over 8,000 signals for copying
- Economic news for exploring financial markets
Registration
Log in
If you do not have an account, please register
Allow the use of cookies to log in to the MQL5.com website.
Please enable the necessary setting in your browser, otherwise you will not be able to log in.