Смотри обучающее видео по маркету на YouTube
Как купить торгового робота или индикатор
Запусти робота на
виртуальном хостинге
виртуальном хостинге
Протестируй индикатор/робота перед покупкой
Хочешь зарабатывать в Маркете?
Как подать продукт, чтобы его покупали
Платные технические индикаторы для MetaTrader 4 - 15
Developed to assist in binary options retracement operations, this indicator will show the assets with the best retracement percentages!
How it works: The indicator will calculate the total length of each candle from low to high, the total of the body and total of shadows (up and down) and calculate a total shadows percentage of various configurable assets. The counter is updated with each new candle.
ATENTION: Demo on the estrategy tester is not functional to show multiple assets.

Weddell Pro хороший торговый инструмент который подойдет как для новичка так и для опытного трейдера. С ним можно работать как отдельно так и совмещать с другими стратегиями и индикаторами Настроен для валютных пар несколько раз тестировался на криптовалюте но высокого результата не показал Валютные пары USD/EUR AUD/CAD GBP/USD Очень хорошо себя тут показал Процент правильных сделок выше 68% что не делает его идеальным и плохим Не рисует и не пропадает Красная стрелка показывает сделку на низ С

Graphic Shapes -используя историю,проецирует в текущий момент четыре вида графических фигур, позволяющих определить основные диапазоны движения цены в будущем,а так же даёт понимание основных разворотов рынка ,при этом давая точки входа по приоритету!В панели расположены три вида величины фигур выраженные таймфреймами. Позволяют проводить полный анализ рынка,не используя дополнительные инструменты! Индикатор является мощным инструментом прогноза движения цены на рынке форекс!

Это мультивалютный и мультитаймфреймовый индикатор, который рассчитывает угол между двумя точками. Точки, для измерения угла, могут браться из индикатора ЗигЗаг (две последние точки), или из индикатора Moving Average (между двумя указанными барами), или это могут быть цены закрытия баров.
Измерение угла возможно в градусах или в радианах. Можно выбрать масштаб для расчета. Для лучшего понимания работы индикатора, вы можете изучить бесплатный индикатор Angle High Low . В параметрах вы можете

При покупке индикатора свяжитесь со мной, чтобы получить от меня индикатор подсветки цены -Heir Wolf TF.
Heir Wolf TF очень интересный индикатор и я даю его в виде бонуса. Видео можно посмотреть здесь . Только один этот индикатор может поднять всю вашу торговлю на новый уровень. А вместе с индикатором Trade Compass10 это станет для вас основной торговой системой, и вы на несколько шагов опередите других трейдеров. Trade Compass10 - предельно простой и понятный индикатор для тре

Индикатор Quality trend выражает отношение силы тренда или скорости его роста (падения) к степени его зашумленности или определенной норме амплитуд хаотичных колебаний растущей (падающей) цены. Расположение линии индикатора выше нуля показывает возрастающий тренд, ниже нуля - падающий тренд, колебание линии индикатора вблизи нуля показывает флет. Если линия индикатора начинает быстро колебаться около нуля и приближаться к нему, то это свидетельствует о скором начале трендового движ

This system is currently set for a multi time period. Examines the candles with a formula. The right time also notifies you. You can gain earnings using this system. Re-painting, feature is not available. Several indicator data, channel width and candlestick shadows are calculated. You can adjust the settings according to different time periods by trying the settings. The green line is the "take profit" level.

This indicator guides you like a hunter. Tacheprofit and StopLoss levels. See the difference in the experiment. Works in all periods. Works at all rates. You can win with this system. The crossing of the mean and the re-test were done according to the rule. You can see the transactions by moving backwards on the strategy test screen. The whole system is automatically calculated.

This is a simple PriceTMA bands, non repaint! it can be used for a trend following system or sometimes reversals. as a main signal or a filter for others strategies, it depends on the trader main strategy. calculations for this indicator are a combined Algorithm between moving averages "MA" and average true range"ATR". good luck with your trading! i hope it is helpful Cheers
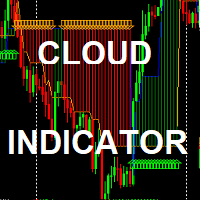
The Simple Cloud Indicator : (FREE limited time for evaluation) Strategy: Strategy is based on moving averages indicator in addition to support /resistance levels crossing *It works on any timeframe *it works on any symbols *it generates alerts *it draws uptrend / Downtrend clouds and BUY/SELL arrows inputs : *drawn start point ( in bars): not affecting strategy - it just gives you indicator history depth *alerting enable/disable

九转序列,源自于TD序列,是因TD序列的9天收盘价研判标准而得名。 汤姆·德马克(Tom DeMark)技术分析界的着名大师级人物,创建了以其名字首字母命名的TD系列的很多指标,价格反转的这个指标就是其中重要的一个,即TD序列。 德马克原版TD序列指标要复杂一些,想研究就自行看关于德马克的资料吧。 这里只说简单的TD序列(九转序列)。 九转序列分为两种结构,低九买入结构和高九卖出结构。 TD高九卖出结构:连续出现的九根K线,这些K线的收盘价都比各自前面的第四根K线的收盘价高,如果满足条件,就在各K线上方标记相应的数字,最后1根就标记为9,如果条件不满足,则K线计数中断,原计数作废重新来数K线。如出现高9,则股价大概率会出现转折。 TD低九买入结构:连续出现的九根K线,这些K线的收盘价都比各自前面的第四根K线的收盘价低,如果满足条件,就在各K线下方标记相应的数字,最后1根就标记为9,如果条件不满足,则K线计数中断,原计数作废重新来数K线。如出现低9,则股价大概率会出现转折。
结构的本质是时间和空间的组合,时间是横轴,空间是纵轴,不同的时间周期和空间大小的组合,形成不同的结构形态,不同

If you want to know what will happen in the future of the chart, you are in the right place. This indicator allows you to predict the future of the market with advanced computational methods and make the right deal by knowing the support and resistance points and receiving timely buy and sell signals. What does "Tendency" indicator show us? 1. Prediction line: Using mathematical calculations, the price is predicted in different timeframes and is interconnected. This means that based on the previ
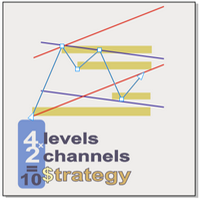
Supply and demand In all indicators that have the task of drawing support and resistance, the number of levels is so high that it causes a trader to make a mistake. We draw the last 4 important and valid levels for you using the Price Action method These surfaces are not easily broken and their breaking is done with long and powerful candlesticks Sometimes traders draw levels and wait for the price to reach those levels, but new levels may be created between the previous two levels in the f

''Trendlines'' is an Indicator, that every Trader need and shows Trendline and Support and resistance levels in all Timeframe's. Also In 1-hour, 4-hour and daily time frames and Current timeframes, support, and resistance levels are specified and trend lines are drawn so that the trader can see all levels on a chart. In Properties it is possible to turn off unnecessary Lines.
In ' Tendency indicator '' , as full package of Predictions that every Trader need, there is also the Predic
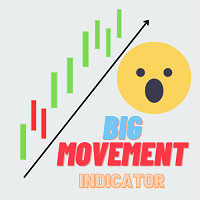
Big movement indicator is a very simple indicator which draws a pattern of boxes where price has moved significantly on a particular timeframe. It also displays the number of candles the strong movement is continuing till now. This indicator work based on zig zag indicator when there is a minimum gap between the last 2 zigzag values we draw a box around this. We can also capture the point where it meet the criteria as buffer values

A percent graphic is a type of graph or chart used to represent data as a percentage of a whole. Percent graphics are often used to illustrate how a given set of data is distributed between different categories or how certain trends have changed over time. Percent graphics can be used to show the composition of a dow jones , or the performance of a company over a given period of time d1 percet w1 perncet m1 percent y1 percenty
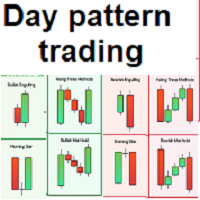
Simple and effective indicator based on some candle patterns recognition Arrows appear on candles when bear signal / bull signal based on candle pattern recognition -----> TWO strategies available you can enable / disable one of them Indicator can work on any chart and time frame I prefer to work on high time frames especially the Daily charts D1 and H4 Red arrows appears above candle showing a bear signal after candle completed - arrow will be blue during candle formation Green arrows appears b
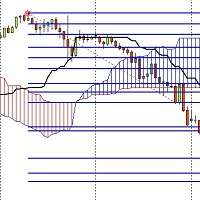
I have developed an indicator based on both the fibo musang strategy and the price breaking of the ichimoku cloud and it has amazing results
the features are:
1- Once activated it give you the trend where you are from the chart
2- After a trend change it gives you an alert on PC or notification on your phone if you are away.
3- It sends you the exact prices to take an order and 3 take profit levels and your stoploss.
4- It works on every timeframes from 1m to MN.
5- It works on pairs

^With Mixin Combiner.
^You Can Combine 10 Indicators Together To Make One Arrow In The End
^You Can Filter Time You Want To Trade.
^You Can Control Which Candle Arrow Apear On It " Bullish Or Bearsh".
^There Is An Statistics To Can Filter "What success rate of the indicators you Combined? ".
^You Also Can Control The Appearance Of The Arrows At Any Time Of The Candle , "Is It In The Beginning Or At Any Time In Particular? ".
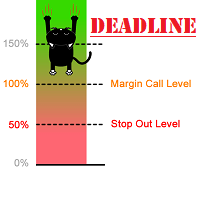
The indicator can display Stop Out, Free Margin and Margin Call lines on the chart. Y ou can also set your own line at the custom level.
Displaying these lines on the chart is especially useful for people who trade with high leverage or go all-in, where the risk is very high. You can adjust the line color, style, thickness and visibility ( for each one separately). The last parameter that can be changed is the refresh interval. If you have open orders on several stocks, the line levels will c

The SuperTrend indicator is a popular technical analysis tool used by traders and investors to identify trends in the price of a financial instrument, such as a stock, currency pair, or commodity. It is primarily used in chart analysis to help traders make decisions about entering or exiting positions in the market. this version of super trend indicator is exactly converted from trading view to be used in MT4
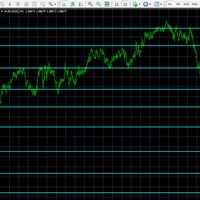
A powerful chart indicator which intelligently analyses Index, FX & Commodity prices to identify the strongest support and resistance price boundaries. Each line shows where prices consistently close, while the frequency of these matching prices is quoted to reflect each boundary strength. Use these predictive boundaries to identify pivot points, resistance and support levels for crossover, trending, reversal and channel strategies. For FX pairs, set volatility filter = 1 For Indices & Commodi

The Prop Trading Scalper indicator is a tool used for manual traders to assist in passing prop trading challenges, which are evaluations set by proprietary trading firms to determine a trader's skill and discipline. This indicator is particularly designed for scalping, a strategy that involves making numerous small trades to capitalize on minor price movements.
Индикатор I Special ZigZag отмечает на графике максимумы и минимумы 3-х порядков, а именно краткосрочные , среднесрочные и долгосрочные и соединяет их линией подобно ZigZag без перерисовки. Идея построения индикатора взята из книги Ларри Вильямса "Долгосрочные секреты краткосрочной торговли" и адаптирована под современный рынок. В настройках индикатора можно задать нужную толщину и цвет для каждого вида экстремума для удобства восприятия на графике цены. С помощью данного индикатора легче понять

The indicator helps the trader in identifying potential liquidity levels. The algorithm used in this indicator checks the behavior of the asset taking into account the price levels, momentum and volume analysis.
Features:- Parameters for signal optimization and alerts.
Usage:- The levels formed by the indicator can be helpful to traders in identifying potential entries, breakouts or reversals. it can assist traders of technical trading background or even pure price action trading. Examples o

MACD is probably one of the most popular technical indicators out there. When the market is trending, it actually does a pretty good job, but when the market starts consolidating and moving sideways, the MACD performs not so well. SX Impulse MACD for MT5 is available here . Impulse MACD is a modified version of MACD that works very well for trading Forex, stocks, and cryptocurrencies. It has its own unique feature which perfectly filters out the values in a moving average range and enables it t

Previous Period High Low . This indicator shows the previous Day, Week, Month and Years High and Low. It's great for price action strategies. : Provides clear and visible breaks in structure. : Easy to see breakout levels. : Easy to see gaps between previous high, low levels after breakouts have occurred. The indicator works on every time frame. Multiple periods can be selected and be seen on the same chart. Every line can be customized to Your liking. Color, style and thickness. Enjoy!
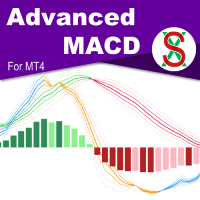
MACD ( M oving A verage C onvergence/ D ivergence) is a widely used indicator in technical analysis. What makes the MACD such a valuable tool for technical analysis is that it effectively combines two indicators into one. It can help to identify trends and measure momentum simultaneously. SX Advanced MACD for MT5 is available here . SX Advanced MACD indicator takes this concept further by plotting two distinct MACD indicators on a single chart, facilitating clear visual correlation between each

Auto Fibonacci Button The Fibonacci retracement is a popular and reliable technical analysis tool for traders to determine support and resistance areas. It employs the "Golden Ratio," a mathematical pattern seen throughout nature and even the universe, to forecast particular levels of support level and resistance level. This tool is generated in technical analysis by dividing the vertical distance between two extreme points on the chart (typically a peak and a low) by the important Fibonacci

A flexible 2-Line MACD indicator The default MACD indicator inside MT4, limits you to using the MACD with a fast-EMA, slow-EMA, and signal-SMA. This MACD indicator allows you to set your own MA-Method choices for these 3 components, separately! You can select from SMA-EMA-SMMA-LWMA-DEMA-TEMA, and can even use a separate method for each 3 fast-slow-signal periods. On-chart colored candles, with drawing condition types is included, with a show/hide button too.
Features - MA Methods: SMA, EMA, S

Presenting the uGenesys Break of Structure and Change of Character Indicator The uGenesys Market Structure Indicator is the advanced solution designed specifically for forex traders seeking a competitive edge. This innovative tool goes beyond merely identifying Break of Structure (BoS) and Change of Character (CHoC); it also illuminates optimal entry and exit points on your forex charts, transforming your trading experience.
While the uGenesys Market Structure Indicator can reveal pivotal pa

Please feel free to contact me if you need any further information.
Please let me know if you have any questions.
I hope the above is useful to you. MT MERIT PullBack : It is an indicator created to find pullback signals filter trend. Use a complex method to find signals.
Suitable for short-term profit, able to make profit in many cycles. Suitable for people who trade by yourself, do not use with ea (non auto trade)
manage risk management by yourself (Stop Loss,TP, Risk Reward, ...)
and

The indicator shows buy and sell signals. The " CounterTrend 4 " is designed to recognize profitable counter trend patterns from your chart. Features: The CounterTrend 4 is a Counter-Trend Trading with Simple Range Exhaustion System. Signals based on the daily trading range. The indicator calculates the trading range for the last few days and compare the price movements on short time intervals and generating short term reversal points. This is a leading indicator. It works on any instruments.
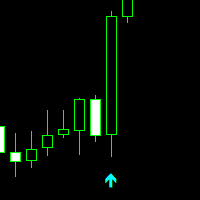
Professional Trade Arrow
Non-repaint MT4 technical indicator.
works on all timeframes 1 minute to the monthly timeframe
the trade vision buy and sell arrow is a multi currency and synthetic indicator
Aqua arrow look for selling opportunities
Crimson arrow look for buying opportunities.
wait for candle to close and arrow to appear before taking any trades.
Settings: Key value - 3.0 ( This parameter is adjusted for a better signal.) We recommend a trend indicator - Trend

The GGP Williams Vix Fix MT4 Indicator is based on the volatility of the market and grants a huge support for finding out when a correction is coming to end. This indicator is MT5 conversion of the CM_Williams_Vix_Fix Finds Market Bottoms Indicator by “ChrisMoody “ in Trading View website and some alert methods are added to provide real-time alerts when a trading signal is generated, in order to allow traders to act quickly and efficiently. For MT5 version please click here . Larry Williams

Индикатор для определения паттерна "Дракон". Индикатор сделан на основе зигзага. Во вкладке цвета можно увидеть буфер 0 без цвета, если ему установить цвет, будет виден зигзаг. При выявлении паттерна предполагающего дальнейшее движение вверх индикатор рисует стрелку вверх, аналогично, при выявлении паттерна предполагающего дальнейшее движение вниз индикатор рисует стрелку вниз. Параметры: Alerts - Включение алертов при появлении стрелки. Push - Отправка Push уведомления при появлении стрелки (т

Целью этой новой версии стандартного MT4 индикатора, входящего в поставку платформы, является отображение в подокне нескольких таймфреймов одного и того же индикатора и его расхождений. См. пример, приведенный на рисунке ниже. Однако индикатор отражается не как простой индикатор MTF. Это реальное отображение индикатора на его таймфрейме. Доступные настройки в индикаторе FFx Divergences: Выбор таймфрейма для отображения (от M1 до MN) Установка ширины (количество баров) для каждого окна таймфрейма

Этот индикатор создан в качестве расширения и обобщения M и W волновых фигур А. Меррилла. С помощью 5 экстремумов или 4 отрезков зигзага легко построить M или W фигуру в любом месте истории котировок. В классическом подходе различные конфигурации волн зигзага сведены в предопределенный набор фигур, которые допускают превращения по особым правилам — и это позволяет предсказывать последний отрезок зигзага. В отличие от этого, данный индикатор анализирует доступную историю и строит статистику всех

Volume DeltaPanel - это мощный индикатор, распознающий предложение на рынке. Он рассчитывает дельту от движения цены и разницу объемов ПОКУПОК и ПРОДАЖ. Объемы прибавляются к цене и нормализуются в пункты символа. Его особая структура позволяет вам применять все таймфреймы, имеющиеся на платформе MT4. Панель может одновременно отображать 28 инструментов, все из которых можно настроить под требования брокера. Хороший обзор инструментов позволяет найти превосходные точки входа и возможные разворот

Индикатор дает сигналы согласно методике VSA (Volume Spread Analysis) - анализ торгового объема в сочетании с размером и формой свечи. Сигналы в виде стрелок выводятся после закрытия бара на основной график. Стрелки не перерисовываются.
Входные параметры DisplayAlert - включение оповещения, по умолчанию true; Pointer - вид стрелки (три варианта), по умолчанию 1; Factor_distance - коэффициент расстояния размещения стрелки, по умолчанию 0.7. Рекомендуемый таймфрейм - М15. Валютная пара - любая.

Индикатор Automatic Fibonacci with Alerts автоматически отображает уровни коррекции Фибоначчи на основе количества баров, указанного в параметре BarsToScan. Уровни обновляются автоматически в режиме реального времени при появлении новых максимумов и минимумов среди выбранных баров. В настройках индикатора можно выбрать, какие значения уровней надо отобразить. Также в параметрах индикатора можно выбрать цвета уровней - это позволяет установить на графике несколько индикаторов с различными настрой

Индикатор визуализирует результат работы скрипта CalculateScientificTradePeriod (который, конечно, также нужно скачать), который, во-первых , оценивает в течении скольких Mx баров активного графика будет наиболее вероятно продолжаться будущий тренд и каково его качество, и, во-вторых , вычисляет тот оптимальный период усреднения (что также равен Mx ) индикатора ScientificTrade , который дает максимальную прибыль по крайне эффективной стратегии ScientificTrade . Для работы
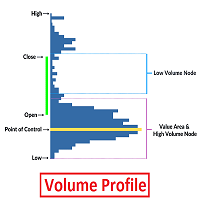
Volume Profile is an advanced charting study that displays trading activity over a specified time period at specified price levels. The study (accounting for user defined parameters such as number of rows and time period) plots a histogram on the chart meant to reveal dominant and/or significant price levels based on volume. Essentially, Volume Profile takes the total volume traded at a specific price level during the specified time period and divides the total volume into either buy volume or s
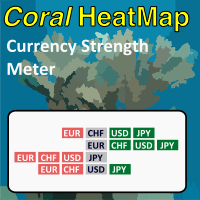
Coral Heatmap is a currency strength meter based on the ATR values for the selected timeframe. There are two main view modes: All Currencies (default) - see the ranked strength of all currencies in a single view Selected Currency - see the relative strength of all other currencies compared to a selected currency You can optionally display the timeframe selection toolbar; timeframe is always synchronized to the current chart timeframe. Use keyboard shortcuts to quickly navigate currencies (up/d
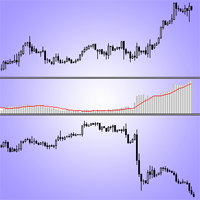
Индикатор корреляции торговых инструментов. Показывает разницу значений цен двух инструментов. Рост расхождения цен и уменьшение расхождения цен можно рассматривать как сигналы к сделкам. Индикатор можно использовать для хедж-стратегий. Индикатор подаёт сигналы Alert и Push-уведомления на мобильное приложение о пересечении скользящих средних Envelopes. У индикатора простые настройки. Нужно поместить его в окно торгуемого инструмента и выбрать параметры: Correlated_Symbol - выбор торгового инстру
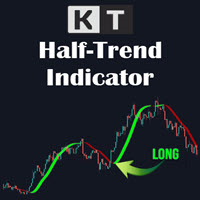
The KT HalfTrend is a moving average-based trend indicator that draws zones. It marks a trend shift by drawing bearish and bullish invalidation zones on the chart. It also displays the trend buy-sell strength with arrows on the main chart. The indicator will be flat if no trend indicates accumulation, temporary price, or distribution zones. If there is a trend, there will be a slope in that direction. The trend signals are substantial if the slope is steep, either to the upside or the downside.

1分足から使える高精度のスキャルピング用逆張りサインツールです。
・すべての通貨ペア、時間足で利用でき、絶好のタイミングでのエントリー・チャンスをお知らせします ・ ボリンジャーバンドにタッチしてからの反転を 基本戦略とし、 独自のアルゴリズムを加えることで、精度の高い反転ポイントでサインを発信します ・勝敗判定機能により 直近の相場環境に対するこのインディケータの有用性を確認することができます ・ 初心者から上級者まで設定不要ですぐにお使いいただけます ・本サインツールの性能を確認いただくための専用EAを提供いたします。コメント欄をご覧ください
1分足での使用にも耐えるので、トレード頻度を高めることができます。またより高い時間足での使用では精度の向上が期待できます。トレンド・フィルターの機能を利用することで、トレンド方向での押し目買い、戻り売りに際し最適なタイミングでトレードすることができます。
設定項目は以下の通りです。 Bollinger Bands Period
Bollinger Bands Deviation
Bollinger Bands Shift

First of all, it is worth highlighting here that this Trading Indicator is Non Repainting, Non Redrawing and Non Lagging, which makes it ideal for manual trading. Never repaint and recalculate Once an arrow appears it never disappears, the signal comes at the opening of the new candle You will now be more profitable with this indicator The indicator will alert you when an arrow appears You can do swing trading or scalping trading The indicator helps you identify the trend Can be optimized acros

Индикатор определяет и отображает на графике паттерн М. Гартли "Бабочка". Выделение паттерна производится по вершинам индикатора ZigZag (включен в ресурсы, не требует дополнительной установки). В момент распознавания паттерна выводится сообщение во всплывающем окне, отправляются оповещения на мобильное устройство и электронный почтовый ящик. Схема паттерна и параметры волн приведены на скриншоте. Параметры, заданные в индикаторе по умолчанию, являются демонстрационными для увеличения количества

Relative Momentum Index (RMI, Индекс Относительного Импульса) был разработан Роджером Альтманом и впервые опубликован в феврале 1993 года в журнале "Technical Analysis of Stocks & Commodities". Как следует из названия, Индекс Относительного Импульса добавляет компоненту импульса к традиционному RSI. Он направлен на увеличение надежности при помощи уменьшения ложных колебаний между заданными уровнями перекупленности и перепроданности. В индикаторе Relative Momentum Index имеется 2 составляющие. И

"BUYUK SAVDOGAR" TM разработал эту стратегию для поддержки всех кто торгует на бинарных опционах. Если вы торгуете бинарными опционами, попробуйте эту торговую систему. Большинство пользователей сообщают о хороших результатах. Торговая система основана на лучшем алгоритме. Торговая система помогает определить рыночную ситуацию по объему. Потеря интереса в ту или иную сторону к текущей цене влияет на дальнейшее движение цены. Невозможно обнаружить эту информацию человеческим глазом. Цифры под с

Welcome to the world of advanced trading with the RSI Multicurrency Scanner! Maximize your trading experience with our powerful MT4 indicator designed for seamless analysis and real-time insights. Key Features: Effortless RSI Scanning: Unlock the full potential of the RSI Multicurrency Scanner by effortlessly scanning multiple currency pairs. Receive instant alerts when specific Relative Strength Index (RSI) conditions are met, ensuring you stay ahead of market movements. Comprehensive Dashboar
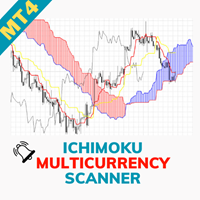
Welcome to the world of advanced trading with the Ichimoku Multicurrency Scanner! Maximize your trading experience with our powerful MT4 indicator designed for seamless analysis and real-time insights. Key Features: Effortless Ichimoku Scanning: Unlock the full potential of the Ichimoku Multicurrency Scanner by effortlessly scanning multiple currency pairs. Receive instant alerts when specific Ichimoku Cloud conditions are met, ensuring you stay ahead of market movements. Comprehensive Dashboar
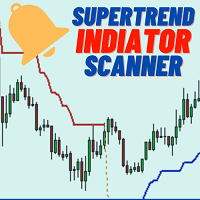
Welcome to the world of advanced trading with the Supertrend Indicator Scanner! Maximize your trading experience with our powerful MT4 indicator designed for seamless analysis and real-time insights. Key Features: Effortless Supertrend Scanning: Unlock the full potential of the Supertrend Indicator Scanner by effortlessly scanning multiple currency pairs. Receive instant alerts when specific Supertrend conditions are met, ensuring you stay ahead of market movements. Comprehensive Dashboard Insi
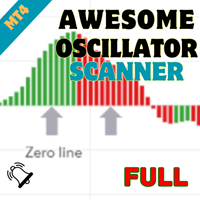
Welcome to the world of advanced trading with the Awesome Oscillator Scanner! Maximize your trading experience with our powerful MT4 indicator designed for seamless analysis and real-time insights. Key Features: Effortless Awesome Oscillator Scanning: Unlock the full potential of the Awesome Oscillator Scanner by effortlessly scanning multiple currency pairs. Receive instant alerts when specific Awesome Oscillator conditions are met, ensuring you stay ahead of market movements. Comprehensive Da

This is a volume profile where you can customize the time period you want. You can do this with a line or choose automatic functions such as showing the volume from the last time period. The indicator also shows the maximum volume value (VPOC - VOLUME POINT OF CONTROL) and the average value, colors and settings you can adjust as you like, there are many possibilities. If you need an indicator that shows the constant volume time frames there is ...HERE... Volume Profile is an advanced charting

Daily supply and demand levels for breakouts or reversals. Use on 1 Hour charts No nonsense, for the confident trader who trades price action supply and demand levels with daily projections without the fluff using 1 Hour charts. MT5 Version: https://www.mql5.com/en/market/product/108522 The Bank Trader Indicator is a sophisticated tool employed by institutional traders, particularly those in banking institutions, to navigate the complex world of forex markets. Rooted in the principles of daily
The Breakout Line in technical analysis serves as a crucial tool for understanding market dynamics and potential shifts in price direction. It's designed to highlight rapid accelerations or declines in the market's trajectory. Unconventional Analysis : The Breakout Line is not your typical technical indicator; it's tailored to capture swift market movements, offering a unique perspective on price trends. Angle of the Breakout Line : The sharper the angle formed by the Breakout Line, the stro

Better Support & Resistance показывает оптимальные линии и зоны поддержки/сопротивления. Он основан на фракталах (Fractals) с выбранным вами множителем. Все фракталы собираются, взвешиваются, расширяются и объединяются в четкий набор линий поддержки/сопротивления. Ближайшие линии отображаются в качестве зон, когда цена находится в данной зоне. Better Support & Resistance дает вам полное представление о важных ценовых уровнях.
Настройки Настройки индикатора Support & Resistance по умолчанию дос
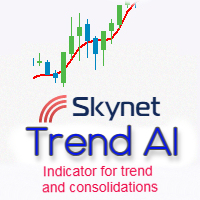
Skynet Trend AI показывает цветной линией тренд на графике цены. обычно, все трейдеры ищут подсказку, где купить а где продать с помощью классических или скаченных индикаторов. но часто это все больше всего запутывает и вы каждый раз находите сложным и запутанным создавать для себя подсказку где открыть позицию. надежда на свои силы не всегда оправдывает результат. поэтому лучше использовать простой и понятный инструмент для решение вашей задачи! данный инструмент даст вам визуальную информацию,

Box Martingale System - это индикатор, предназначенный для торговли по мартингейлу. Этот индикатор отправляет сигнал на максимальной точке, где вероятнее всего развернется тренд. Эти сигналы можно использовать для открытия сделок. Он отображаются на графике в виде квадратов. Это дает возможность увидеть, на какой точке подается сигнал. Главное при торговле на основе мартингейла - найти хорошую начальную точку. Данный индикатор обеспечивает эту начальную точку.
Торговые правила Начинайте работу
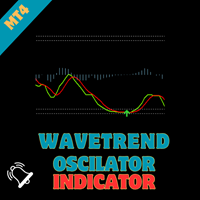
WaveTrend Oscillator - Bringing Tradingview's Renowned Indicator to MQL Elevate your trading strategies with the "WaveTrend Oscillator," an MQL port of the renowned TS/MT indicator created by Lazybear on tradingview. This powerful indicator provides valuable insights into market dynamics, offering clear signals for optimal entry and exit points in your trades.
Key Features : Proven Effectiveness : Based on the popular TS/MT indicator, the WaveTrend Oscillator brings a time-tested and proven ap

Трендовый индикатор Pivot trend использует стандартный расчет точек разворота и некоторые индикаторы. Он предназначен для расчета возможных трендов с использованием точек разворота. Он также дает представление о направлении тренда. Вы можете использовать этот индикатор в качестве индикатора тренда. Или с другими индикаторами, подходящими для вашей стратегии.
Особенности Зеленый бар представляет собой восходящий тренд. Красный бар представляет собой нисходящий тренд. Синяя точка разворота означ
My Intraday trading session indicator. SL Session Strength 28 Pair https://www.mql5.com/en/market/product/57585 This strategy is even used by the Banks to make profits. They take a strong currency and pitch against a weak currency This indicator allows you to analyze the hidden trends and correlations between the 8 most traded currencies via unique strength meter which creates multiple charts in a single window based on the price action of each currency in relation to all other currenci

Contact me after payment to send you the user manual PDF file. Introduction The moving average indicator is the most well-known and one of the most popular indicators among traders. It is very simple to work with, but a basic question has always become a big challenge among traders: What is the most optimal setting of the moving average for each chart-time frame? The answer to this question is very difficult, you have to try different settings of the moving average indicator for different chart
テクニカル指標開発の第一人者であるトム・デマークが考案した TDシーケンシャルは、 トレンドの転換点を判断するのに有用なインディケータです。このインディケータは TDシーケンシャルを裁量およびEAで実際に利用してきた私自身の経験から、より手軽に、かつ効果的に活用できるよう作成された裁量トレード用サインツールです。
強いトレンドが生じている際に多くのだましが生じるのはTDシーケンシャルの弱点と思われますが、これを克服するために強力なフィルターを装備しています。また、最も有効と思われるセットアップ9に絞ってサインを発信します。
全通貨ペア、全タイムフレームで利用できます。勝敗判定機能により、このインディケータの直近の相場環境に対する有効性を確認できます。
設定項目は下記のとおりです。 Enable Protect Mode...強いトレンドが発生した際の連敗を回避します Box Filter...下で設定する3つのタイムフレームでの移動平均でパーフェクト・オーダーが発生していない状態をボックス相場と判定し、サインを限定します Moving Average Time Frame1

KT MACD Alerts is a personal implementation of the standard MACD indicator available in Metatrader. It provides alerts and also draws vertical lines for the below two events: When MACD crosses above the zero line. When MACD crosses below the zero line.
Features It comes with an inbuilt MTF scanner, which shows the MACD direction on every time frame. A perfect choice for traders who speculate the MACD crossovers above/below the zero line. Along with the alerts, it also draws the vertical line
Introduction
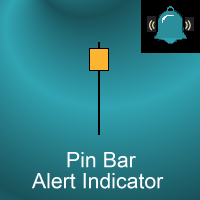
This indicator marks Pin Bars (bars with an unusually long upper or lower candle wick) on your chart. It will also send alerts when one forms, including via e-mail or push notification to your phone . It's ideal for when you want to be notified of a Pin Bar set-up but don't want to have to sit in front of your chart all day.
You can configure all the settings including: What proportion of the bar should be made up of the wick How big or small the total size of the Pin Bar has

A tall upper shadow occurs when the price moves during the period, but goes back down, which is a bearish signal. A tall lower shadow forms when bears push the price down, but bulls pull it back up, which leaves a long line or shadow. This is considered a bullish signal.
Some technical analysts believe a tall or long shadow means the stock will turn or reverse. Some believe a short or lower shadow means a price rise is coming. In other words, a tall upper shadow means a downturn is coming, whil
The indicator plots the Up and Down arrows on every price swing made by the classic Zigzag indicator. When Zigzag makes a new swing low, a green arrow is plotted. Likewise, a red arrow is plotted when Zigzag makes a new swing high.
Features
Compared to the classic ZigZag, it marks the swing points more effectively. It helps to identify the forming chart patterns in advance. It comes with a Multi-Timeframe scanner which shows the Zigzag direction on each timeframe. All Metatrader alerts includ
Узнайте, как легко и просто купить торгового робота в MetaTrader AppStore - магазине приложений для платформы MetaTrader.
Платежная система MQL5.community позволяет проводить оплату с помощью PayPal, банковских карт и популярных платежных систем. Кроме того, настоятельно рекомендуем протестировать торгового робота перед покупкой, чтобы получить более полное представление о нем.
Вы упускаете торговые возможности:
- Бесплатные приложения для трейдинга
- 8 000+ сигналов для копирования
- Экономические новости для анализа финансовых рынков
Регистрация
Вход
Если у вас нет учетной записи, зарегистрируйтесь
Для авторизации и пользования сайтом MQL5.com необходимо разрешить использование файлов Сookie.
Пожалуйста, включите в вашем браузере данную настройку, иначе вы не сможете авторизоваться.