Watch the Market tutorial videos on YouTube
How to buy а trading robot or an indicator
Run your EA on
virtual hosting
virtual hosting
Test аn indicator/trading robot before buying
Want to earn in the Market?
How to present a product for a sell-through
Paid Technical Indicators for MetaTrader 4 - 12

The market price usually falls between the borders of the channel .
If the price is out of range, it is a trading signal or trading opportunity .
Basically, Fit Channel can be used to help determine overbought and oversold conditions in the market. When the market price is close to the upper limit, the market is considered overbought (sell zone). Conversely, when the market price is close to the bottom range, the market is considered oversold (buy zone).
However, the research can be used
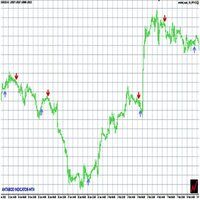
Antabod indicator is a trading system worth being sold for $999, but now $120. For a short period of time the price is now reduce to $60, but may soon go back up to $120 . This forex indicator analyzes the price behavior on the chart every second and determines the ideal entry points, based on the built-in algorithm, informing you when you need to open a deal and close it, to take profit.
It catches very fast and profitable price movements and gives you easy BUY/SELL signals, by Up and Do
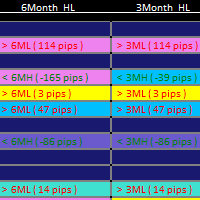
1. Updated usage instructions in blog below: Smart Market Structure Trading System and Automatic Scanner - Trading Systems - 13 October 2023 - Traders' Blogs (mql5.com) https://www.mql5.com/en/blogs/post/754495 2. YouTube video link for introduction: https://youtu.be/tMU04wo0bc8 3. The Smart Market Structure Opportunity Scanner is a great tool to find trading entries and exits based on Smart Money Concepts. It has a build-in custom choice of Forex pair lists to choose from for the scan, and

缠中说禅在MT4的应用,该指标自动识别分型,划笔,划线段,显示笔中枢,线段中枢,也可以根据需求在参数中设置显示自己所需要的。 1.笔采用条件较为宽松的新笔。 2.当前分型与前面分型不能构成笔时,若与前面笔同向且创新高或新底时会延伸笔,若与前面笔异向且符合替换条件则去除倒数第一笔,直接倒数第二笔。 3.线段的终结第一类情况:缺口封闭,再次创新高或新底新低,则判为终结,同时破坏那一笔的右侧考虑特征序列包含。 4.线段终结的第二类情况,缺口未封闭,考虑后一段特征序列分型出现新的顶底分型,同时做了包含处理。 5.中枢显示笔中枢和段中枢可在参数选择 6.第一类买卖点两种方式可选,参数1为MACD动能柱面积,参数2为斜率

Direct translation of blackcat's L3 Banker Fund Flow Trend Oscillator. Get push notifications on your phone app when a signal bar has formed. Historical signals are shown with buy/sell arrow right on the main chart. Indicator uses two data calculations to check for a cross below 25% level (a signal to go long) and above 75% level (a signal to short). For any further questions feel free to contact me directly. Including requests for product improvements.

Scanner and Dashboard for Money Flow Index for MT4 The Money Flow Index (MFI) is a technical oscillator that uses price and volume data for identifying overbought or oversold signals in an asset. It can also be used to spot divergences which warn of a trend change in price. The oscillator moves between 0 and 100. Advantages of the Scanner: - Full Alert Options. - Multi Timefrare - Works for all instruments including Currencies, Indices, Commodities, Cryptocurrencies and Stocks. - Fully customis

This simple, yet powerful indicator is very good way to determine actual S/R levels. It's main purpose is making your overview on markets much better.It has built-in arrow signal system, which should be used along with MT indicators for best results.Just try it.
Recommended MT indicators to use along:
Bollinger Bands (default) RSI (period 3, levels 10/90)

A indicator to show saturation in buying or selling With fast and complex mathematical calculations Easily find saturation points for buying or selling Can be used in all symbols and time frames with many signals Can be combined with different indicators and different time frames With simple settings and simple working methods
Features: Can be used on all symbols Can be used in all time frames Can be used in all markets (Forex, stock, etc.) Large number of signals Same performance on all t

We Trade Live Trend Entry & Exit is another fantastic addition to the the We trade Live trend Indicator collection This Indicator works fantastically well with our other Indicators. This Indicator is primarily used to enter a trade & Exit a Trade , and to alert you when you could possibly take a short or long on a current trend , it provides alerts on when there is a change in direction on the trend you are trading but please make sure you take into account all variables, before entering a trade
Check My Product
Contact me to discover all my services
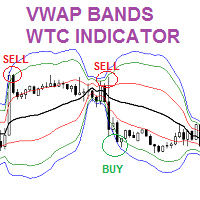
The VWAP Volume weighted Average Price Bands indicator is similar to the Moving Averages and Bollinger bands. In this indicator, more weight is given to the volume. The indicator provides great insight on support and resistance levels in the chart. Moreover, the indicator shows the fair value of a trading instrument. Thus, enabling forex traders to identify great trading opportunities to BUY LOW and SELL HIGH. Forex traders can combine
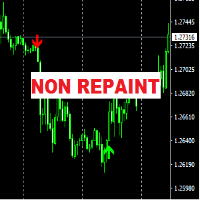
The "FCK Trend Arrow No Repaint" indicator is designed for analyzing market dynamics and determining potential trading signal moments. The main feature of this indicator is the absence of signal repainting, which contributes to more accurate and reliable forecasting of price movements in the market.
Mechanism of Operation: The "FCK Trend Arrow No Repaint" indicator uses several types of graphical elements to indicate trading signals: Up and Down Arrows: The indicator marks possible market ent
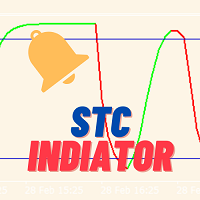
STC Indicator - Boost Your Trading Strategy with Smart Trend Confirmation Description: Enhance your trading strategies and maximize profitability with the STC Indicator for TradingView. Developed by industry experts, the STC Indicator (Schaff Trend Cycle) is a powerful technical analysis tool that combines the best of both trend-following and oscillator indicators to provide reliable buy/sell signals. With its unique algorithm, the STC Indicator effectively identifies trend cycles and confirms

The GGP Chandelier Exit Alert MT4 Indicator is a volatility-based indicator that identifies stop loss exit points for long and short trading positions. Chandelier Exit is based on the Average True Range (ATR) indicator. It is designed to keep traders in the trend until a defined trend reversal happens. Traders use CE to maximize their returns in a trade and make stop loss exit decisions. It is based on the principle that a trend reversal is highly probable when the price of an asset moves ag

Interceptor - professional volume and price extremes indicator. Interceptor is a powerful indicator, which thanks to a combination of four different types of normalized indicators in one algorithm can correctly identify extremes of the price leading to retracements and reversals in the trend. Algorithm is based mainly on combination of Accumulation/Distribution , On Balance Volume , Money Flow Index and Relative Strength Index . The first parameter of Interceptor is Interceptor_Depth which defin
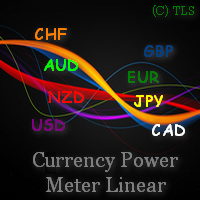
This is a linear indicator of a currency power having the ability to filter by smoothing values. It shows the current power of selected currencies (the maximum number is 8), as well as historical values. Calculation depends on the selected chart timeframe the indicator is launched at. The indicator displays data as lines for all currencies or as a histogram for the current currency pair. The intersection of the currency strength indices for the current currency pair is additionally displayed as

Contact me after payment to send you the User-Manual PDF File.
Double Top/Bottom Pattern
Double top and bottom patterns are chart patterns that occur when the underlying investment moves in a similar pattern to the letter "W" (double bottom) or "M" (double top). Double top and bottom analysis are used in technical analysis to explain movements in a security or other investment, and can be used as part of a trading strategy to exploit recurring patterns. Searching for this pattern among the c
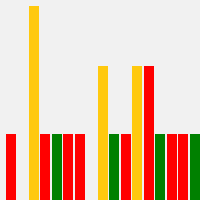
I'm excited to introduce you to the fifth bar on Martin Armstrong's Forecast Array - The Trading Cycle .
This innovative tool represents a transverse form of cyclical frequency analysis, offering a unique perspective on market trends.
The model employs a color-coded system for easy interpretation. In this model, green signals the ideal timing for highs, red indicates ideal lows, and yellow signifies a convergence of highs and lows occurring simultaneously. This intuitive approach allows
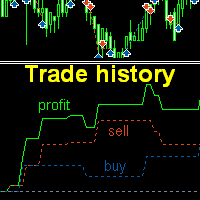
The indicator plots charts of profit taken at the Close of candles for closed (or partially closed) long and short orders individually. The indicator allows to filter orders by the current symbol, specified expert ID (magic number) a nd the presence (absence) of a substring in a order comment , to set the start time and the periodicity of profit reset (daily, weekly or monthly) to calculate the profit chart. The indicator also displays the floating (not fixed) profit of the opened orders at the

Hi traders, I'm glad to bring to you the market analysis tool called "Infinity Trend Indicator". The main goal of this indicator is to help you figure-out the beginning of a new trend and the end of the trend current trend. NOTE: THIS INDICATOR DOESN'T REPAINT!! How to use this Indicator 1. Based on the Infinity trend indicator only We look to buy when the yellow line is pointing or curving up after a strong bearish move We look to sell when the yellow line is pointing or curving downward aft

This indicator is a conventional analytical tool for tick volumes changes. It calculates tick volumes for buys and sells separately, and their delta on every bar, and displays volumes by price clusters (cells) within a specified bar (usually the latest one). The algorithm used internally is the same as in the indicator VolumeDelta , but results are shown as cumulative volume delta bars (candlesticks). Analogous indicator for MetaTrader 5 exists - VolumeDeltaBars . This is a limited substitution

ATR Scanner Pro is a multi symbol multi timeframe volatility scanner that monitors and analyzes Average True Range indicator value in up to 28 symbols and 9 timeframes in 3 modes : ATR value: As a volatility dashboard it shows the ATR indicator value in all pairs and timeframes and signals when the ATR value reaches a maximum or minimum in a given duration. Short term ATR/Long term ATR ratio: It shows ratio of 2 ATRs with different periods. It's useful in detecting short term volatility and e

Features Supports the creation of Monthly, Weekly, Daily, 4 Hours, 1 Hours and 30 Minutes Market Profile. Daily Profile can have custom start time. Merge and Split of Market Profile Market Profile References Point can be exported to CSV format for any further analysis.
Indicator Parameters Indicator Update Interval - Choose indicator calculation period from 250 milliseconds to 2.5 seconds Indicator Setting ID - An ID for this particular indicator setting. Profile Number - The Number of Market

Great news from today you can test indicator within1 week absolutley for free! FREE version of indicator https://www.mql5.com/en/market/product/41465 We present you an indicator - Insider Scalper by LATAlab developed by the LATAlab team, that allows you to bring scalping trading to a whole new level of quality! With our strategy you can: Insider Scalper by LATAlab displays a hidden tick chart that is not available in the basic tools of the terminal. Automatically detects and draws strong level
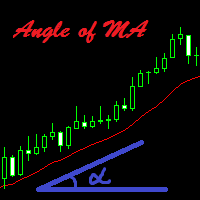
The indicator calculates the inclination angle of the Moving Average and displays the result on the screen. Users can select the start and end points to measure the inclination of the MA. It is also possible to set the angle value, and if the inclination angle exceeds the specified value, the indicator will play a sound alert and display a message on the screen.
Configurations Left_Shift_of_MA=1; - Shift of the MA to calculate the inclination angle (start point) Right_Shift_of_MA=0; - Shift of

Liquidity Pro The Liquidity Pro pin points liquidity zones in any financial instrument, including currency pairs, cryptocurrencies, commodities, equities and indices. The Liquidity Pro shows previous and current liquidity zones, down to the present minute, providing essential information about your chosen trading pair, when conducting chart analysis or initiating trades. Remember each trading pair requires a different price separation value for M5, M15 and M30 Tally, to provide accurate data. Y
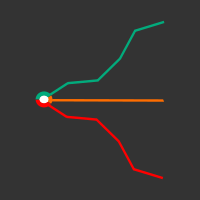
The Spread Ratio indicator allows you to view the ratio between the value of one instrument and another in order to operate with spread trading techniques.
In the image we can see an example of the Spread Ratio indicator on the Brent Oil and Crude Oil instruments. As we see from the image, the Spread Ratio indicator shows the trend of the ratio between these two instruments, allowing us to grasp the misalignments and realignments of the prices.
It is also possible to combine the Spread Rati

This is the only Indicator you need to navigate TIME and PRICE . Here I present to you: ICT Killzone Gem Indicator . This indicator will SAVE YOU TIME marking up the charts so you can FOCUS more on your Trades. You can customize it however you like. There is also a toggle switch where you can toggle on or off a specific part so that you can make your charts clean. Watch the video for a Full Explanation . Leave a Review about your experience with this Indicator : ) Inside the Indicator:
2

This indicator is designed to detect high probability reversal patterns: Double Tops/Bottoms with fake breakouts . Please read also the blog post " How To Yield Big Winners Consistently! " which explains the concepts behind the ULTIMATE Double Top/Bottom indicator and how you can use a top-down approach to get 15 - 20R winning trades on a regular basis . The provided video shows the maximum performance of the indicator. With maximum performance, I mean that this could have been the profit if you
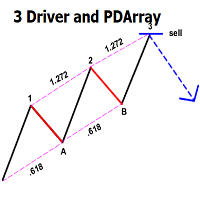
This indicator automatically identifies the SMC 3-Drive pattern and sends notifications to users when the pattern is detected. Additionally, the indicator identifies PDArray (including FVG and OB) and offers an option to combine the 3-Drive pattern with PDArray. This combination provides users with more reliable signals. What is the 3-Drive Pattern? This pattern is formed by three price pushes in one direction, providing a strong reversal signal (Figure 3). The key to identifying this pattern is
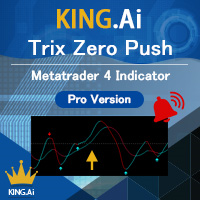
The brand new trading indicator using TRIX strategy is exclusive presented by KING.Ai. Exclusive Functions including Mobile Push Notification . This indicator with Three-mode alerts is developed by KING.Ai ONLY. It is probably impossible that you could find a TRIX indicator like this one. It is very difficult for you to trade with the Trix strategy as there is limited time for traders to monitor every currency. However, the Trix strategy is very profitable especially using in DAY CHAT. It

Rental/Lifetime Package Options and Privileges' * For optimum results the yearly or lifetime package is suggested due to live training and Discord channel trading with the creator! Rent Monthly Six Months Yearly/Lifetime Weis Wave with Speed with Alert+Speed Index x x x Manual x x x Quick Set up Video x x x Blog x x x Lifetime Updates x x x Setup and Training Material
x x Free Rectangle Break Alert Tool x Discord Access Channel "The SI traders"
x 2-hour live methodology traini

You can read about the MACD indicator at this link
Software description This indicator can display 1 or 2 MACD indicator on different time frames and settings. There is a FREE version that uses EMA for calculation. This Pro version use all 4 Moving average type for calculation: Simple, exponential, smoothed and linear weighted. The active indicators can give pop up, sound, push or e-mail alert. The free version alert on zero-level-cross only, this Pro version alert can be set to zero level cro
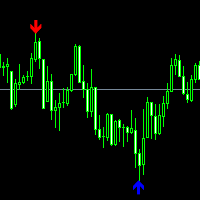
AMS Scalper
An excellent indicator for the entry point into the market; we use indicator signals only according to the trend.
Settings:
Range - 50 (range size for signal search.)
Maximum candles Back - 3 (after how many candles to set a signal)
P.S. For the signal to appear on the zero candle, set 0.
We recommend a trend indicator - Trend Arrow Super
Still have questions? do you need help?, I'm always happy to help, write to me in private messages or
In telegram

Have you ever wondered why so many Forex traders get trapped in weak positions on the wrong side of the market? One of the easiest ways the market makers do this, is by using volatility. A currency pair moves suddenly, often on a news release or economic data. Traders jump in, expecting some quick and easy profits, but the move suddenly moves in the opposite direction. This happens in all timeframes, and in all currency pairs. The candle or bar closes, with a wide spread, but then reverses sharp
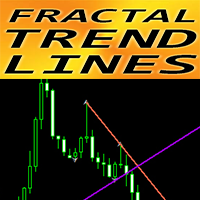
Forex Indicator "Fractal Trend Lines" for MT4 This indicator is excellent for traders who use Graphical Analysis with breakouts!!! "Fractal Trend Lines" shows graphical Up Trend (violet) & Down Trend (tomato color) lines. Up Trend & Down Trend lines are built on 2 nearest corresponding fractals Indicator has few parameters responsible for trend lines color and width I ndicator has built-in Mobile and PC alert of breakout // More great Expert Advisors and Indicators are available here: https:
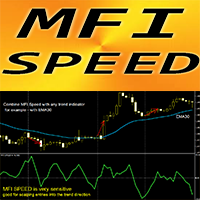
Forex Indicator "MFI Speed" for MT4 The calculation of this indicator is based on equations from physics . MFI Speed is the 1st derivative of MFI itself Money Flow Index (MFI) is a technical oscillator which uses price and volume data for identifying oversold and overbought zones
MFI Speed is good for scalping momentum entries into the direction of main trend Use it in combination with suitable trend indicator , for example standard EMA (as on pictures) MFI Speed indicator

"Adjustable Fractals" - is an advanced version of fractal indicator, very useful trading tool! As we know Standard fractals mt4 indicator does not have settings at all - this is very inconvenient for traders Adjustable Fractals has resolved that issue - it has all necessary settings: Adjustable period of indicator (recommended values - above 7) Adjustable distance from Highs/Lows of price Adjustable design af fractal arrows // More great Expert Advisors and Indicators are available he
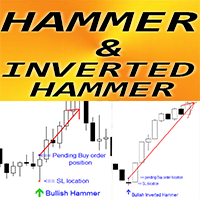
Forex Indicator " Hammer and Inverted Hammer pattern" for MT4 Indicator " Hammer and Inverted Hammer pattern " is very powerful indicator for Price Action trading : No repaint, No delays; Indicator detects bullish Inverted Hammer and Hammer patterns on chart: Bullish Inverted Hammer - Blue arrow signal on chart (see pictures) Bullish Hammer - Green arrow signal on chart (see pictures) P C, Mobile & Email alerts are included Indicator " Hammer and Inverted Hammer pattern

This scanner is monitoring the entire market for trade opportunities for all symbols and for all time frames. You don't have to look to all the charts, for all symbols and for all time frames. This scanner will alert you on your computer, or on your mobile, when a trade opportunity has been found. You never have to miss a trade opportunity! This indicator is designed to scan all pairs and symbols, for all time frames, to find a cross of the MACD main and signal line. MACD Definition
The

It predicts the most likely short-term price movement based on advanced mathematical calculations.
Features Estimation of immediate price movement; Calculation of the real market trend; Calculation of the most important support and resistance levels; Algorithms optimized for making complex mathematical calculations with a minimal drain of system resources; Self-adjusting for better performance, so it’s able to work properly at any symbol (no matter how exotic it is) and any timeframe; Compatib

The FCPI indicator or Forex Currency Power Index indicator for MT4 is a multi currency pairs indicator that displays 28 pairs on 1 chart, which consists of 8 Major Pairs and 20 Cross pairs. 8 Major Pairs and 20 Cross pairs: EURUSD,GBPUSD,AUDUSD,NZDUSD,USDCAD,USDCHF,USDJPY,EURGBP,EURAUD,EURNZD,EURCAD,EURCHF,EURJPY,GBPAUD, GBPNZD,GBPCAD,GBPCHF,GBPJPY,AUDNZD,AUDCAD,AUDCHF,AUDJPY,NZDCAD,NZDCHF,NZDJPY,CADCHF,CADJPY,CHFJPY. Automatically detects symbols that have a symbol prefix and/or a symbol suffi
The presented product is an effective trend indicator which, depending on the settings, can be used for both short-term trading (scalping) and medium/long-term trading strategies. The ease of use of the indicator makes it a good choice for both beginners and experienced traders. The essence of the NRTR (Nick Rypock Trailing Reverse) indicator is that it is always located at a constant distance from the reached price extremes - below the chart on uptrends and above the chart on downtrends. The fo

Tick Sound will play a different sound each time a tick is triggered. When the tick is higher than the previous one, an "UP" sound is triggered When the tick is lower than the previous one, a "DN" sound is triggered The main sound i chose is a Sheppard Tone : it's an audio effect that simulates and endless ramping sound up or down which is perfect for this task. but you can also select 14 different pre-made up/dn sounds or use your own sounds
There are three main parameters for Tick Sound Ask
The leading indicator calculates the most likely places for a trend reversal or stop.
An example of use is shown on the screenshot using the ChainVector trading panel ( https://www.mql5.com/en/market/product/49155 ).
Support: https://www.mql5.com/en/channels/TrendHunter This indicator can be used as a stand-alone trading system or as an additional part of another trading system. Support : https://www.mql5.com/en/channels/TrendHunter
More products are available here: https://www.mql5.com

The Trend PA indicator uses Price Action and its own filtering algorithm to determine the trend. This approach helps to accurately determine entry points and the current trend on any timeframe. The indicator uses its own algorithm for analyzing price changes and Price Action. Which gives you the advantage of recognizing, without delay, a new nascent trend with fewer false positives. Trend filtering conditions can be selected in the settings individually for your trading style. The indicator

The ICT Silver Bullet indicator is inspired from the lectures of "The Inner Circle Trader" (ICT) and highlights the Silver Bullet (SB) window which is a specific 1-hour interval where a Fair Value Gap (FVG) pattern can be formed. A detail document about ICT Silver Bullet here . There are 3 different Silver Bullet windows (New York local time):
The London Open Silver Bullet (3 AM — 4 AM ~ 03:00 — 04:00)
The AM Session Silver Bullet (10 AM — 11 AM ~ 10:00 — 11:00)
The PM Session Silver Bullet

The Nihilist 5.0 Indicator includes Forexalien and Nihilist Easy Trend trading strategies and systems. It is composed of an MTF Dashboard where you can analyze the different input possibilities of each strategy at a glance. It has an alert system with different types of configurable filters. You can also configure which TF you want to be notified on your Metatrader 4 platform and Mobile application
The indicator has the option to view how could be a TP and SL by using ATR or fixed points, even
Keltner MTF (Not repaint!!!) is a channel indicator that can display price channels from different timeframes on a single chart of quotes. For example, on the H1 chart, you can see at the same time the Keltner price channel from the M15 and H4 timeframe. This tactic makes it possible to more clearly understand the tendency of price movements, to determine trading goals and points for making deals. How the Keltner MTF Indicator Works The Keltner MTF indicator can be used both - for trading in

In the "Masters of Risk" trading system, one of the main concepts is related to places where markets change direction. In fact, this is a change in priority and a violation of the trend structure at the extremes of the market, where supposedly there are or would be stop-losses of "smart" participants who are outside the boundaries of the accumulation of volume. For this reason, we call them "Reversal Patterns" - places with a lot of weight for the start of a new and strong trend. Some of the imp

MACD Scanner provides the multi symbols and multi-timeframes of MACD signals. It is useful for trader to find the trading idea quickly and easily. User-friendly, visually clean, colorful, and readable. Dynamic dashboard display that can be adjusted thru the external input settings. Total Timeframes and Total symbols as well as the desired total rows/panel, so it can maximize the efficiency of using the chart space. The Highlight Stars on the certain matrix boxes line based on the selected Scan M
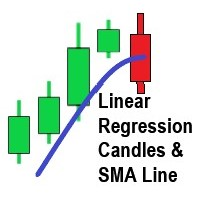
This indicator for MT4 is based on the currently popular indicator on Trading View of the similar name. The beauty of the indicator like Heiken Ashi is it removes a lot of market noise. 4 (OHLC) arrays are filled with Linear Regression(LR) values of each price for the LR period. The period of the Linear Regression is an input which must be higher than 2 (it's defaulted to 2 if you try an enter 1). The period of the Linear Regression is adjustable dependant on the market conditions. The SMA also
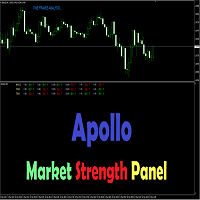
Apollo Market Strength Panel is a multi-timeframe indicator which can be helpful to forex and binary options traders. The panel represents market conditions on several time frames from M1 up to H4. The indicator provides info on three important market aspects. They are Trend, Force and Impulse. If all these 3 components align, the indicator will provide you with a BUY or a SELL signal depending on the market direction. The indicator plots signals right on your chart. You can choose what time fr

Gold ZigZag - arrow indicator which is actually a ZigZag with NO REPAINTING and NO LAG which provides signals at the open of a candle! The indicator is designed specially for the XAUUSD pair (Gold). Though you can use the indicator with other pairs too, though originally the indicator was meant to be used with Gold only. The indicator can be used with any time frame but higher time frames like H4 and D1 are recommended. The indicator is easy to use and does not require special skills or knowledg

Multicurrency and multitimeframe modification of the indicator Bollinger Bands. On the dashboard you can see breakouts and touches of the Bollinger Bands. In the parameters you can specify any desired currencies and timeframes. The indicator can also send notifications when the price touches the Bollinger Bands, when the current volatility changes (expands or falls), and when the price touches all the bands. By clicking on a cell with a period, this symbol and period will be opened. This is MTF
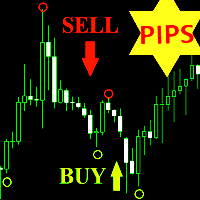
Pips Scalper Indicator - is a forex trading indicator specially designed for traders who are interested in scalping strategy. Scalping is a trading strategy in which a trader attempts to make a positive trade by snippets of small price movements. How to use the indicator? When the indicator draws a green circle on the chart of the currency pair, we open a buy deal and set a short TakeProfit of 20-25 points. In 87% of the signals, the price will go at least 20 pips in the direction of the arrow.

The indicator automatically draws the Fibonacci levels based on ZigZag indicator, Trading Sessions, Fractals or Candles (including non-standard timeframes: Year, 6 Months, 4 Months, 3 Months, 2 Months) ( Auto Fibo Retracement ). You can choose any higher time frame for Fibonachi calculation.
The levels are redrawn every time the current bar closes. It is possible to enable alerts when crossing the specified levels. You can also analyze levels in history. To do this, it is necessary to specif
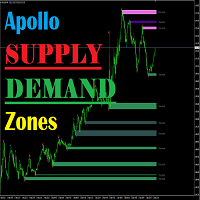
Apollo Supply Demand Zones with ALERTS is an indicator that calculates support and resistance levels. The indicator will be helpful to absolutely all traders, regardless of what strategy they use. This indicator can become one of the main elements of your trading system. The indicator calculates levels both on the current time frame and can work in MTF mode, displaying levels from a higher time frame. This indicator can be used absolutely on any time frame and with any trading instrument. The

Volume Champion is an indicator that analyzes market volume and displays data in the form of a histogram. You do not need to delve into the theory of market analysis. You can just follow the volume bars. The bars of the indicator show the potential direction of price movement based on the analysis of the market volume structure. The indicator will work with any time frame but higher time frames are recommended. THE SIGNALS DO NOT REPAINT! The indicator can be used with absolutely any time fra

The "M1 scalping signal" is a scalping indicator designed for the M1 timeframe. The indicator displays arrows on the chart indicating price reversal points. A red arrow indicates a price reversal to a sell position, while a green arrow indicates a price reversal to a buy position. It can be used on all currency pairs. Advantages: No Redrawing: The indicator does not redraw signals on historical data, ensuring stable analysis. Ease of Use: It is easy to configure and visualizes important reversal

This product is a part of ON Trade Waves Patterns Harmonic Elliot Wolfe
you can test free version on EURJPY from this link Wolf Waves Indicator
Discover Wolf Waves - Your Ultimate Trading Tool! Are you on the hunt for a powerful tool to spot Wolf Waves easily on any time frame? Look no further! Our Wolf Waves indicator does the job effortlessly. Here's why it's perfect for you: Key Features: Automatic Detection: Our Wolf Waves indicator finds key points and draws lines on your chart automa

Overview
The Volume SuperTrend AI is an advanced technical indicator used to predict trends in price movements by utilizing a combination of traditional SuperTrend calculation and AI techniques, particularly the k-nearest neighbors (KNN) algorithm.
The Volume SuperTrend AI is designed to provide traders with insights into potential market trends, using both volume-weighted moving averages (VWMA) and the k-nearest neighbors (KNN) algorithm. By combining these approaches, the indicat

The indicator searches for impulse candles and displays them on the chart. It includes a shadow filter. It also finds breakout levels of Bollinger Bands. You can enable multi-currency dashboard in the settings. Alerting choose between the current chart or the entire list. Blog-Link - Retest and Fake Breakout with UPD1
Trading patterns: Trend retest. False Breakout. Others.
EURUSD, GBPUSD, XAUUSD, ... M15, M30, H1.
Input parameters.
Basic. Bars Count - the number of history bars on whic

New, more accurate version of the Xmaster indicator. More than 200 traders from around the world have conducted more than 15,000 tests of different combinations of this indicator on their PCs in order to get the most effective and accurate formula. And here we present to you the "Xmaster formula indicator forex no repaint" indicator, which shows accurate signals and does not repaint. This indicator also sends signals to the trader by email and push. With the arrival of each new tick, it constan

Moving Average Crossover Scanner This Scanner scans two moving averages(MA) crossover across multi-currency pairs and multi-time frames and shows all the result in the dashboard. 1. The fast MA is about to cross up the slow MA - designated as "XUP". 2. The fast MA is about to cross down the slow MA - designated as "XDN". 3. The fast MA has just crossed up the slow MA - designated as "UP". 4. The fast MA has just crossed down the slow MA - - designated as "DN". Input parameters can be changed
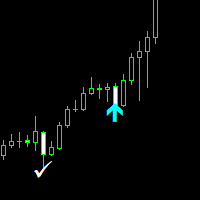
Nasdaq Savages Non-repaint indicator works on all timeframes 1 minute to 15 minutes timeframe for scalpers. 30 Minutes to Monthly timeframe for swing traders The Nasdaq Savages indicator comes with a top right info tab which tells you about the current buy or sell signal, Profit in pips, Stop loss and Target Red arrow is your sell entry signal the white right tick is your exit signal and take profit hit signal Light blue arrow is your buy entry signal the white right tick is your exit signal an
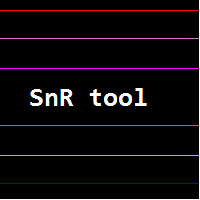
This is a SnR tool.
It is built based on the body candle.
It is a multi timeframe indicator.
There is a powerful scalabar for vertical line slides to limit the candle bars.
Color for each line can also be changed.
It can detect:
1. Support && Resistance
2. Support become Resistance && vice versa
3.Support become Resistance become Support && vice versa
It also can be used for trading tools and studies on SnR *New Version avaiable

All about Smart Money Concepts Strategy: Market struture: internal or swing BOS, CHoCH; Orderblock; Liquity equal; Fair Value Gap with Consequent encroachment, Balanced price range; Level with Previous month, week, day level or in day level (PMH, PWH, PDH, HOD); BuySell Stops Liquidity (BSL, SSL); Liquidity Void Long Wicks; Premium and Discount; Candle pattern ... "Smart Money Concepts" ( SMC ) is a fairly new yet widely used term amongst price action traders looking to more accurately navigate
It is a very simple indicator to display daily loss percentage, open position loss percentage, monthly loss percentage and monthly profit percentage. MT5 version
We assure you that we welcome any suggestions to improve this indicator and make the necessary changes to improve this indicator.
You can contact us via Instagram, Telegram, WhatsApp, email or here. We are ready to answer you.
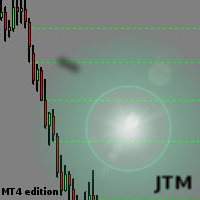
This indicator scanning thorough the history and drawing horizontal rays on all bars untested lows and highs. Fresh supply/demand zones and support/resistance levels will be marked down. It allows to be sure that certain levels is fresh and has not been tested yet. Usually after strong departure price is not retesting base immediately and leaving unfilled orders. There is no inputs, so indicator is ready to go. Version for MT5 is also available here: https://www.mql5.com/en/market/product/3084

CME Daily Bullettin Open Interest provides the data on the open interest of futures contracts on the CME for your charts. Open interest is a special type of volume, that shows how many contracts are being held by the market participants at each moment of time. This type of information is available only in futures markets. But now, with this indicator, you can also analyze these data when trading the spot markets, such as FOREX. In addition, the indicator provides data on the open interest for th
The MetaTrader Market is a simple and convenient site where developers can sell their trading applications.
We will help you post your product and explain you how to prepare your product description for the Market. All applications on the Market are encryption-protected and can only be run on a buyer's computer. Illegal copying is impossible.
You are missing trading opportunities:
- Free trading apps
- Over 8,000 signals for copying
- Economic news for exploring financial markets
Registration
Log in
If you do not have an account, please register
Allow the use of cookies to log in to the MQL5.com website.
Please enable the necessary setting in your browser, otherwise you will not be able to log in.