Watch the Market tutorial videos on YouTube
How to buy а trading robot or an indicator
Run your EA on
virtual hosting
virtual hosting
Test аn indicator/trading robot before buying
Want to earn in the Market?
How to present a product for a sell-through
Paid Technical Indicators for MetaTrader 4 - 8

Identify ranges | Get earliest signals of Trends | Get clear exits before reversal | Spot the Fibo levels the price will test Non-repainting, non-delayed indicator - ideal for manual and automated trading - for all assets and all time units 5 copies left at $69 - then $99 After purchase, please contact me for recommended and personalised settings Version MT4 - MT5 | Check our 3 steps MetaMethod to maximise your profits: 1. TrendDECODER 2. PowerZONES 3. BladeSCALPER
Wha

great tool for any trader for both Forex and binary options suitable for any trader no need to configure anything, everything has been perfected by time and experience The tool combines 5 indicators and 3 proprietary strategies works great during flats and trends It indicates a trend reversal at its very beginning, it works well with the trend Trading Recommendations The signal is formulated on the current candle You should enter the trade at the next Possible recount (rare)

CS ATR FIBO CHANNELS MULTI TIMEFRAME
Additional tool to trade with Cycle Sniper Indicator.
Cycle Sniper : https://www.mql5.com/en/market/product/51950 Indicator Draws Channels based on: - Cycle Sniper Price and Moving Averages - ATR Deviations - Fibonacci Retracement and Extensions
Features: - Multi TimeFrame - Full alert and Notification options. - Simple Settings - Finds the trend change or extreme reversals.
Inputs: - Arrow Mode: ATR Levels or Median Line If Median Line is selected ind

Moving Average Stack: MA Stack single timeframe, multi-timeframe and multi-currency versions for MT4 (Metatrader 4) Very useful for finding current and higher timeframe trends. Best suited for long term trend based trading. For quick scalping use fewer moving averages. And not suitable during low volatility. Only use during high volatility and steady trending markets. Use this to enhance your existing Trend based strategies to find best trends. Instead of using as a standalone indicator.
You ca

Royal Wave is a Trend-Power oscillator which has been programmed to locate and signal low-risk entry and exit zones. Its core algorithm statistically analyzes the market and generates trading signals for overbought, oversold and low volatile areas. By using a well-designed alerting system, this indicator makes it easier to make proper decisions regarding where to enter and where to exit trades. Features Trend-Power Algorithm Low risk Entry Zones and Exit Zones Predictions for Overbought and Over

PinBar Hunter – Smart Pin Bar Indicator with Built-in Control Panel and Signal Filters PinBar Hunter is a powerful tool for technical traders that automatically detects classic Pin Bar patterns (reversal candles) on the chart.
It’s designed for price action strategies, candlestick analysis, and trading around key support/resistance levels. Indicator Features: Detects classic Pin Bars (reversal candlestick patterns)
Works on any timeframe and instrument
Suitable for trend-following an

I recommend you to read the product's blog (manual) from start to end so that it is clear from the beginning what the indicactor offers. This multi time frame and multi symbol indicator identifies double or triple top/bottom formations or a following neckline breakout (confirmed top/bottom). It offers filters for RSI overbought/oversold, candle patterns (pin bar, engulfing, tweezer, morning/evening star, three line strike) and divergences (MACD, OsMA, Awesome (AO), RSI, CCI, Stochastic) whic
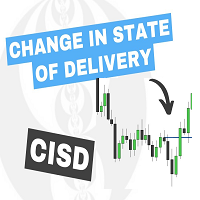
The Change In State Of Delivery (CISD) indicator detects and displays Change in State Of Delivery, a concept related to market structures.
Users can choose between two different CISD detection methods. Various filtering options are also included to filter out less significant CISDs.
USAGE Figure 2 A Change in State of Delivery (CISD) is a concept closely related to market structures, where price breaks a level of interest, confirming trends and their continuations from the resulting
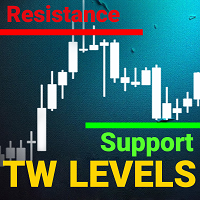
support resistance levels indicator mt4: This tool is a multi-timeframe indicator that identifies and plots support and resistance lines, as well as Fibonacci levels, on a chart with the same accuracy as the human eye. TW support and resistance levels for forex has complex algorithm that scans the chart to identify previous levels of price stabilization and rebounds, recording the number of touches.
Are you tired of manually drawing support and resistance levels and Fibonacci retracements? Ch
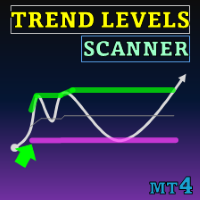
Special offer : ALL TOOLS , just $35 each! New tools will be $30 for the first week or the first 3 purchases ! Trading Tools Channel on MQL5 : Join my MQL5 channel to update the latest news from me The Trend Levels indicator is meticulously crafted to pinpoint critical trend levels—High, Mid, and Low—during market movements. With real-time calculations based on the highest, lowest, and mid-level values over a customizable lookback period, this tool provides traders with a structure

Market Heartbeat in your hand! Introduction The Market Heartbeat indicator with a special enhanced algorithm (volume, money flow, cycle of market and a secret value) is a very repetitive trend finder with a high success rate . Interestingly, this Winner indicator indicates that the trend has changed its direction or the end of a trend retracement or even appears at the range market. The Market Heartbeat can use in scalping trading or trend trading. It finds immediately with alarm, notification a
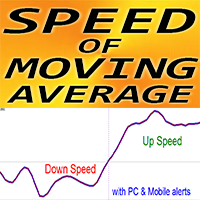
Crypto_Forex Indicator "MA Speed" for MT4, No Repaint. SPEED of Moving Average - is unique trend indicator. The calculation of this indicator is based on equations from physics . Speed is the 1st derivative of Moving average. MA Speed indicator shows how fast MA itself changes its direction. There are plenty of opportunities to upgrade even standard strategies with MA Speed . Suitable for SMA, EMA, SMMA and LWMA. It is recommended to use MA Speed in trend strategie

I recommend you to read the product's blog (manual) from start to end so that it is clear from the beginning what the indicactor offers. This multi time frame and multi symbol divergence dashboard indicator sends an alert when one or two different divergences have been identified. It can be used with all time frames from M1 to MN. It is possible to enable moving average or RSI trend filter to filter out only the strongest setups. It should be combined with your own confirmation rules, techni

No Repaint Bext is a ready-made trading system. Shows when to open and when to close trades, as well as in which direction. Every time a green arrow appears, you need to open a buy trade. Close all buy trades when a red arrow appears. The same goes for the opposite direction, every time a red arrow appears, open sell trades and close them all when a green arrow appears. We use the M5 timeframe for trading. You can trade on any cozy pair.
This indicator does not repaint and practically does not

The Signal Strength Meter is a Multi-Currency, Dual Timeframe Interactive Indicator, which calculates the strength of buy and sell signals, and displays a score for each symbol on a display board. Get a 7-Day Free Trial Version: Click Here (Full Access to The Indicator for 7 Days) Check Video Below For Complete Demonstration, and User Manual here . Key Features:
Allows you to see multiple currency signals from one chart Analyses the signals from more than a dozen classic indicators Identif
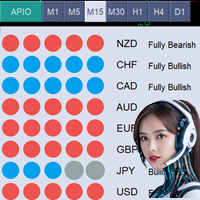
*Current Price Of Product Is 49$ For Limited Time, Next Price Of All Power In One Is 99$* All Power In One (APIO) Indicator The All Power In One (APIO) indicator is a robust tool designed to evaluate the strength of major currencies, including USD, EUR, GBP, and others. By analyzing the movements and directions of various currency pairs across selectable timeframes, APIO provides traders with clear insights into currency strengths and potential trading opportunities. MT5 Version of APIO is avai

Indicator for Scalping with Signal Arrows
Three-Level Sensitivity Setting
This indicator rapidly identifies changes in price direction and provides signals for opening positions.
Signals trigger instantly on the current candle.
It includes built-in audio and visual alerts for trend changes.
It can send notifications to your phone or email.
It works on all timeframes, across all currency pairs, metals, indices, and cryptocurrencies.
It can be used for binary options trading.
Key Featur
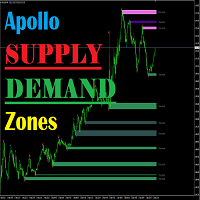
Apollo Supply Demand Zones with ALERTS is an indicator that calculates support and resistance levels. The indicator will be helpful to absolutely all traders, regardless of what strategy they use. This indicator can become one of the main elements of your trading system. The indicator calculates levels both on the current time frame and can work in MTF mode, displaying levels from a higher time frame. This indicator can be used absolutely on any time frame and with any trading instrument. The

Point Trend Indicator - An indicator of the upper and lower level of the trend, which can determine the trend direction and indicate its strengthening. The trend direction is determined by round dots; if the points are above the zero line, the trend is bullish; if below, the trend is bearish. The increase in directional movement is indicated by arrows. It has the only parameter for manual adjustment - Duration of the trend direction.
Possibilities
Works on all time frames Adapts to any financ

Multicurrency and multitimeframe indicator of the Standard Deviation Channel. Displays the current direction of the market. On the panel, you can see breakouts and touches (by price) of the levels of the linear regression channel. In the parameters, you can specify any desired currencies and timeframes. Also, the indicator can send notifications when levels are touched. By clicking on a cell, this symbol and period will be opened. This is MTF Scanner. The key to hide the dashboard from the char


The indicator is designed for binary options and short-term transactions on Forex To enter a trade when a signal appears blue up arrow buy red down arrow sell signal For Forex enter on a signal exit on the opposite signal or take profit For binary options Enter on 1 candle, if the deal goes negative, set a catch on the next candle Works on all timeframes If you apply a filter like Rsi, you will get a good reliable strategy.. The algorithm is at the stage of improvement and will be further develo
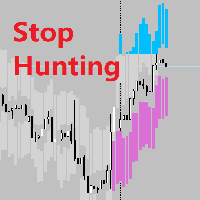
Realtime Stop Hunting Background What Is Stop Hunting? I refer to the definition of Stop Hunting from Investopedia, Stop hunting is a strategy that attempts to force some market participants out of their positions by driving the price of an asset to a level where many individuals have chosen to set stop-loss orders. The triggering of many stop losses at once typically creates high volatility and can present a unique opportunity for investors who seek to trade in this environment. Setting up the
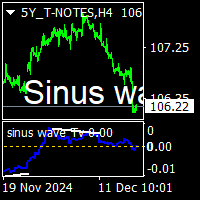
Sinus wave Tv indicator is a extra ordinary oscillator.to find divergency. For mt4 and Tradingview pine script purchased people, after installed on terminal ,contact me on mql5 to get BONUS TradingView pinescript.
it works all pairs and all timeframes. suitable for experienced and beginner traders.. indicator works on toward of the prices... while sinus wave go up side that means prices will up. and while sinus wave go down that means prices is going down. it gives divegency when trend rever
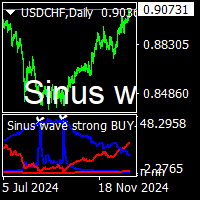
sinus wave strong buy sell indicator is nonrepaint top bottom point indicator.it work all pairs and all timeframe.suitable for beginners and experienced traders. it depend to sinus wave and vertex base .gives signal sinus wave over zero or below zero on approppirate vertex positions. cnt number has been set to 500 bars for demo mode. it can be increase to 2000 depend to charts has bar numbers. minimum value is 500. white points on red vertex spikes means sell. white points on blue vertex spikes
Scalp SWING indicator.
It works on any time frame and Instruments
It works on trending and ranging markets.
The signals are robust and does not repaint.
The system is robust and requires no supporting indicator.
You don’t need any multiple indicators to trade the markets.
The alerts/ notifications can be enabled to gain prompt entries.
The entries are at Top and Bottom of Trend Cycles
It is Very accurate and robust system- yet extremely simplified tools for the pro traders.
Scalp SWING

The ABC Indicator analyzes the market through waves, impulses, and trends, helping identify key reversal and trend-change points. It automatically detects waves A, B, and C, along with stop-loss and take-profit levels. A reliable tool to enhance the accuracy and efficiency of your trading. This product is also available for MetaTrader 5 => https://www.mql5.com/en/market/product/128178 Key Features of the Indicator:
1. Wave and Trend Identification: - Automatic detection of waves based on mov
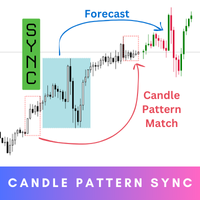
Candle Pattern Sync is your ultimate tool for precision and insight in trading. Step into the future of trading with this innovative indicator that’s designed to help you understand market behavior by analyzing historical patterns and giving you an idea of what might come next. While the forecasts provide valuable probabilities based on history, they’re not guarantees – think of them as a powerful guide to inform your decisions, not a definitive answer. MT5 Version - https://www.mql5.com/en/mar

This indicator scans and displays currency pairs that have recently aligned moving averages on a given timeframe. You can configure which pairs the indicator will scan. It also includes all types of alert options. Bullish MA Alignment = MA1>MA2>MA3>MA4>MA5
Bearish MA Alignment = MA1<MA2<MA3<MA4<MA5
Features Attach to one chart and scans all the currency pairs configured and visible in the Market Watch Window It can monitor all the available timeframes from M1 to MN1 and sends alerts on every
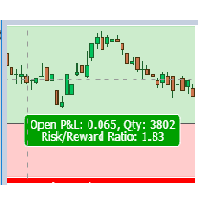
Risk Reward Panel This is a useful tool to plan a trade risk to reward visually. The indicator is very simple to use with minimum settings. Long or Short You can use the indicator for both long and short positions.
Lot Size Calculator You can also use this indicator as a lot size calculator. If you set the risk amount the indicator will calculate the lot size for you based on the stop loss line. You do not need to calculate the lot size manually.

Description: The "Divergence Strategy Indicator" is an advanced technical analysis tool designed to identify potential trend reversals and continuation opportunities in the market through the powerful concept of divergence. By detecting divergences between price and all kinds of oscillators like MACD, RSI, ATR or Stochastic ... the indicator helps traders uncover hidden opportunities, signaling potential trend shifts. Real-time alerts keep users informed when new opportunities are detected. th
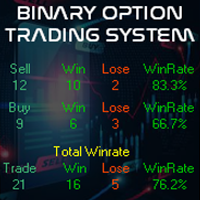
Buy And Sell Binary Option on the MetaTrader 4 (MT4) platform is a specialized technical analysis tool designed to assist traders in identifying binary option trading opportunities using the latest market algorithms. This indicator has been enhanced with an algorithm that incorporates the most up-to-date market information and processes it into a histogram. Additionally, the indicator comes with alert features, including pop-up alerts and email notifications. Latest Market Algorithm : Our indica

A. What is A2SR ?
* It's a leading technical indicator (no repaint, no lagging).
-- Guidance :
-- at https://www.mql5.com/en/blogs/post/734748/page4#comment_16532516
-- and https://www.mql5.com/en/users/yohana/blog
-- Special event : 30$ for welcoming 2025 :)
-- https://c.mql5.com/1/298/A2SR_Products_2025_B.png A2SR has a special technique in determining the levels of Support ( demand ) and Resistance ( supply ) . Unlike the ordinary way that we seen on the net, A2SR has a original con
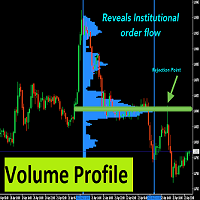
With Fixed Range Volume Profile,The traces left by the big players will not go unnoticed by you.
Professional Volume Profile Indicator reveals Institutional order flow. This advanced market indicator will teach you to spot the buying and selling. Dont want to say more because its well known by most professionals trader. This Indicator : - Quickly Identify the Strongest Institutional S/R Zones. - W orks with all Trading Instruments (Forex, Futures, Indexes, Commodities, Stocks, Cryptocur

OVERVIEW
A Lorentzian Distance Classifier (LDC) is a Machine Learning classification algorithm capable of categorizing historical data from a multi-dimensional feature space. This indicator demonstrates how Lorentzian Classification can also be used to predict the direction of future price movements when used as the distance metric for a novel implementation of an Approximate Nearest Neighbors (ANN) algorithm. This indicator provide signal as buffer, so very easy for create EA from this indi

テクニカル指標開発の第一人者であるトム・デマークが考案した TDシーケンシャルは、 トレンドの転換点を判断するのに有用なインディケータです。このインディケータは TDシーケンシャルを裁量およびEAで実際に利用してきた私自身の経験から、より手軽に、かつ効果的に活用できるよう作成された裁量トレード用サインツールです。
強いトレンドが生じている際に多くのだましが生じるのはTDシーケンシャルの弱点と思われますが、これを克服するために強力なフィルターを装備しています。また、最も有効と思われるセットアップ9に絞ってサインを発信します。
全通貨ペア、全タイムフレームで利用できます。勝敗判定機能により、このインディケータの直近の相場環境に対する有効性を確認できます。
設定項目は下記のとおりです。 Enable Protect Mode...強いトレンドが発生した際の連敗を回避します Box Filter...下で設定する3つのタイムフレームでの移動平均でパーフェクト・オーダーが発生していない状態をボックス相場と判定し、サインを限定します Moving Average Time Frame1 Mo

Introduction Harmonic Patterns are best used to predict potential turning point. Traditionally, Harmonic Pattern was identified manually connecting peaks and troughs points in the chart. Manual harmonic pattern detection is painfully tedious and not suitable for everyone. You are often exposed under subjective pattern identification with manual pattern detection. To avoid these limitations, Harmonic Pattern Plus was designed to automate your harmonic pattern detection process. The functionality

Was: $69 Now: $49 Blahtech VWAP - Volume Weighted Average Price (VWAP) is the ratio of price to total volume. It provides an average price over a specified time interval. Links [ Install | Update | Documentation ] Feature Highlights
Configurable VWAP Line Sessions, intervals, anchored or continuous Previous day settlement line Standard Deviation bands Alerts at bar close or real time Automatic Broker or Tick volumes Significantly reduced CPU usage
Input Parameters
Expert Advisor

This indicator is designed to detect high probability reversal patterns: Double Tops/Bottoms with fake breakouts . Please read also the blog post " How To Yield Big Winners Consistently! " which explains the concepts behind the ULTIMATE Double Top/Bottom indicator and how you can use a top-down approach to get 15 - 20R winning trades on a regular basis . The provided video shows the maximum performance of the indicator. With maximum performance, I mean that this could have been the profit if you

One of the very few indicators that calculate levels solely based on price. The indicator is not affected by time frames, trends, or market cycles. One of the most logical indicators ever made.
The FIFTY indicator now comes in an automated version, removing the need for manual level drawing. This version automatically plots daily, weekly, monthly and yearly levels on the chart, ensuring accuracy and saving time. Additionally, buttons are provided for toggling the visibility of these levels, off

Currency Power Meter shows the power of major currencies against each other. The indicator shows the relative strength of currency/pair at the current moment in a period of time (H4, daily, weekly, monthly). It is useful for day traders, swing traders and position traders with suitable period options. Currency power is the true reason of market trend: The strongest currency against the weakest currency will combine into a most trending pair. As we know, trend makes money and all traders love tre

This indicator has been developed to identify and display these trends quickly and easily, allowing you to see instantly, those currency pairs which are trending, and those which are not – and in all timeframes, with just one click. The 28 currency pairs are displayed as a fan as they sweep from strong to weak and back again, and this is why we call it the ‘currency array’. All 28 pairs are arrayed before you, giving an instant visual description of those pairs that are trending strongly, those

Of all the four principle capital markets, the world of foreign exchange trading is the most complex and most difficult to master, unless of course you have the right tools! The reason for this complexity is not hard to understand. First currencies are traded in pairs. Each position is a judgment of the forces driving two independent markets. If the GBP/USD for example is bullish, is this being driven by strength in the pound, or weakness in the US dollar. Imagine if we had to do the same thing

This scanner is for showing Cross of various TDI elements: PriceLine, Trade Signal Line and Market Base Line And for getting alerts, so you can be prepared for finding good trade setups before they happen. It also shows TDI signals, trend, volatility and different timeframe alignment.
Detailed blog post:
https://www.mql5.com/en/blogs/post/759050
Features: Show TDI Signal and Trend Show Volatility & Overbought/Oversold Show cross between: PriceLine & TSL PriceLine & MBL MBL & TSL PriceLine and
SURE REVERSAL is a histogram overbought/oversold type indicator that gives key reversal points that indicates a bull or bear market movment this indicator is fusion between moving average and the rsi indicator ,this indicator is non repainter , and is not delayed . Parameters : Ma period Ma Method Ma Price Sure Period (Rsi) Sure Price (Rsi) ==============
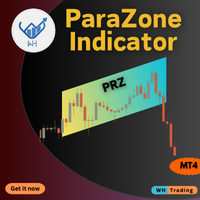
The ParaZone Indicator MT4 helps you spot areas where price trends are likely to reverse. It marks these zones on your chart using a unique parallelogram shape, making it easier to find the best points to enter or exit trades. Whether you’re a beginner or experienced trader, this tool can help improve your trading decisions. Key Features: Accurate Reversal Detection: Identifies key zones where price may change direction. Dynamic Zone Adaptation: Zones adjust in real-time to follow market
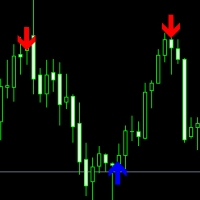
Price reversal Pro - points where the price will reverse with a 95% probability. This information will help every trader to effectively open trades. The indicator on the chart draws arrows in which place and in which direction the price will reverse. You need to wait for the indicator to draw an arrow and open an order in the indicated direction. This is the simplest trading strategy. The indicator does not redraw its arrows and shows price reversals for medium and long distances. This means th
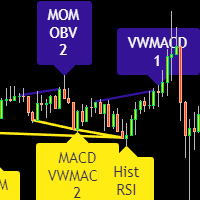
Divergence indicator 10 different indicators. Finding and displaying classic and hidden divergences.
Indicators in which divergences are searched: MACD MACD Histogram; RSI; Stochastic; CCI; momentum; OBV; VWmacd; Chaikin Money Flow; Money Flow Index. This is a replica of the indicator from the tradingview resource, adapted for the MT4 terminal.
MT5 version available here: https://www.mql5.com/en/market/product/87879
Settings: Bars in history for analysis - number of bars for analysis; Diver

The "Scalper_PRO" indicator is a basement indicator in the form of two lines and signals without redrawing or lag on the chart. The "Scalper_PRO" indicator shows on the chart the best entry points along the trend. The indicator shows good results on the M1 timeframe. The signal is generated after the candle closes and appears in the form of blue and red arrows with preliminary signals in the form of dots. The "Scalper_PRO" indicator is designed for scalping. The screenshots show examples of posi

Adaptive Volatility Range [AVR] is a powerful tool for identifying key trend reversal points. AVR accurately reflects the Average True Range (ATR) of volatility, taking into account the Volume-Weighted Average Price (VWAP). The indicator adapts to any market volatility by calculating the average volatility over a specific period, ensuring a stable rate of profitable trades. You receive not just an indicator but a professional automated trading system , AVR-EA . Advantages: Automated Trading Sys
COMPLETE VISUAL TRADING SYSTEM WITH THE BUY SELL SIGNALS - USING MULTI TIME FRAME TREND ANALYSIS
TREND STRENGTH POWER SIGNALS DASHBOARD.
TRADE INTRADAY, SHORT OR MEDIUM OR LONG TIME FRAME .
ALL THE SIGNALS WITH A MULTIPLE TIME FRAME TREND CONFLUENCE - INDICATES A STRONG MOVE AND CAN BE EASILY TRADED AS HIGH PROBABILITY TRADES.
COMPLE TRADING SYSTEM - WITH THE LOGICAL ENTRY , TARGETS AND STOP LOSS .
THE ALERTS ON THE DISPLAY SIDE OF THE ALERTS PANEL AREA , WILL INDICATE CLEARLY ALL THE ENTR

"Trend reversal ml4" is a unique indicator designed to determine the moments of price reversal in real time. This is a ready-made trading system for Metatrader4. The indicator does not redraw its values! Based on advanced algorithms and technical analysis, this indicator provides you with clear signals about possible market entry and exit points, helping you make informed decisions.
Advantages of the indicator: high signal accuracy. the indicator itself shows the trader whether it is configure

PAAIOS stands for Price Action All In One Solution. And that is the purpose of the Indicator. It should give you a tool to improve your trading decisively because you get the crucial information at a glance. The indicator simplifies the search for strong signals. It shows trend lines, support and resistance, demand and supply zones from freely selectable time frames. Below you will find a short description of the functions of the indicator. Please read my blog entry to learn more. Features
de
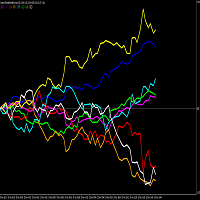
PLEASE NOTE THAT LIKE MANY SUCH INDICATORS ON THIS MARKET, THIS INDICATOR WILL NOT WORK AS A DEMO DOWNLOAD FOR STRATEGY TESTER. Therefore the 1 month option at the lowest cost allowed of $10 is available for you to test. One of the better ways to trade is to analyse individual currencies rather than currency pairs. This is impossible with standard chart indicators on MT4. This currency strength meter allows one to trade the strongest with the weakest currency. The meter includes the curren

What is a Point of Interest? Traders who follow Smart Money Concepts may call this a Liquidity Point, or where areas of liquidity have been built up by retail traders for for Big Banks to target to create large price movements in the market. As we all know, retail traders that use outdated and unreliable methods of trading like using trendlines, support and resistance, RSI, MACD, and many others to place trades and put their stop losses at keys points in the market. The "Big Banks" know these me

What is Elliott Wave analysis all about? You probably heard something about Elliott waves or even seen wave counts. That's because nowadays Elliott wave analysis becomes one of the most popular approaches of the Forex market forecasting. Why? Elliott Wave Principle is the only tool in our experience, which can sort out the price movement on every timeframe from the Monthly or even Yearly chars to just one-minute intraday intervals. The Elliott Wave Theory is a technical analysis concept used to

Graf Mason is a tool that will make you a professional analyst! The method of determining wave movements using inclined channels qualitatively conveys the schematics of the movement of any instrument, showing not only possible reversals in the market, but also the goals of further movements!Destroys the myth that the market is alive , clearly showing the schematics of movements from one range to another! A professional tool, suitable for the medium term with the definition of the current trend!
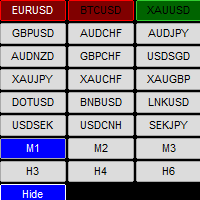
** NOTE: This indicator uses realtime data. Thus DO NOT download Demo version. If you still need demo version, please refer to free version .
Symbol Chart Changer is an indicator/utility that offers you the option to switch between symbols and timeframes.
You can choose any symbol and timeframe on the same chart with just a few clicks. In addition, this indicator also shows the profit of the symbol through the color of the buttons.
Features: Click buttons on the chart to monitor a
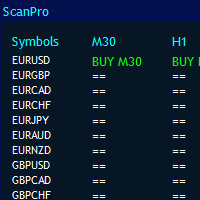
MT4 Universal Panel pro is designed for all indicators and timeframes as Universal Scanner, including ex4 files. It is a indicator signaler and indicator alerter.
It can scan limitless pairs based on your computers power and up to 10 time frame. Size of panel will arranged automatically. you can call any indicator by buffers.
It works for all default and custom indicators. You can simply use it for heikan ashi, rsi, parabolic, renko, fractals, support resistance, supply demand, divergence, hig
The KT Knoxville Divergence is a powerful tool that reveals unique price divergences in a financial instrument by employing a carefully crafted combination of the Relative Strength Index (RSI) and a momentum oscillator. This indicator effectively captures subtle variations in market dynamics and assists traders in identifying potentially profitable trading opportunities with greater precision. Knoxville Divergences is a type of divergence in trading developed by Rob Booker. Divergence in tradin

This indicator draws the prior Highs and Lows for multiple timeframes, and can display potential Take Profit and Stop Loss levels. In Rob Smith's # The Strat terms, these are potential entry points, or alternatively potential targets for open positions. I like to use them in both ways. On a lower timeframe, say 5 minutes to get a good entry on a daily or weekly level, and then as a potential target. Very small stops required giving an excellent risk/reward ratio. Please watch the DEMO video

If you are searching for a reliable indicator to trade the ICT concept,The ICT Market Structure provide a user manual for traders using more advanced strategies. This all-in-one indicator focuses on ICT Concepts(Smart Money Concepts). ICT Market Structure trying to understand how institutions trade, helping predict their moves. By understanding and utilizing this strategy, traders can gain valuable insights into market movements and finding more practical entries & exits based on price action. H
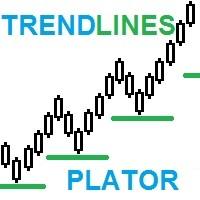
TrendPlator: Empower Your Trading Strategies with an Advanced Trend Projection Indicator Explore the potential of our innovative indicator! With the ability to analyze and project trend lines from larger timeframes directly onto your current timeframe, it provides strategic support that catches the attention of traders across the board. These points become strategic levels of support or resistance for your trades, strengthening your trading strategy. Visualize the opportunity to add an indicator

M & W Pattern Pro is an advanced scanner for M and W patters , it uses extra filters to ensure scanned patterns are profitable.
The indicator can be used with all symbols and time frames.
The indicator is a non repaint indicator with accurate statistics calculations.
To use , simply scan the most profitable pair using the statistics dashboard accuracy , then enter trades on signal arrow and exit at the TP and SL levels.
STATISTICS : Accuracy 1 : This is the percentage of the times price hits TP
Professional Trade Arrow
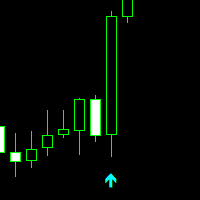
Special offer! https://www.mql5.com/ru/users/bossik2810 Non-repaint MT4 technical indicator.
works on all timeframes 1 minute to the monthly timeframe
the trade vision buy and sell arrow is a multi currency and synthetic indicator
Aqua arrow look for selling opportunities
Crimson arrow look for buying opportunities.
wait for candle to close and arrow to appear before taking any trades.
Settings: Key value - 3.0 ( This parameter is adjusted for a better sig

This indicator will draw patterns based on Rob Smith's The Strat as they emerge in real time on your chart.
As price evolves, TheStrat offers 18 distinct price action patterns that can help you get good entries in the market. Each pattern involves two or three candles, and this indicator will draw a bounding box around the candles and name the pattern. The indicator also shows when a potential setup is forming, known by stratters as an Actionable signal.
Candles
Each candle is defined by its
The FVG Zone Indicator is a powerful tool designed to identify Fair Value Gaps (FVG) in the market, highlighting price imbalances between fair value and market price. This precise identification of gaps enables traders to spot potential market entry and exit points, significantly enhancing their ability to make informed trading decisions. With its intuitive and user-friendly interface, the FVG Zone Indicator automatically scans charts for Fair Value Gaps, marking these zones on the price chart i

KT Bollinger Bands Alert is a modified version of the classic Bollinger Bands added with price touch alerts and visible price tags for each band separately.
Alert Events
When the current price touches the upper Bollinger band. When the current price touches the middle Bollinger band. When the current price touches the lower Bollinger band.
Features Separate alert events for each band. Ability to specify a custom interval between each alert to prevent repetitive and annoying alerts. Added price
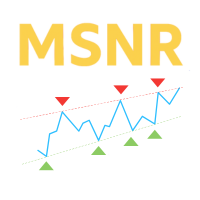
Malaysian Levels is a custom indicator designed to display Support and Resistance levels on a chart. These levels are based on Malaysian Support and Resistance theory, which defines levels not as areas but as specific price levels derived from line chart peaks and valleys. Features: Three types of levels: A-Level, V-Level, and Gap Level. Freshness indication for levels: Fresh levels are more significant than unfresh levels. Customizable color and style for fresh and unfresh levels. Option to

The indicator shows the trend of 3 timeframes: higher timeframe; medium timeframe; smaller (current) timeframe, where the indicator is running. The indicator should be launched on a chart with a timeframe smaller than the higher and medium ones. The idea is to use the trend strength when opening positions. Combination of 3 timeframes (smaller, medium, higher) allows the trend to be followed at all levels of the instrument. The higher timeframes are used for calculations. Therefore, sudden change
MetaTrader Market - trading robots and technical indicators for traders are available right in your trading terminal.
The MQL5.community payment system is available to all registered users of the MQL5.com site for transactions on MetaTrader Services. You can deposit and withdraw money using WebMoney, PayPal or a bank card.
You are missing trading opportunities:
- Free trading apps
- Over 8,000 signals for copying
- Economic news for exploring financial markets
Registration
Log in
If you do not have an account, please register
Allow the use of cookies to log in to the MQL5.com website.
Please enable the necessary setting in your browser, otherwise you will not be able to log in.