Conheça o Mercado MQL5 no YouTube, assista aos vídeos tutoriais
Como comprar um robô de negociação ou indicador?
Execute seu EA na
hospedagem virtual
hospedagem virtual
Teste indicadores/robôs de negociação antes de comprá-los
Quer ganhar dinheiro no Mercado?
Como apresentar um produto para o consumidor final?
Pagamento de Indicadores Técnicos para MetaTrader 4 - 12
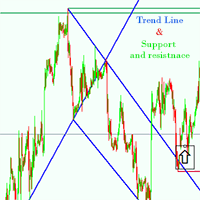
Support and resistance Strategy is one of the most widely used concepts in forex trading.
Strangely enough, everyone seems to have their own idea on how you should measure forex support and resistance. no more wasting time This Indicator is made to do it automatically for you, Features of support and resitance indicator * Automatically detection of the trend line and support & resistance * Works on any pair any time frame any time * Works on offline Chart Inputs : TrendLinePeriod=900 CycleSi

Introducing Auto Trendline Pro : Your Ultimate Trading Companion Are you tired of manually drawing trendlines on your forex charts? Do you wish for a tool that can simplify your trading while providing timely alerts? Look no further, because Auto Trendline Pro is here to revolutionize your trading experience. In the fast-paced world of forex trading, staying ahead of the curve is essential. Identifying trends, both upward and downward, can be a game-changer. This is where Auto Trendline Pro s

MT5 Version SMT Divergences MT4
SMT Divergences is one of the most innovative indicators in the market. It offers the possibility of analyzing price divergences between 2 pairs. These divergences highlight and help to foresee what banks and institutions are planning to do. SMT divergences also provides you with a kill zones indicator and the possibility of filtering divergences occurring during these kill zones. The strategy tester is limited in MT4. Contact the author to get your Demo Version
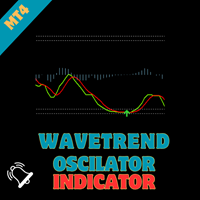
WaveTrend Oscillator - Bringing Tradingview's Renowned Indicator to MQL Elevate your trading strategies with the "WaveTrend Oscillator," an MQL port of the renowned TS/MT indicator created by Lazybear on tradingview. This powerful indicator provides valuable insights into market dynamics, offering clear signals for optimal entry and exit points in your trades.
Key Features : Proven Effectiveness : Based on the popular TS/MT indicator, the WaveTrend Oscillator brings a time-tested and proven ap

An indicator based on candlestick patterns
To catch short-term and long-term trends
If it gives a signal in the direction of the trend, it is long term
And if it gives a signal in the opposite direction of the trend, it is short term
Too many signals
Can be used in all symbols
Can be used in all time frames
Attributes: Too many signals Can be used in all symbols Can be used in all time frames Simple settings Simple and fast usage With author lifetime support
Settings: Candle back: Th

50% Off Today Only! Price Goes Back Up at 11 PM (EST)
uGenesys Volume Indicator: Your Key to Mastering Market Volume Analysis What Traders Are Saying: "A must-have indicator...really a game-changer." – wuzzy66 "Amazing indicator...strongly recommend to beginners." – joinbehar Understanding Market Volume: Volume in the market is a critical indicator of movement and opportunity. The uGenesys Volume Indicator is specially crafted to pinpoint when the market has the most volume, allowing you to

The Candle Patterns indicator shows popular candle patterns on the chart. The possible patterns are Inside Bar, Large Wick, Engulfing, Marubozu, Hammer, Shooting Star, Three White Soldiers and Three Black Crows. Candles are colored to easily identify the patterns. Also, a point and click function displays the pattern found.
Settings Message box - when a candle is clicked, the pattern identified will be shown in a Message Box on the charts. All 'Message Box' settings pertain to the box. Show In

Two Period RSI + Alerts compares long-term and short-term RSI lines, and plots a fill between them for improved visualization. Fill is colored differently according to an uptrend (short period RSI above long period RSI) or a downtrend (short period RSI below long period RSI). Short-term RSI crossing long-term RSI adds a more robust trend confirmation signal than using single period RSI alone. This is a tool to help visualize and confirm RSI trends. We hope you enjoy!
Alerts Email, message, and

Oversold and Overbought Candles, Trendlines, and BUY-SELL arrows in the single Indicator. Built from 8 default MT4 Indicators. Stochastic,RSI,SAR,CCI,RVI,DeMarker,WPR and MA. It is " NON REPAINT " indicator. All buffers do not repaint. Double Trendline buffers that can also be used to identify sideway market and support resistance area. Any timeframes and any currency pairs.
Parameters: Show Trend . TRUE/FALSE to show trendlines on the chart Follow Trend. If TRUE , Dapitrend will show on
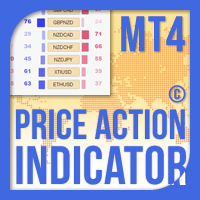
O Indicador de Ação de Preço MT4 calcula o equilíbrio do nível da força de compra / venda de qualquer símbolo / instrumento, com base em dados puros de ação de preço das velas anteriores especificadas (8 por padrão). Isso lhe dará o sentimento de mercado mais próximo possível, monitorando a ação do preço de 32 símbolos / instrumentos que estão disponíveis no painel do indicador. Um nível de força de compra / venda acima de 60% dá um nível bastante sólido para comprar / vender o símbolo específi
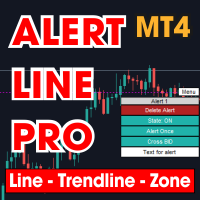
This is MT4 version , MT5 on this link : Alert Line Pro MT5 Alert line pro allows to make alert when price cross these objects: Horizontal lines Trendline Price Zone (Rectangle) Alert when close current bar (have new bar) When the price crosses the alert lines, the software will sound an alarm and send a notification to the MetaTrader 4 mobile application. You need to settings your MetaQuotes ID of MT4 apps to MetaTrader4 software to get notification to the mobile phone. Sound files must be

The main aim of this indicator lies in determining entry and exit points, that is why the ExactArrow indicator does not draw nothing but arrows which show entry and exit points. In spite of apparent simplicity of the indicator, it has complicated analytic algorithms which determine entry and exit points. The indicator generates exact and timely entry and exit signals which appear on the current candle. The indicator generates an average of 1-2 candles before its analogues do. The indicator is ve

Ultimate MTF Support & Resistance - 5 Star Best Seller Beginner or Professional our best selling multi-timeframe Pivot Prof will enhance your trading and bring you great trade opportunities with the Support and Resistance levels that professionals use. Pivot trading is a simple effective method for entering and exiting the market at key levels and has been used by professionals for decades and works on all symbols: Forex, Crypto, Stocks, Indicies etc. Pivot Prof brings premium levels to the trad

This scanner shows the trend values of the well known indicator Parabolic SAR for up to 30 instruments and 8 time frames. You can get alerts via MT4, Email and Push-Notification as soon as the direction of the trend changes.
Important Information How you can maximize the potential of the scanner, please read here: www.mql5.com/en/blogs/post/718074
You have many possibilities to use the scanner. Here are two examples: With this scanner you can trade a top-down approach easily. If two higher t

This scanner shows the trend values of the well known indicator SuperTrend for up to 30 instruments and 8 time frames. You can get alerts via MT4, Email and Push-Notification as soon as the direction of the trend changes.
Important Information How you can maximize the potential of the scanner, please read here: www.mql5.com/en/blogs/post/718074
You have many possibilities to use the scanner. Here are two examples: With this scanner you can trade a top-down approach easily. If two higher time

Determining the current trend is one of the most important tasks of a trader, regardless of the trading style. The Creative Trend indicator will help you do this with a fairly high probability. Creative Trend is a trend recognition indicator that uses the author's calculation algorithm. The indicator readings do not change under any conditions. The indicator is suitable for any currency pair, any timeframe, as long as there is enough historical data for calculations. Indicator Parameters
Main S
This indicator was specially developed to support the powerful day trading strategy described in the book "The Price in Time". The NTZ BOX indicator automatically creates: The Day separators The No Trading Zone divided with the Green Box, the Peach Box and the Turqoise Box Extensions of the long and short Take Profit levels The Yellow Box to display the range of the Asian session The Money Manager for a perfect Position Sizing calculated on your risk percentage Using the NTZ BOX indicator will e
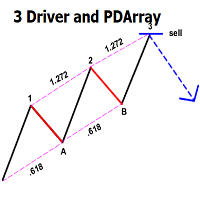
This indicator automatically identifies the SMC 3-Drive pattern and sends notifications to users when the pattern is detected. Additionally, the indicator identifies PDArray (including FVG and OB) and offers an option to combine the 3-Drive pattern with PDArray. This combination provides users with more reliable signals. What is the 3-Drive Pattern? This pattern is formed by three price pushes in one direction, providing a strong reversal signal (Figure 3). The key to identifying this pattern is
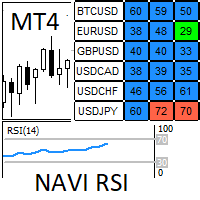
Navi RSI: Busca em cada símbolo e seus respectivos espaços temporais o sinal de índice de força relativa em sobrecompra ou sobrevenda. Nós navegamos pelos gráficos muito confortavelmente e economizando muito tempo. Tanto os sinais visuais quanto as alertas são gerados quando o RSI está nessas áreas de sobrecompra e sobrevenda. Os sinais visuais e as alertas são independentes tanto em símbolos quanto em timeframes, muito úteis para gerenciar alertas para o celular quando não estamos presentes. P
The Ultimate Dashboard Indicators are useful for traders, but when you put them into a dashboard that can scan 28 symbols at once they become even better, and when you can also combine different indicators and timeframes to give you synchronized alerts, then they become awesome. This easy to use dashboard provides you with 23 leading indicators, use them individually or together, to create powerful combination alerts. So when you want to know that RSI is above 25 and the price is above the movin

Monster Harmonics Indicator is a harmonic pattern indicator. It recognizes Gartley, Bat, Crab, Butterfly, Cypher, White Swan, Black Swan, Shark and several other patterns. Projected patterns that are not yet completed are recognized, too. Monster even shows the PRZ (Potential Reversal Zone). Users can add their own user defined patterns to Monster. Besides the current pattern, Monster also shows all patterns in the symbols history. Monster will provide alerts for developing patterns. Introduced

MetaForecast prevê e visualiza o futuro de qualquer mercado com base nas harmonias nos dados de preços. Embora o mercado nem sempre seja previsível, se houver um padrão nos preços, o MetaForecast pode prever o futuro com a maior precisão possível. Em comparação com outros produtos similares, o MetaForecast pode gerar resultados mais precisos ao analisar as tendências do mercado.
Parâmetros de entrada Past size (Tamanho do passado) Especifica o número de barras que o MetaForecast usa para criar
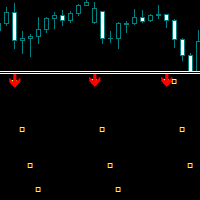
Um indicador técnico concebido especificamente para o scalping que pode identificar impulsos de volatilidade e mostrar a sua duração.
Possui parâmetros flexíveis para configurações manuais, permitindo aplicar a funcionalidade do indicador a qualquer instrumento de negociação.
Os prazos recomendados para utilização são M5, M15, M30, H1 e H4.
Existem vários tipos de alertas.
Todos os sinais nunca mudam ou mudam de cor no fecho da vela.
O indicador é configurado por parâmetros de cima para b
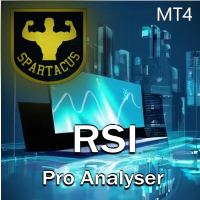
O indicador RSI Pro Analyzer é uma ferramenta poderosa projetada para traders que buscam tomar decisões informadas em vários intervalos de tempo simultaneamente. Este indicador utiliza o RSI para fornecer sinais de sobrecompra, sobrevenda e tendência , facilitando a identificação de oportunidades de entrada no mercado. Sua principal vantagem é a facilidade de leitura graças aos códigos de cores claros e distintos para indicar as diferentes condições do mercado.
O indicador exibe valores RSI e

Market Cycles is a unique proprietary indicator that uses a neural network to determine the current market phase.
For training, the neural network uses cyclic (reversal) patterns.
Currency markets tend to cycle from bearish to bullish periods and back again.
In this product, we combined patterns from four timeframes (M5, M15, M30, H1), which allowed us to significantly increase the accuracy of the signals!
Market Cycles should be used on the EURUSD currency pair, M30 timeframe!
Be

Was: $99 Now: $34
Blahtech Daily Range indicator displays the average daily range alongside the individual session ranges. Using the daily open price as a reference the indicator shows fixed range and dynamic range targets as lines on the charts. These lines clearly show when the average range has been exhausted. Daily and session ranges can be useful for confirming entries or setting targets and is an excellent odds enhancer for many trading systems. Links [ Documentation | Install |
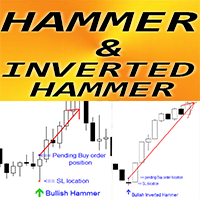
Indicador Forex "Padrão de martelo e martelo invertido" para MT4
O indicador "Padrão Martelo e Martelo Invertido" é um indicador muito poderoso para negociação de Price Action: Sem repintura, Sem atrasos; O indicador detecta padrões de alta do Martelo Invertido e do Martelo no gráfico: Martelo Invertido de Alta - Sinal de seta azul no gráfico (ver fotos) Martelo de alta - sinal de seta verde no gráfico (ver fotos) Alertas de PC, celular e e-mail estão incluídos Indicador "Martelo e padrão de
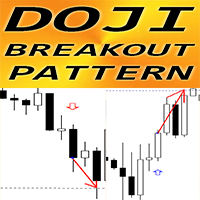
Indicador Forex "Doji Breakout Standard" para MT4
O indicador "Doji Breakout Standard" é pura negociação de Price Action: sem repintura, sem atrasos; O indicador deteta o rompimento do padrão Doji na direção da tendência, em que a vela Doji está no meio do padrão e a última vela é o rompimento: Padrão Doji Breakout de alta - sinal de seta azul no gráfico (ver fotos) Padrão de quebra Doji de baixa - sinal de seta vermelha no gráfico (ver fotos) Alertas de PC, telemóvel e e-mail estão incluídos
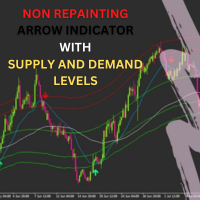
*****ARROWS NON REPAINT ***** Trade With Sam Simple Strategy Guide : https://www.mql5.com/en/blogs/post/740855
MT5 version of the indicator
Try Out and see the Difference
The Sam's Trend Blaster indicator tracks the market trend with an unmatched reliability, by ignoring sudden fluctuations and market noise. It has been designed to trend-trade intraday charts and small timeframes. Its winning ratio is around 85%. This is an arrow indicator that shows precise price reversals. A great ar
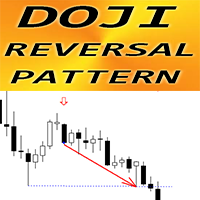
Indicador Forex "Padrão de reversão Doji" para MT4
O indicador "Padrão de reversão Doji" é pura negociação de ação de preço: sem repintura, sem atrasos; O indicador deteta o padrão de reversão Doji no gráfico em que a vela Doji está no meio do padrão e a última vela é a de rutura: Padrão de reversão Doji de alta - sinal de seta azul no gráfico (ver fotos) Padrão de reversão Doji de baixa - sinal de seta vermelha no gráfico (ver fotos) Alertas de PC, telemóvel e e-mail estão incluídos Indicado

Market Heartbeat in your hand! Introduction The Market Heartbeat indicator with a special enhanced algorithm (volume, money flow, cycle of market and a secret value) is a very repetitive trend finder with a high success rate . Interestingly, this Winner indicator indicates that the trend has changed its direction or the end of a trend retracement or even appears at the range market. The Market Heartbeat can use in scalping trading or trend trading. It finds immediately with alarm, notification a

This scanner is monitoring the entire market for trade opportunities for all symbols and for all time frames. You don't have to look to all the charts, for all symbols and for all time frames. This scanner will alert you on your computer, or on your mobile, when a trade opportunity has been found. You never have to miss a trade opportunity! This indicator is designed to scan all pairs and symbols, for all time frames, to find a cross of the MACD main and signal line. MACD Definition
The
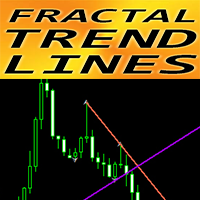
Indicador Forex "Linhas de Tendência Fractal" para MT4
Este indicador é excelente para traders que utilizam Análise Gráfica com breakouts!!! "Fractal Trend Lines" mostra linhas gráficas de tendência ascendente (violeta) e tendência descendente (cor tomate). As linhas de tendência de alta e tendência de baixa são construídas em 2 fractais correspondentes mais próximos O indicador possui poucos parâmetros responsáveis pela cor e largura das linhas de tendência O indicador possui alerta integr

The FCPI indicator or Forex Currency Power Index indicator for MT4 is a multi currency pairs indicator that displays 28 pairs on 1 chart, which consists of 8 Major Pairs and 20 Cross pairs. 8 Major Pairs and 20 Cross pairs: EURUSD,GBPUSD,AUDUSD,NZDUSD,USDCAD,USDCHF,USDJPY,EURGBP,EURAUD,EURNZD,EURCAD,EURCHF,EURJPY,GBPAUD, GBPNZD,GBPCAD,GBPCHF,GBPJPY,AUDNZD,AUDCAD,AUDCHF,AUDJPY,NZDCAD,NZDCHF,NZDJPY,CADCHF,CADJPY,CHFJPY. Automatically detects symbols that have a symbol prefix and/or a symbol suffi

Scanner Dashboard for Best Heiken Ashi VQZZ Arrows Indicator here: https://www.mql5.com/en/market/product/45900 Check out this post for detailed description on How To Use All Indicator extras and template: https://www.mql5.com/en/blogs/post/758259
Please note that if you are using too many pairs/timeframes, then VQZZ calculations might slow down the dashboard. So be careful not to use too many VQZZ Higher timeframes if you are using too many pairs.
Also, VQZZ is based on higher timeframes. e
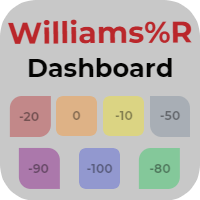
The Williams Dashboard is an information panel which allows you to have a global market vision through a Williams Percent Range. Williams Dashboard analyzes and tracks all the assets you want to invest in. Take advantage of this useful dashboard where you can open in a few seconds the chart and quickly invest in it.
Main Features of Williams Dashboard Graphic panel that allows you to know the situation of many assets. 7 Different Williams Percent Range situations to discover when an asset is o
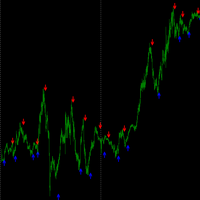
This indicator gives you nice trigger entry....whatever it is your trading style. You can use on different timeframes and also you can select from the setting the sensibility of the indicator itself, changing the input parameter "cycle period". For faster trigger signals you need to use shorter "cycle periods". You can use it in reversal strategy as well as in trending strategy. Added: - Sound Notification - PopUp Notification - Mobile Push Notification (To make it work follow the inst
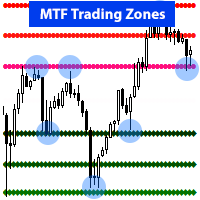
Not a traditional support resistance, or pivot point indicator. RevCan's " Early Reversal - MTF Trading Zones " is an Advanced tool that identifies potential market reversal points, or change of a trend at an early stage using MTF chart analysis. >> It analyzes multiple chart timeframes (MTF) to find these key price turnover zones where big banks and institutions are likely to place their trades, hence chances for you for high probability trade entry, Stop loss, and Take profit targets to maximi

FOTSI (Forex Overview True Strength Index) for MT4 FOTSI is an indicator that analyzes the relative strength of currencies in major Forex pairs. It aims to anticipate corrections in currency pairs following strong trends by identifying potential entry signals through overbought and oversold target areas. Theoretical Logic of Construction: Calculation of Individual Currency Momentum: FOTSI starts by calculating the momentum for each currency pair that includes a specific currency, then aggregates

The Th3Eng Ninja indicator is based on an analysis of the right trend direction with perfect custom algorithms. It show the true direction and the best point of the trend. With Stop Loss point and Three Take Profit points. Also it provides a secondary entry points in dots arrows style. And Finally it draws a very helpful lines from entry level to TP1, TP2, TP3, SL levels or the reverse signal, and all current/old signals status.
How to use the indicator
No complicated steps , Just follow 2
O indicador apresenta o padrão "Rails" no gráfico. Este padrão consiste em duas velas multidireccionais com corpos idênticos e pequenas sombras. Se no período de tempo atual o padrão "Rails", no período de tempo x2 parecerá uma Pin Bar (Doji). Este indicador foi criado para encontrar automaticamente o padrão da forma mais eficiente com configurações logicamente simples que podem ser facilmente alteradas. Existe a opção de filtrar por tendência (2 médias móveis) e inversão (RSI e Bandas de Bolli

[V 1.00] O MTF NRPA 5 Moving Average RTD foi lançado!
Painel em tempo real de seta sem repintura.
Se você está procurando o melhor indicador de média móvel, está na página certa. Geralmente as pessoas instalarão duas médias móveis porque a interseção das duas médias móveis (o cruzamento) determinará a direção da próxima tendência de preço. Se a média móvel rápida cruzar com a média móvel lenta e rápido > lento, a tendência é de alta. Por outro lado, se a média móvel rápida cruzar com a médi

O indicador desenha automaticamente os níveis de Fibonacci com base no indicador ZigZag, sessões de negociação, fractais ou velas (incluindo períodos de tempo não padrão: ano, 6 meses, 4 meses, 3 meses, 2 meses) (Retração Fibo Automática). Você pode escolher qualquer período de tempo superior para o cálculo de Fibonachi. Os níveis são redesenhados sempre que a barra atual fecha. É possível ativar alertas ao cruzar os níveis especificados.
Você também pode analisar níveis no histórico. Para fa
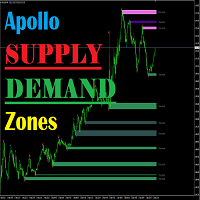
Apollo Supply Demand Zones é um indicador que calcula os níveis de suporte e resistência. O indicador será útil para absolutamente todos os traders, independentemente da estratégia que eles usam. Este indicador pode se tornar um dos principais elementos do seu sistema de negociação. O indicador calcula os níveis tanto no período de tempo atual quanto pode funcionar no modo MTF, exibindo níveis de um período de tempo mais alto. Este indicador pode ser usado absolutamente em qualquer período de te
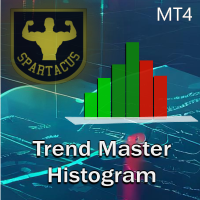
Trend Chart Histogram é um indicador baseado em um algoritmo que usa duas médias móveis e vários osciladores. Graças ao seu código de cores, permite identificar rapidamente a tendência e aproveitar os maiores impulsos do mercado.
As cores claras indicam a tendência, as escuras definem os impulsos e o cinza indica que você não deve entrar no mercado.
Versão MT5 aqui.
Parâmetros de entrada:
- Período 1 (período rápido)
- Período 2 (período lento)
- Período do oscilador
Você pode a
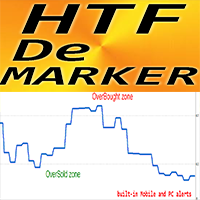
Indicador Forex HTF DeMarker para MT4
Este indicador é uma ferramenta útil utilizada pelos traders técnicos para encontrar pontos de entrada e saída. HTF significa - Prazo Superior. A linha do oscilador DeMarker indica a posição atual do preço em relação aos máximos e mínimos anteriores DeMarker fornece os sinais de divergência regulares mais eficientes entre outros osciladores Zona OverBought é quando o DeMarker está acima de 0,7 e OverSold - quando está abaixo de 0,3 O indicador possui aler
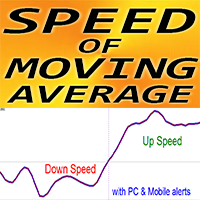
Indicador Forex "MA Speed" para MT4, sem repintura.
VELOCIDADE da média móvel - é um indicador de tendência único
O cálculo deste indicador baseia-se em equações da física. A velocidade é a primeira derivada da média móvel O indicador MA Speed mostra a rapidez com que o próprio MA muda de direção Existem muitas oportunidades para atualizar até mesmo as estratégias padrão com o MA Speed. Adequado para SMA, EMA, SMMA e LWMA Recomenda-se a utilização do MA Speed em estratégias de tendê
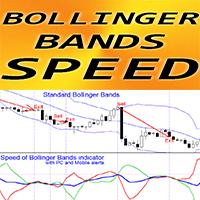
Velocidade das Bandas de Bollinger - é um indicador de tendência único
O cálculo deste indicador é baseado em equações da física. A velocidade é a primeira derivada das Bandas de Bollinger padrão O indicador de velocidade das Bandas de Bollinger mostra a rapidez com que a linha média do BB e as bordas do BB mudam de direção Por padrão: A linha azul é a velocidade da linha média do BB, a linha vermelha é a velocidade da borda inferior, a verde é a velocidade da borda superior Recomenda-se usar
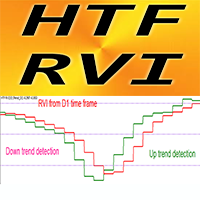
Indicador Forex Oscilador HTF RVI para MT4, sem repintura
Atualize os seus métodos de negociação com o Oscilador HTF RVI profissional para MT4. HTF significa - Prazo Maior O RVI é um dos melhores osciladores para deteção de mudanças de tendência e entrada em áreas de sobrevenda/sobrecompra Este indicador é excelente para sistemas de negociação Multi-Time Frame com entradas de Price Action das áreas OverSold/Bought. O indicador HTF RVI permite-lhe anexar o RVI de um período de tempo superior a
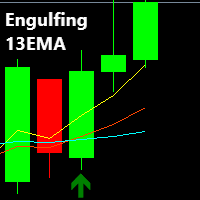
Description:
The Engulfing 13EMA is a Multi Timeframe Indicator that scans Multiple Symbols which will help you to identify potential trade set ups. As well as Forex, it can scan Crypto, Exotics, Metals, Indices, Energies or what ever else you have in your Market Watch list. You also have the option to enable/disable the time frames you want to scan. (M1,M5,M15,M30,H1,H4,D1,W1,MN1) All of these options are made possible from just ONE chart, from which the Indicator is attached
An alert is

In case you get Laguerre S crat indicator, you will get Laguerre Scrat Ea as a Gift. To get Ea and det a iled m anu al PDF contact me PM. Default settings are for usd/cad H4 For St able Long term Profits Laguerre Scrat is a trading system based on 4 indicator combinations in the shape of one indicator. Laguerre indicator (upgraded), CCI, Bollinger bands and market volatility factor. It generates arrows in the indicator window and nuts on the price chart, doubling arrows for a better view where

All about Smart Money Concepts Strategy: Market struture: internal or swing BOS, CHoCH; Orderblock; Liquity equal; Fair Value Gap with Consequent encroachment, Balanced price range; Level with Previous month, week, day level or in day level (PMH, PWH, PDH, HOD); BuySell Stops Liquidity (BSL, SSL); Liquidity Void Long Wicks; Premium and Discount; Candle pattern ... "Smart Money Concepts" ( SMC ) is a fairly new yet widely used term amongst price action traders looking to more accurately navigate

Product detailed post: https://www.mql5.com/en/blogs/post/756962
Get free demo from the link in above post.
Features: - Multi Heiken Parameters
- Alerts & Highlights for Heiken Switch
- Heiken Alignment Alerts
- Multi-timeframe Alignment Alerts
- Multi Currency
Heiken Explained: Heiken Settings: All comma separated lists will be used for different heiken ashi's. Example: 5,40,188 will mean that MAPeriod1 in 1st heiken will be 5; In 2nd heiken will be 40 and in 3rd heiken ashi will be 1
Biwavelet is an indicator for harmonic forecast of the market based on one-dimensional wavelet transform functions. Wavelet transforms are one of the main tools of digital algorithmic trading. This is due to their ability to analyze and predict processes occurring in two independent basic dimensions - price and time. Wavelets have significant advantages over the Fourier transform, because wavelet transform allows evaluating not only the frequency spectrum of the price signal, but also the time a

The indicator displays the following elements: Supply Zones, Demand Zones, Fair Value Gaps and sends alerts when a supply or demand zone is reached. The zone timeframe is set independently of the chart timeframe. For example, it is possible to set M5 zones on an H4 chart. The importance of zones can be adjusted using the zone strength parameter. Demand zones are displayed if at least one candle in the range of the zone is entirely above the zone. Similarly, supply zones are displayed if at least

Imbalance / Fair Value Gap (FVG), this is a zone / gap created when the price move with force in a given direction. It identify a zone where the price could potentially go back. This gives perfect targets for your trades.
Imbalance is created from the high and low of 3 candles. When the wicks the of 1st and 3rd candle does not fully overlap the middle one.
This indicator will help you to easily spot mitigated/unmitigated imbalances in your chart.
NEW FEATURE Update: Multi-TimeFrame Feat

after getting indic ator cont act me for Bonus E a. Non Repaint TMA channel with special conditioned arrows on price cross of channel lines plus market Volatility factor, which makes product much more accurate than any usual tma channel indicators. It is proven to be profitable with Ea built based on it which you will get as a BONUS in case of indicator purchase. Good luck.

The indicator determines the trend and its direction. At the same time, it shows
the oversold and overbought zones. Thus, it determines the most profitable
places to open a position. The indicator can be used as a filter and complement
to any strategy. It can also be used as an independent tool.
Advantages
The indicator does not redraw the values. Works on all available tools. Works on all periods. It has a minimum of settings. The ability to use it as a primary and auxiliary indicato

The Pearson Trend!! My name is Murat Yazici. I have B.Sc. Statistics and M.Sc. Quantitative Methods degrees. I have several scientific papers, conference presentations in Texas, Toronto, London, Istanbul, books and book chapters studies, and many projects about mathematical and statistical modelling. I am also journal reviewer at some scientific journals.
What is The Pearson Trend's Logic? It is based on A Fuzzy Model developed by me. Vague or fuzzy data and application several fields,

GOLDEN RETRACEMENT POWER indicator draws fibonacci levels automatically. Defines the golden entry buy/sell area, support and resistant lines , signals arrows and strength 'Power Bars Level' based on price action . Some indicators also work behind the chart: Stochastic,RSI,MFI,DeMarker and WPR . Fibonacci retracements are a popular form of technical analysis used by traders in order to predict future potential prices in the financial markets. If used correctly, Fibonacci retracements and ratios c

The indicator helps you trade following the VSA (Volume Spread Analysis) and PRICE ACTION methods, as well as study these methods from a perspective. The indicator searches for VSA and PRICE ACTION patterns considering the current trend. It is possible to view the patterns of the higher timeframe on the current timeframe chart. The custom mode allows you to find your patterns based on VSA method. Also, there is a volume histogram that automatically configures the width and visual horizontal leve

Wicks UpDown Target
Choppy movement up and down on the opening range every day. Trading breakouts on London session and New York session is recommended. Wicks UpDown Target is specialized in all forex pairs.
Guideline Entry Strategy Idea:
Step 1 - Breakout Forming (Warning! Trade on London Session and New York Session) Step 2 - Breakout Starting (Take Action on your trading plan) Step 3 - Partial Close your order & set breakeven (no-risk) Step 4 - Target complete Step 5 - Don't trade in

Scalping Binary Option Pro is an arrow indicator that is completely free from repainting . Although it may work incorrectly in strategy testers, its signals remain relevant for real trading. Signals: A red arrow pointing down indicates a selling opportunity, while a green arrow pointing up indicates a buying opportunity. Settings: All you need to adjust are the colors of the signal arrows and the sound alert for signal notifications. Usage Recommendations: It is best to use the indicator on hig

Bonosu Toon is Binary Indicator Highly Winrate No Repaint, No Delay from BONOSU SYSTEM Result look on https://t.me/BonosuProBinary Pair : All Forex Pairs Time Frame : M1 Expaired : 1-2 Minutes Trade Time Once Time a Day Backtester, Alert Avaliable Average Signals Generate 5 - 20 Signals All Pair A Day Broker Time Zone GMT+3 Default Setting [Example Broker GMT+3 : Alpari, ICMarkets] Support Broker : Deriv, IQOption, Alpari, Binomo Olymtrade, etc Support Auto Trading : MT2 Trading, Binary Bot, I
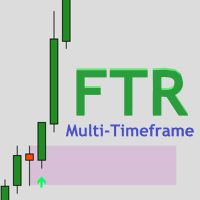
The FTR Multi-Timeframe indicator is a versatile tool that can add great value to your trading arsenal. This indicator is intended to be used to add confluence to your already existing trading strategy, such as, breakout & retest, supply and demand, patterns or continuation trading. FTR Multi-Timeframe is a continuation indicator. Rules are attached as a screenshot.
Settings for Demo/Strategy Tester: Set Server_Time_Filter to false in indicator settings ( IMPORTANT! ). Tick 'Show object desc

Welcome to Propsense, the best solution for new and veteran traders with a simple FREE strategy! This indicator is a unique and affordable trading tool built on the teachings of a former bank trader. With this tool, you will be able to see inefficient points with ease. As well as this, traders will have an interactive display panel which will show your running and closed P/L in pips AND currency units. It also allows you to set your desired daily target/loss limit! IMPORTANT INFORMATION
Maxim
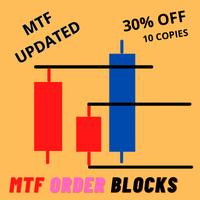
30% discounted ONLY 10 COPIES HURRY UP! 5 LEFT COPIES All Features now have in current version. Very precise patterns to detect High Accurate Order Blocks: It Draw zone after market Structure Breakout with a high Accuracy, institutional orders with the potential to change the price’s direction and keep moving towards it, have been placed. Features Auto Order Blocks Draw Market Structure BOS LINE Auto Imbalance Detect Auto Trend Detect MTF Order Blocks Double Signal One Alert Signal Second Lo

Chart Patterns Detect 15 patterns (Ascending Triangle, Descending Triangle, Rising Wedge, Falling Wedge, Bullish Flag, Bearish Flag, Bullish Rectangle, Bearish Rectangle Symmetrical triangle, Head and Shoulders, Inverted Head and Shoulders, Triple top, Triple Bottom, Double Top, Double Bottom) Use historical data to calculate the probability of each pattern to succeed (possibility to filter notification according to the chance of success) gives graphic indication about the invalidation level and

Levels Pro System рассчитывает канал движения цены, учитывая волатильность инструмента, бары и тренд, - и на основании расчетных данных показывает тренд и чертит уровни поддержки/сопротивления в очень удобном визуальном представлении. В индикатор встроена система определения критических точек (критических баров), которая позволяет трейдеру значительно проще выявлять истинный пробой уровня, ложный пробой, отскок от уровня, возможный сигнал на ранней стадии движения цены итд. Таким образом, торгов

O Indicador de Venda PTS Divergence Finder por Roger Medcalf - Precision Trading Systems. Este indicador fornece apenas Indicações de Venda - Baixa. Em primeiro lugar, muitas vezes me perguntaram por que não forneci um indicador de divergência de venda enquanto felizmente fornecia um localizador de divergência de sinal de compra por muitos anos. Eu dei a resposta de que as divergências de venda são menos confiáveis do que as divergências de compra, o que ainda é verdade. Algumas soluções foram e
O Mercado MetaTrader contém robôs de negociação e indicadores técnicos para traders, disponíveis diretamente no terminal.
O sistema de pagamento MQL5.community está disponível para todos os usuários registrados do site do MQL5.com para transações em todos os Serviços MetaTrader. Você pode depositar e sacar dinheiro usando WebMoney, PayPal ou um cartão de banco.
Você está perdendo oportunidades de negociação:
- Aplicativos de negociação gratuitos
- 8 000+ sinais para cópia
- Notícias econômicas para análise dos mercados financeiros
Registro
Login
Se você não tem uma conta, por favor registre-se
Para login e uso do site MQL5.com, você deve ativar o uso de cookies.
Ative esta opção no seu navegador, caso contrário você não poderá fazer login.