ZigZags, waves, trends. - page 6
You are missing trading opportunities:
- Free trading apps
- Over 8,000 signals for copying
- Economic news for exploring financial markets
Registration
Log in
You agree to website policy and terms of use
If you do not have an account, please register
Tail wagging the dog. :)
If you create a topic, be kind enough to make a point in a short period of time. Otherwise, everything turns into another bullshit, which is already at the level of this forum, where they pay for posts.
You have already got the sixth page, and it's not clear what you wanted to say.
The price affects the readings of absolutely all indicators. Please don't write that you have a different opinion, it would be over the top.))
I spent half a day in the national library today, gaining knowledge... now I feel like a serious and smart guy... don't spoil the mood))
Don't try to get me out of patience.))) Hardened mentally and physically.
You have nothing to say on the subject. Step aside, grandson.)) Don't litter, please.
There are people here who criticize topics without higher education, but only a few can say something clever.
Sharing the tidbits of the pie.
End of the week.
End of the week.
All right, that's it. I'm done, I'm gonna go get a beer.
+30% for the week: the zigzags do rule.
All right, that's it. I'm done. I'm gonna go get a beer.
+30% for the week: the zigzags do rule.
I'm with you.
End of the week.
Hello Vladimir!!! I remember an anecdote when a warrant officer says to the recruits: "Today I will teach you how to zigzag. And the young, clever boy corrects him: "Notzigzag, Ensign, but zigzag." And the warrant officer replies: "You'll crawl when I say so!"
The price must be told to "zigzag" too.
If I see a wave, I can assume that there must be a channel in the wave.
Here is the picture. The main channel is blue There may be a corrective channel appearing from the shallower TF red.
Probability of a wave reversal.
The statistics of the old zigzags will show the approximate end points of the new zigzag knee... in the middle of the cluster, it's most likely the end of the zigzag
Here you can see the old elbows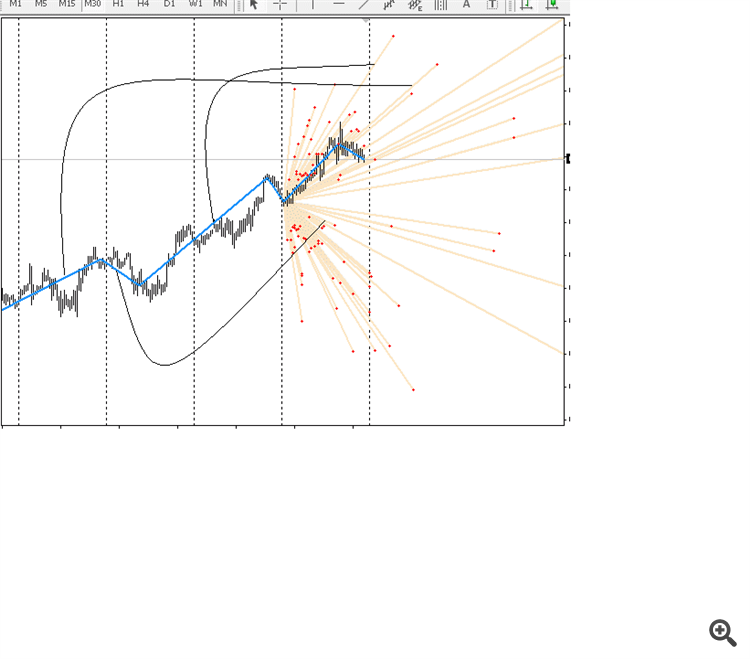
Putting z's on the minute chart
EURUSD 5 digits on the minutes (input parameters: 12-5-3):