From theory to practice - page 1283
You are missing trading opportunities:
- Free trading apps
- Over 8,000 signals for copying
- Economic news for exploring financial markets
Registration
Log in
You agree to website policy and terms of use
If you do not have an account, please register
By the way, did you check out Ilya from the MoD thread about the Bayesian directional classifier?
I'll have a look.
Cool, what can I say - exactly what this thread has been looking for for 1000 pages.
I'll have a look.
My concept is that the market is a set of potential pits just defined by periods of the market's time structure, and the price transitions between them at the expense of some additional energy. This energy should certainly be calculated, whether by Hearst or some other tool, it makes no difference. But this parameter should be in the TS, full stop.
And having such a concept, you define in tabular form the values of energy, sufficient for such a transition (trend) or not (a flop will continue).
So, take a piece of the chart from one transition from level to level and to another transition from level to level. and calculate on this chart your Hirst. and then look in what direction the impulse will be at the end of this chart. and such experiments, like 100 pieces. then it will be clear whether this case has some dependence or not.
Actually, the market used to have this chart structure
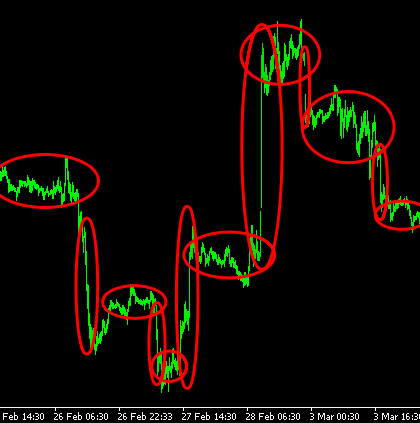
It was called accumulation and distribution.
It's not a potential energy, but it may be an indicator of the strength of the market.
And it's not about potential energy.
If price accidentally touches them, an impulse occurs towards triggering of such stops.
I'll have a look.
Cool, what can I say - exactly what this thread has been looking for for 1,000 pages.
What's so great about it?
I made such an indicator in the forecasts back in 2013 in September, without any neoronoks.
It took me a whole day to find it this week, but I couldn't find it - the posts got cut.
that turkey's formula was like this:
1st line: probability=(maximum-minimum)/current increment //all this is relative to a fixed start date
Line 2: 1-probability.
on one line we trade sales, on the other we buy and that's it
respectively have a probability of selling and a probability of buyingWhat's so great about it?
I used to use such an indicator in the forecasts, back in 2013 in September, without any neuralinks.
But I killed a whole day during the week and couldn't find it - the posts got cut.
that turkey's formula was like this:
1st line: probability=(maximum-minimum)/current increment //all this is relative to a fixed date
2nd line: 1 probability.
on one line we trade sales, on the other we buy and that's it
respectively have a probability of selling and a probability of buyingDon't delete this post - I'll analyse it later.
Don't delete this post - I will analyse it later.
Sash, tell me, what difference does it make - what market do you want to enter with such formulas - stock exchange or non-stock exchange?
And this one is the simplest. But it was enough for me to go to Sochi at the time...
By the way, swap the numerator and denominatorYes, there is a problem. I remembered such a thing, there was a rattle.
I'm sorry, I didn't take that into account.
Apparently FormulaE is primary.
And yet - by how many bars the indicator that is not in white rectangles is lagging. To process one lagging indicator with another one is beyond the realm of perversion...It's different, ideally it's usually 2-5 bars ahead(H1).
I know that, too. Even taking a reference point so that the left end doesn't move doesn't help.
Don't delete this post - I'll analyse it later.
You can really do without Bayes there, but with Bayes you have a ready-made package, and you don't have to bother with it.
And since the exchange is clearing, the ironclad point/time/date of the start of settlement is the time of the end of clearing.
The whole difference.