Trading by energy levels - page 14
You are missing trading opportunities:
- Free trading apps
- Over 8,000 signals for copying
- Economic news for exploring financial markets
Registration
Log in
You agree to website policy and terms of use
If you do not have an account, please register
as on the other terminal the same crap came out with the rare earth signal.
Turns out this signal can work as well (EURCHF pair, I was looking for it specially) ))) I have one on the Pound at the moment ))) I do not know what to think ))).
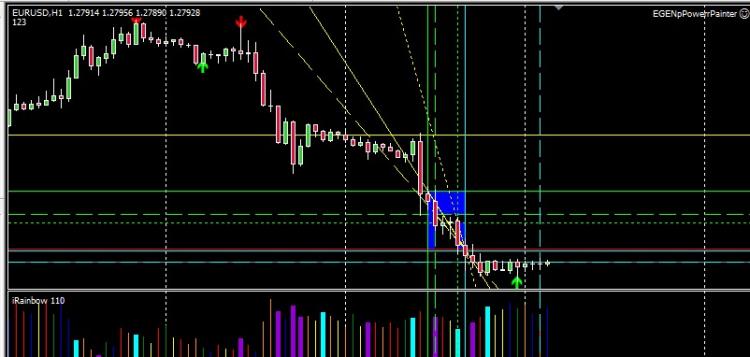
I made a crumpled script which draws horizontal levels by candle's close with POWER = 50 - red lines, POWER = 100 - green, POWER = 161 - must be yellow.
Restriction: only the first 10 levels found are drawn, sample = 1500 bars.
You may see what we have in the picture
The script is in the trailer
Sketched out a script at the knees
I think it is possible to work on the rebound from these levels.
This is my opinion.
Let's experiment and see. And time (or price) will show if we are right or not :)
So far we can see that the price sees these levels, which is good :)
Interesting expert.
The script recalculates the bars without stopping (finishes counting, gives the result and starts again) .... is it supposed to be like that ?
I made a crumpled script which draws horizontal levels by candle's close with POWER = 50 - red lines, POWER = 100 - green, POWER = 161 - must be yellow.
Restriction: only the first 10 levels found are drawn, sample = 1500 bars.
What we have got here is shown in the picture
the script is in the trailer
and if so
//+------------------------------------------------------------------+
//| ExportLevels2.mq4 |https://www.mql5.com/ru/articles/1440
//| Copyright © 2006, MetaQuotes Software Corp. |https://www.mql5.com/ru/articles/1439
//| http://www.metaquotes.net |
//+------------------------------------------------------------------+
/*
Let's describe the algorithm of support and resistance levels searching, in order to implement it in the FindLevels indicator. Support and resistance level
is the price value, the crossing of which is prevented by some forces. These may be forces due to psychological markers, the influence of some large
or a large amount of stop-losses near this level. It is quite understandable that the quotes will cross this line much less frequently than
it is clear that quotes will cross this line much less frequently than all the other lines, which are not support levels. The confirmation of this fact can be found in a lot of literature.
To make use of this fact, we need to calculate the number of bars crossing this price for each price. You may see the graph of results
from the previous article https://www.mql5.com/ru/articles/1439:
First, let's define some constant MaxR - radius of the neighborhood. If the local minimum is not a minimum in the neighborhood with radius MaxR,
then this local minimum does not fit. Second, set the MaxCrossesLevel parameter. If in the neighborhood of the maxR radius the maximum of the function
differs from the minimum by less than the MaxCrossesLevel, then we do not display this local minimum, because it is not sufficiently
it is not sufficiently distinct.
This is the whole search algorithm.
>>
interesting topic. any statistics yet?
The idea works Article, and if you "light up" the rainbow, you can see the spreads better too: