how to teach the TS to distinguish between FLET and TREND??? - page 15
You are missing trading opportunities:
- Free trading apps
- Over 8,000 signals for copying
- Economic news for exploring financial markets
Registration
Log in
You agree to website policy and terms of use
If you do not have an account, please register
Debugger
Don't you need anything attached to it? I put it in /indicators/ - put it in, nothing on the screen.
Debugger
Don't you need anything attached to it? I put it in /indicators/ - I put it in, nothing on the screen.
the indicator itself doesn't know what it is. It is on the fence.
If it's not a commercial product, you should at least lay it out, and then comb as many times as you need. I'm trying to explain Alexey, he has tact, while for us, countrymen it's easier. What he thought, and then he blurted out. :))
The reader is supposed to know the construction of a common Stochastic. It would be useful to read the article of M. Korolyuk (Moisha) "Turtle - it sounds proud".
So, asymmetric stochastic. Actually there are only three differences from the standard one:
Kperiodnow consists of two - low-order KperiodShort (short) and high-order KperiodLong (long).We also added the parameter of oversold level (SP) OverSold, by which the overbought level is calculated (PC). Stochastic entering the zones of PC/PP switches Kperiods - search lengths of highs/minimums. The third difference is the sensitivity threshold - the Sens parameter.
Logicof operation:
If the stochastic has entered the PP zone, the search for minima is performed for the lower Kperiod (KperiodShort) of bars, and for maxima - for the upper one (KperiodLong). When entering the PP zone - mirrored - the lows are searched on the longer bar, the highs are searched on the shorter bar.
Interpretation/use (free and optional)). A stochastic move into the PC/PP zone means a trend switch in the corresponding direction. But! A trend switch does NOT mean opening a position in its direction in general. The entry occurs during a correction, which can be identified by crossing/tapping the 50% line. If you roughly follow the "Turtle" - the position builds up during corrections. When the trend shifts, either the position is closed completely, or it is shortened. In the latter case, the complete closing is performed during the correction and the opposite one is opened at the same time. Stops are set at the previous (opposite) extremum. But it is unlikely that they will work in the working mode.
But it is only from the spit. I am not imposing my tactics.
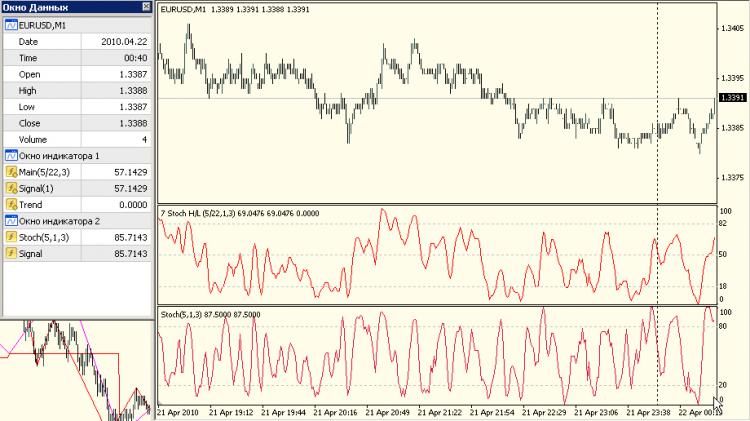
In first subwindow - asymmetric stochastic, in second - normal.
Call from codes, input parameters and buffer assignments:
индикатор сам не понял, что счас. Он на заборе.
Other fields of parameters are described in the base:
===
For your reference %K is displayed instead of the trend by the "Trend" buffer - you can observe the logic of period increasing. You can also return the trend itself to the buffer (it is disabled).
===
Yes. The code contains fragments and unnecessary parts, but since I was asked to output them, don't mind. Otherwise everything works as it should.
In my opinion, the very emergence of the terms "flat" and "trend" is a purely psychological phenomenon, because the mind needs poetic imagery to explain the market.
For me, distinguishing the first from the second is like distinguishing green from hot.
Looking at the charts, it is somehow obvious to me only that the market is a set of fluctuations. And the oscillations with different amplitude. And from these fluctuations (maybe even according to the fractal principle) the so-called channels are formed. It means that a trend and a flat can be different. The price can fall fast - an apple has fallen on somebody's head, or it can follow the same way as an autumn leaf - gently oscillating in a beautiful wave. It's the same with flat - there are dull fluttering strings and there is a steady surf wave on the horizontal of the pier. Therefore, the question how to distinguish the flat from the trend should be reworded into the question - how to distinguish the strong amplitude from the weak one. The answer has already been heard here, but it hasn't received due attention - volatility. In other words do not see the oscillatory movement - increase the timeframe. -) If you see a flat - use a magnifying glass. It means that what looks like noise in one timeframe may well be a fluctuation in a smaller one.
But the oscillatory movement itself consists of two trend and reversal phases. Thus the antonym of the term "trend" should be the term "reversal".
As a result, TS should contain:
1. Trend following (I use the H.-Ashi candlestick).
2. Accounting for the reversal (I use stochastic)
3. Accounting for the amplitude of fluctuations (I use StDeviation), which simply changes the timeframe of operation depending on market activity.
(My TS also includes consideration of external factors - SnP500, which starts the movement in one or another direction, and simultaneously monitors the surges, it's when the sharp movement - we follow it unconditionally, but this is another story).
So I propose to discuss - which indicators better track the forward movement, and which reversal. For example - when there is a reversal, volatility usually drops - but what about the volumes?
prononsens:
What about volume?
Volume has a very strong correlation with ATR. Of course, there are signal divergences such as "squatting" bars of Williams, but in general it doesn't matter. It can be either tick or lot (money).
Otherwise, you can also have a look here. Here's an extract:
//
Here - look: the well-known notion that swings towards the trend are accompanied by an increase in volume or, as in the figure below, the true range, is clearly confirmed by the proposed indicators. In the first sub-window, the thick red line is the ATR modulated stochastic (~SrochAM) and the thin blue line is the regular one. One can clearly see how the non-trend fluctuations of the stochastic are filtered. In the lower sub-window, for reference, the modulating signal (~norm) is the normalised ATR(5).
===In general, all these attempts to adapt on temporal framing are similar to the futility of pulling a frace pair on an octopus. But at least the proposed approach is closer to the essence of market movements than the chaotic crossing of known and unknown indicators, followed by the finishing of mutants in the optimizer and ending their suffering with a control shot at the deposit.
//
Volume has a very strong correlation with ATR. Of course, there are signal divergences such as "squatting" Williams bars, but in general it does not matter. Even if it is a tick or a lot (money).