how to teach the TS to distinguish between FLET and TREND??? - page 16
You are missing trading opportunities:
- Free trading apps
- Over 8,000 signals for copying
- Economic news for exploring financial markets
Registration
Log in
You agree to website policy and terms of use
If you do not have an account, please register
I.e. modulating the stochastic by ATR is just, in my opinion, pointless, because it is an attempt to measure the temperature by velocity. By the way, if you look carefully at the chart, you will notice that there are more false signals on such indicator than on the standard one. -) Similar should be modulated by similar. Say, volatility by volatility and stochastics by a channel break, or something like that.
You have not read it carefully. The stochastic is not used here for "sell" signals in the PC zone (>80%) or "buy" signals (<20), but for identifying (using volatility modulation) trend impulses. This is, by the way, a branch about trend and flat, in case you forgot.
But in general - that's funny))). Are you familiar with such a notion as "orthogonality"?
===
What about the use of volumes together with TR, for example, because of the "kitchen" nature of the tick volumes and their filtration by DC, this pairing will only reduce the reliability. But such indicators work on the spot market. For example you can look at Williams (Larry) with Chand.
I am talking about the trend and the flat. I am not studying orthogonality - if I need it, I will do it.
I am not going to study orthogonality - if I need it, I will.
The picture from the current trades - we started with low volatility, now the market has accelerated - stochastic keeps pausing.
sorry, already there-)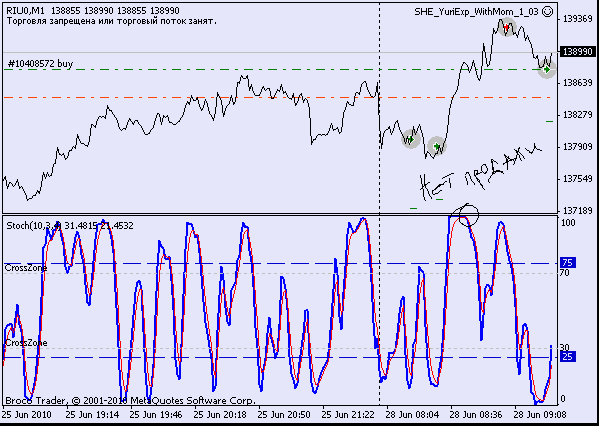
Trend impulses are defined in order to be able to understand:
a) What is the direction of the trend and is it even present.
b) Where is an impulse and where is a correction. As far as entry points are concerned, the entry on a trend identified by momentum is precisely on a correction.
===
Excuse me, but it doesn't take a pedagogical talent to "teach TS to distinguish a trend from a flat", but it does take a talent to explain it to a person who is far away from the topic. But I, unfortunately, do not possess this talent (as well as patience). I don't have any "explanations" other than the ones mentioned above. Such is the case...))
This is all just an explanation, just like the fractal variants. You will never be able to teach TS to identify the trend and correction to it, because you will not be able to formalize the concept of trend and flat to the possibility of giving a signal, because you never know if it is a correction or the beginning of a new trend.
And if you define a trend as an essential price change, there is always a trend, just when the changes are insignificant, it is easier to teach TS not to do anything.)
This is all just an explanation, just like the fractal variants. You will never be able to teach TS to identify the trend and correction to it, because you will never be able to formalize the concept of trend and flat to the possibility of giving a signal, because you never know if it is a correction or the beginning of a new trend.
??? ))) So much for Newton's Binom. ))) If you don't know it... well, then there's a lot to learn.
You can always tell by purely formal signs where there is an impulse and where there is a correction. What's so mysterious about it?
Everything is formalized a hundred times, there are trend indicators, there are a lot of them. Do you think they use an unformalized algorithm? Buggahaha!!!)) Oxymoron, however!
Formalized trend definitions are a wagon and a small cartload. The choice of definition depends on your trading tactics.
Okay, that was fun. I think I'll take my leave. Otherwise mysanthropy may start again...)))
Trend indicators formalise signs of a trend, not the trend itself. At the same time, I don't know any indicators that formalise a correction. Enlighten me, you are our emotional one. -)