You are missing trading opportunities:
- Free trading apps
- Over 8,000 signals for copying
- Economic news for exploring financial markets
Registration
Log in
You agree to website policy and terms of use
If you do not have an account, please register
US stock indices ESM0 & NQM0
The seasonal trend graphs (see figure below) suggest a price collapse starting tomorrow.
Although this year the current price (dark line) is not really following the seasonal price lines.
But an emerging reversal candlestick pattern is quite likely on the daily chart.
We will see tomorrow.
CTK0
Информация к размышлению.
Фондовые индексы США ESM0 & NQM0
doesn't really fit:
не очень подходит:
So, I'm short-term, on tf=m15 I'm supposed to enter (not n4)! So to say, "gentleman, looking for a ten..."(c)

//-----------------
And what are your thoughts about this duo ?
cocoa ice+euronext
On coffee too, there are trends in the long term...
Only 2-3 times on expiry positions were closed with losses.
And now on ZN+ZB I am in a drawdown. On March 17 I have moved up.
So far losses are tolerable.
Against the seasonal trend for a week, there is a spread.
And ZN (ten-years) is going flat.
I.e., the spread should turn up any minute now!
ZBM0:
Seasonal trend of 30-year ZBM0 bonds: - will not go down today or tomorrow.
And ZN (ten-years) is going flat.
I.e. the spread should turn up soon!
ZBM0:
I have been trying to break it since the 12th, but the daily candlestick closed lower.Да я просто предупреждаю, чтобы против тренда не попасть.///
Very well worked out the entrance!

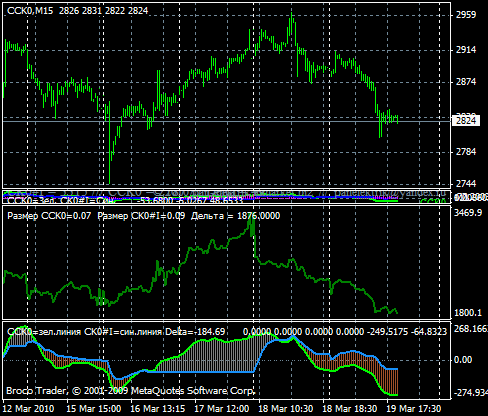
And now I flipped: SELL NQ + BUY ES (0.09 ^0.06)
Please advise. Suddenly the EA stops working.
BUT IN THE LOG. :
2010.03.25 21:01:54 Old tick 6CM0#I30 0.98110/0.98120
What does it mean?