Machine learning in trading: theory, models, practice and algo-trading - page 3537
You are missing trading opportunities:
- Free trading apps
- Over 8,000 signals for copying
- Economic news for exploring financial markets
Registration
Log in
You agree to website policy and terms of use
If you do not have an account, please register
That's an interesting idea for the application of NS
In general, this phenomenon is purely mathematical, not related to the data, but related to its processing, namely the calculation of the percentage.
In essence, it turns out that when we see such a figure, we can talk about the representation of all variants of combinations of the presented groups.
In fact, it is a kind of random.
And what informative value does it have? )
And what kind of informative value does it have? )
Asymmetry to one side will indicate a tendency towards more or fewer representatives of groups. Here I would like to have more group representatives, so I need more dots on the left side. Any other ideas for visualising this process?
Asymmetry to one side will indicate a tendency towards representation of more or less representatives of groups. Here I want to have more group representatives, so more dots on the left side. Any other ideas for visualising this process?
Nah, I just still don't understand anything because I don't see the whole picture. Just wondering :)
on the left side.
Wrong side - right side, of course.
Nah, I just still don't understand anything because I don't see the whole picture. Just wondering :)
It doesn't really matter what the meaning is :) It's just that there are percentages of the total number for different groups, i.e. each group has its own number of representatives - it can be repeated. And it's not quite clear to see a trend visually.
Got some crazy results with the new approach, with akurasi under one and logloss under 0.1 per train/test.
Although the previous one works quite well.
The tester is not ready for this method yet, I will rewrite it later in the week and show it.
It is on flat pairs. There are still questions on trend pairs.
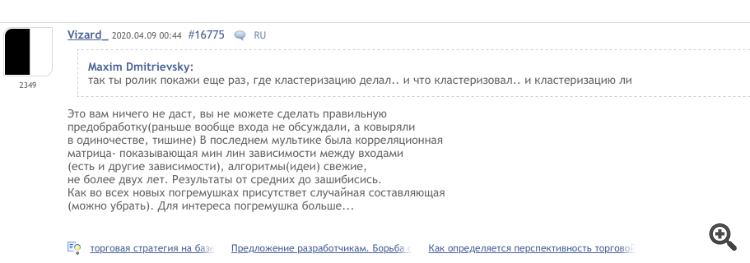
And Wizard knew something.
#16775

And he used to delete everything afterwards scotty, so there's not nearly enough informative posts left.