Harmonic Analysis - page 277
You are missing trading opportunities:
- Free trading apps
- Over 8,000 signals for copying
- Economic news for exploring financial markets
Registration
Log in
You agree to website policy and terms of use
If you do not have an account, please register
Plenty of places to look for, but in the end for each of us individually will work what we learn to use, master it and gain with it...
Harmonic Pattern Analyzer, part of the toolkit | neoHarmonics.com neoHarmonics.com
On this page there is a cypher defininition as well.
Also described a step-by-step pattern search method...would it help anyone?
NZDUSD H1 entering into a strong area to look for the bulls.
Chart NZDUSD, H1, 2014.04.21 18:21 UTC, HF Markets Ltd, MetaTrader 4, Demo - MetaTrader Trading Platform Screenshots
What do you think?
How do you look at it?
Whu do you think it's a strong area?
3 drives (incl ABCD which itself is bread and butter), 5p harmonics, wolfe wave all meet within a daily demand area while price is approaching several expressed H1 demand zones inside the D1 zone and all this still with valid D1 and W1 trendlines to the upside.
This is in my interpretation as I looked so far tells me to consider it a strong case.
As for the area I tried to tell you, when I see e.g. LTF demand zone nested within HTF demand zone, I do consider it strong.
I guess would be similar with the D/W/M fibopiv levels you used to watch.
UsdCad M15 this little bear dragon might have some chances
Chart USDCAD, M15, 2014.04.21 21:32 UTC, HF Markets Ltd, MetaTrader 4, Demo - MetaTrader Trading Platform Screenshots
But it is a bit still quiet today, so small dragons are questionable in a sleeping market.
EurGbp-some chances where it might have a bull swing on D1
Chart EURGBP, D1, 2014.04.21 22:57 UTC, HF Markets Ltd, MetaTrader 4, Demo - MetaTrader Trading Platform Screenshots
Most of the times I am having problem with this zig-zagged impulse leg (X-A), I call it broken..however this one is relatively nice.
Most of the times I find, the best to wait until its full length (i.e. as indi picked the XA of the left blue triangle).
Any experience with it?
NZDUSD H1 entering into a strong area to look for the bulls.
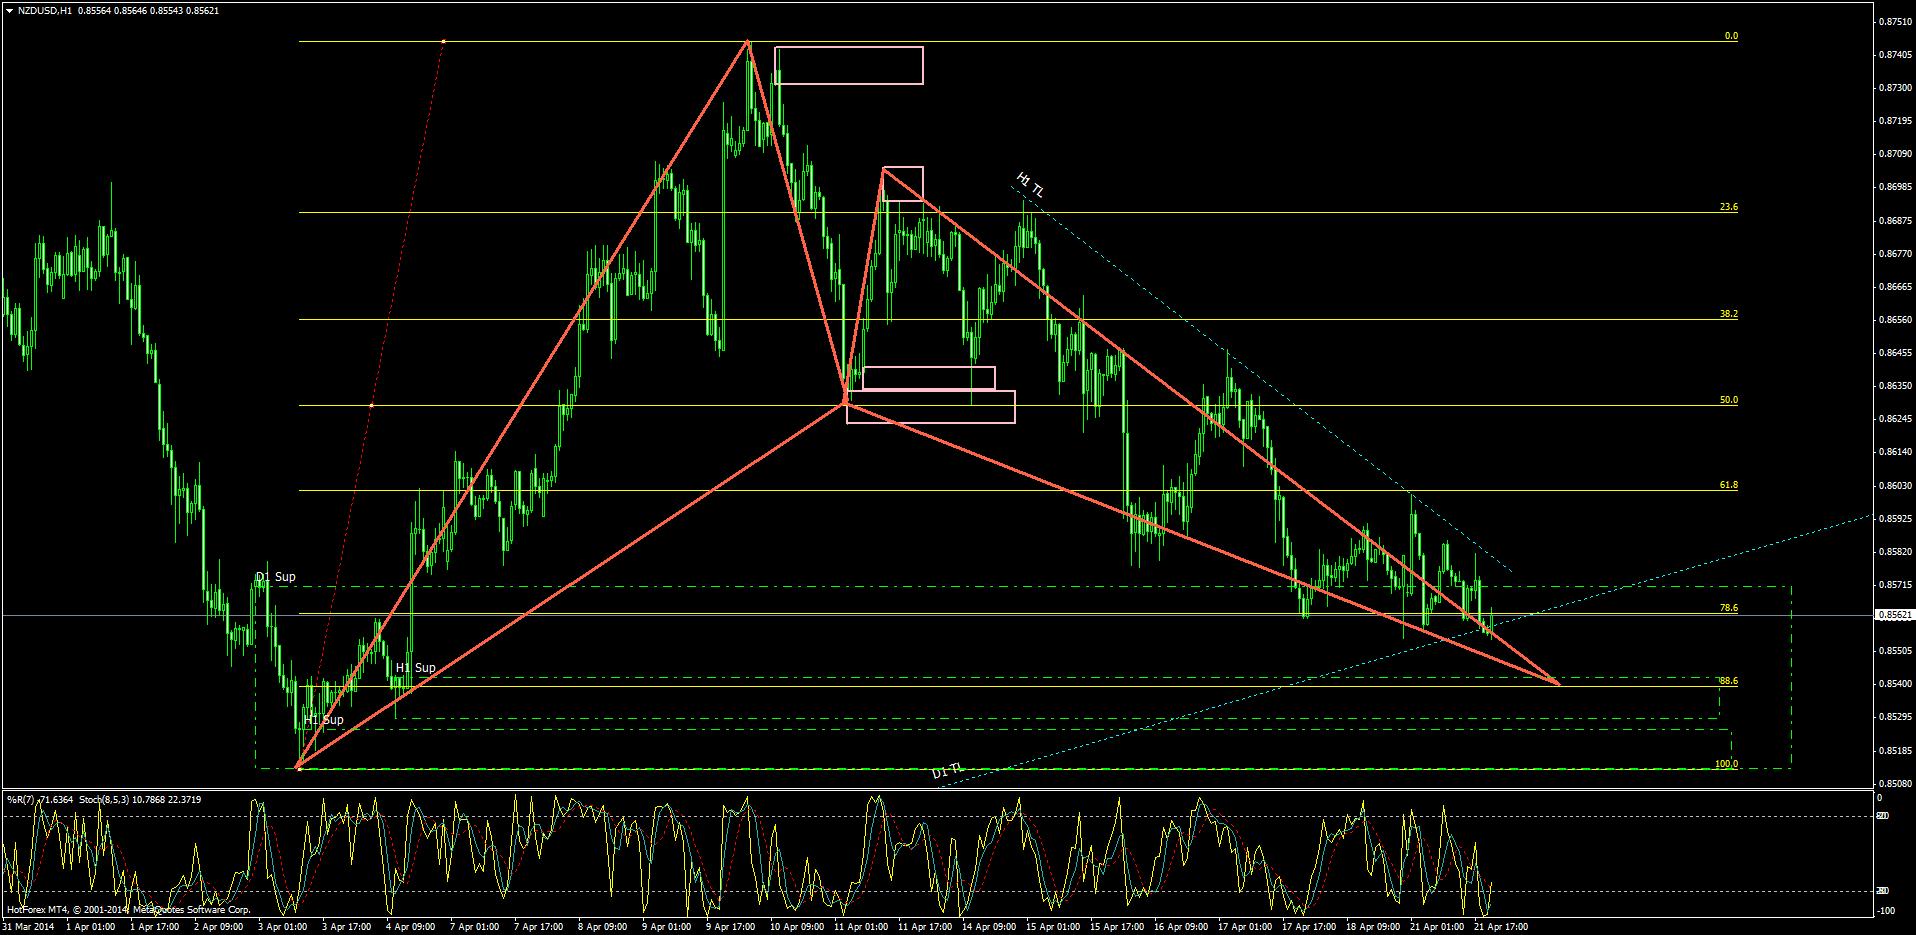
Chart NZDUSD, H1, 2014.04.21 18:21 UTC, HF Markets Ltd, MetaTrader 4, Demo - MetaTrader Trading Platform ScreenshotsWhy do you think it's a strong area?
3 drives (incl ABCD which itself is bread and butter), 5p harmonics, wolfe wave all meet within a daily demand area while price is approaching several expressed H1 demand zones inside the D1 zone and all this still with valid D1 and W1 trendlines to the upside.
This is in my interpretation as I looked so far tells me to consider it a strong case.
As for the area I tried to tell you, when I see e.g. LTF demand zone nested within HTF demand zone, I do consider it strong.
I guess would be similar with the D/W/M fibopiv levels you used to watch.Has your definition of strong area been proved by yourself by trading? Has it been proved that it's stronger than just one harmonic pattern?
This is my opinion, often LTF supply and demand zones meet within HTF supply and demand zones and I don't it doesn't mean it's stronger when LTF and HTF supply and demand zones are met. HTF supply and demand zones are larger, within HTF zone, there may be more than 3 supply and demand zones.
EurGbp-some chances where it might have a bull swing on D1
Chart EURGBP, D1, 2014.04.21 22:57 UTC, HF Markets Ltd, MetaTrader 4, Demo - MetaTrader Trading Platform Screenshots
Most of the times I am having problem with this zig-zagged impulse leg (X-A), I call it broken..however this one is relatively nice.
Most of the times I find, the best to wait until its full length (i.e. as indi picked the XA of the left blue triangle).
Any experience with it?How could you know if it's relatively nice even though you have a problem most of the time?
You should read the structure. The blue pattern will "repaint" if price keeps falling.
EurGbp-some chances where it might have a bull swing on D1
Chart EURGBP, D1, 2014.04.21 22:57 UTC, HF Markets Ltd, MetaTrader 4, Demo - MetaTrader Trading Platform Screenshots
Most of the times I am having problem with this zig-zagged impulse leg (X-A), I call it broken..however this one is relatively nice.
Most of the times I find, the best to wait until its full length (i.e. as indi picked the XA of the left blue triangle).
Any experience with it?-------------------------this is not Garth