Harmonic Analysis - page 271
You are missing trading opportunities:
- Free trading apps
- Over 8,000 signals for copying
- Economic news for exploring financial markets
Registration
Log in
You agree to website policy and terms of use
If you do not have an account, please register
Proverb:
man proposes god disposes
---------------
I see you are having a nice inverted head an shoulder in a down trend - ie. the momentum down seems to decrease.
I see on HTF:
Chart EURAUD, D1, 2014.04.14 00:21 UTC, HF Markets Ltd, MetaTrader 4, Demo - MetaTrader Trading Platform Screenshots
also in a DOWN TREND!!
and also finally this one in a DOWN:
Chart EURAUD, H1, 2014.04.14 00:35 UTC, HF Markets Ltd, MetaTrader 4, Demo - MetaTrader Trading Platform Screenshots
Your drawing matches the trend so should be better than mine, why do you think it will come there? The pic looks OK though, check the fib ratios, if it comes there act according to your plan.
I am expecting it to go higher now and then continue down.
You have to measure weather you have a cypher D=78.6XC or a shark D=88.6-113XC there, that is all you can do.
How to measure it or what the relationships are in the cypher and shark, I have just posted a few posts ago when answering Paulselvan EurUsd cypher question. Check it there.
An example of some small levels, and why I start using these more and more:
Chart NZDUSD, M30, 2014.04.14 09:22 UTC, HF Markets Ltd, MetaTrader 4, Demo - MetaTrader Trading Platform Screenshots
Also levels and potenial ABCD / 3 drives
Chart AUDNZD, H1, 2014.04.14 09:44 UTC, HF Markets Ltd, MetaTrader 4, Demo - MetaTrader Trading Platform Screenshots
EURUSD 4H - Potential bearish cypher.
The cypher worked out nicely. Time for me to see if it's going to keep going down or bounce more.
Ryu your zone is too wide for my taste/risk appetite..how did you come to that? ...or not really, sorry probably mine is 10 pips lower, I thought was more significant, however when losing it, it is significant, anyway looked bigger.
What you said is very contradicting. Why did you say "...or not really"? If you think it's too wide, say it's too wide and not your taste. BE CONFIDENT.
Take a look at a pic below.
What you said is very contradicting. Why did you say "...or not really"? If you think it's too wide, say it's too wide and not your taste. BE CONFIDENT. Take a look at a pic below.
Well .
.
Yor zone seems to be above what I had by 10 pips
Chart USDCHF, H1, 2014.04.14 17:41 UTC, HF Markets Ltd, MetaTrader 4, Demo - MetaTrader Trading Platform Screenshots
I gestimate your zone at the purple dotted line.
Well
Yor zone seems to be above what I had by 10 pips
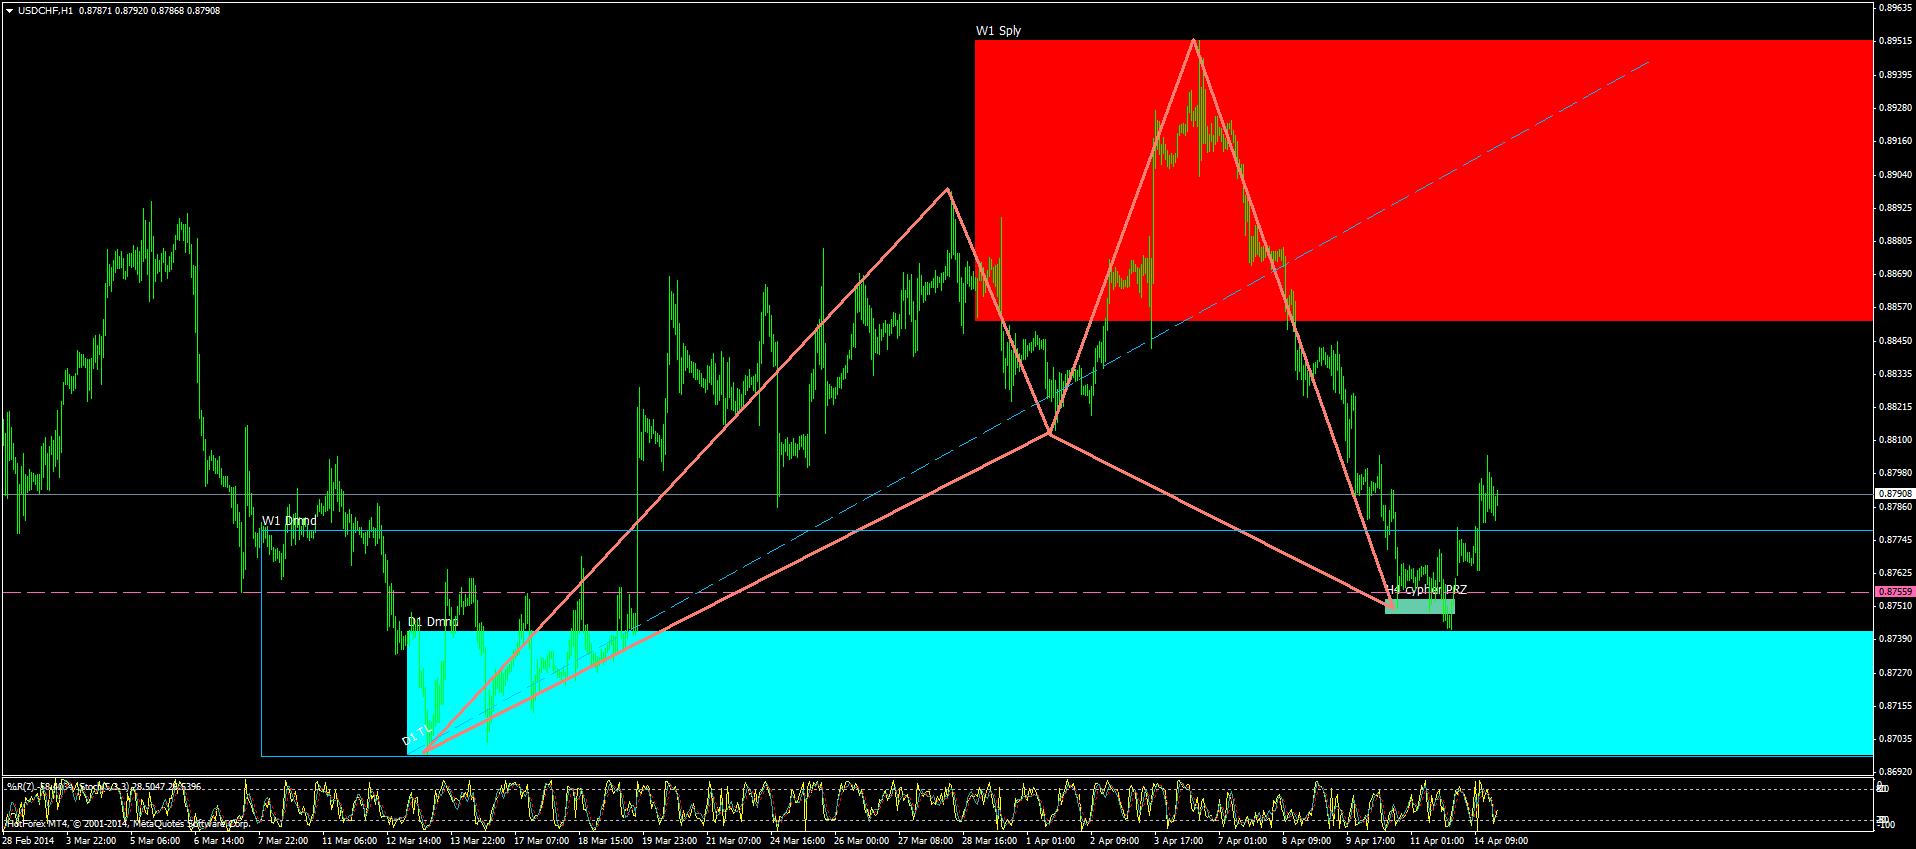
Chart USDCHF, H1, 2014.04.14 17:41 UTC, HF Markets Ltd, MetaTrader 4, Demo - MetaTrader Trading Platform ScreenshotsLook at a pic below and now you know.
Well
Yor zone seems to be above what I had by 10 pips
Chart USDCHF, H1, 2014.04.14 17:41 UTC, HF Markets Ltd, MetaTrader 4, Demo - MetaTrader Trading Platform Screenshots
I gestimate your zone at the purple dotted line.Your PRZ is super tight. Price broke it and then bounced. I assume you didn't tade that.
This is something interesting for me to keep an eye on.
Look at a pic below and now you know.
Exactly 14 pips - spread. Tnx.
Did not trade however in my theory it was a super case:
Daily demand within the weekly demand area, withing some 10-20 pips for the PRZ to the daily zone top... if you look left on H4 there was the last small wave where the XA shot up. So really it ws a super strong one.
Why I did not draw that zone was not a zone one would consider as I understand the rules for that, but I might be dead wrong...that one contained the prz in it, so there was a lot of safety to take this...but well I did not.