Harmonic Analysis - page 282
You are missing trading opportunities:
- Free trading apps
- Over 8,000 signals for copying
- Economic news for exploring financial markets
Registration
Log in
You agree to website policy and terms of use
If you do not have an account, please register
CADJPY 240m very clear PA to observe Gartley forming.
my entry will be around fib level, but between 78.6 to 88.6, because of structure
CADJPY 240m very clear Gartley to observe Bat forming.
my entry will be around fib level, but between 78.6 to 88.6, because of structure
The options I see without paralysis:
Chart CADJPY, H4, 2014.04.25 21:49 UTC, HF Markets Ltd, MetaTrader 4, Demo - MetaTrader Trading Platform Screenshots
Does timing play any role? There are some time sensitive patterns I read... ABCDs are one of those, I dunno what else there is out there.
Anybody has a list and relations or proportions of those candle count or time-wise?
Do not miss the tiny moth in yellowish-green on the current drawing at the end of the market time of this week, this moth might get some prizes if we are lucky, and grow into a famous butterfly, astronout or something, in our files of income, who knows?
Time will play role if you want it to play role,
it's your decision to keep stuff in the equation or out of it.
for me if price will touch the purple line, It would negate the trade. I'll reconsider to but limit down there again if I'll see price rejection and doesn't closing above X pivot.Yes, that is a good point, to keep the focus of validity and rejection levels, I miss it often!
Still there are patterns according to literature, which might be not rejected by price levels but might be by simmetry, I am curious if there is a list or table out there. Anybody knows, or could we work on it?
Harmonic indicator developers definitely are trying to build such relationship into the PRZ or pattern harmony definition.
Irad, just a comment from my observations of the market, I see why you have your trailing SL level where you have it, but I see the market testing the "B" level of your pattern or that of any pattern, and either respecting it, or breaking it, that is why I do consider the whole B level as a natural, very strong zone. Please comment if you have anything backing my observation up, or negating it!
Also point out if I misinterpreted anything in UR message, now there might be more purple lines and X-s...sorry for that confusion!
Thanks.
CADJPY 240m very clear PA to observe Gartley forming. my entry will be around fib level, but between 78.6 to 88.6, because of structure
Are you back to harmonics irad? You've been around in the thread more often than before. I'm glad about it.
Are you back to harmonics irad? You've been around in the thread more often than before. I'm glad about it.
Back for now,
There is still much more stuff that we can learn from each other, it'll be a shame to leave,
It's amazing the progress this thread has been doing since almost last year,
not much into Bitcoin trading, but still be nice to see harmonics working over this market
240m bat pattern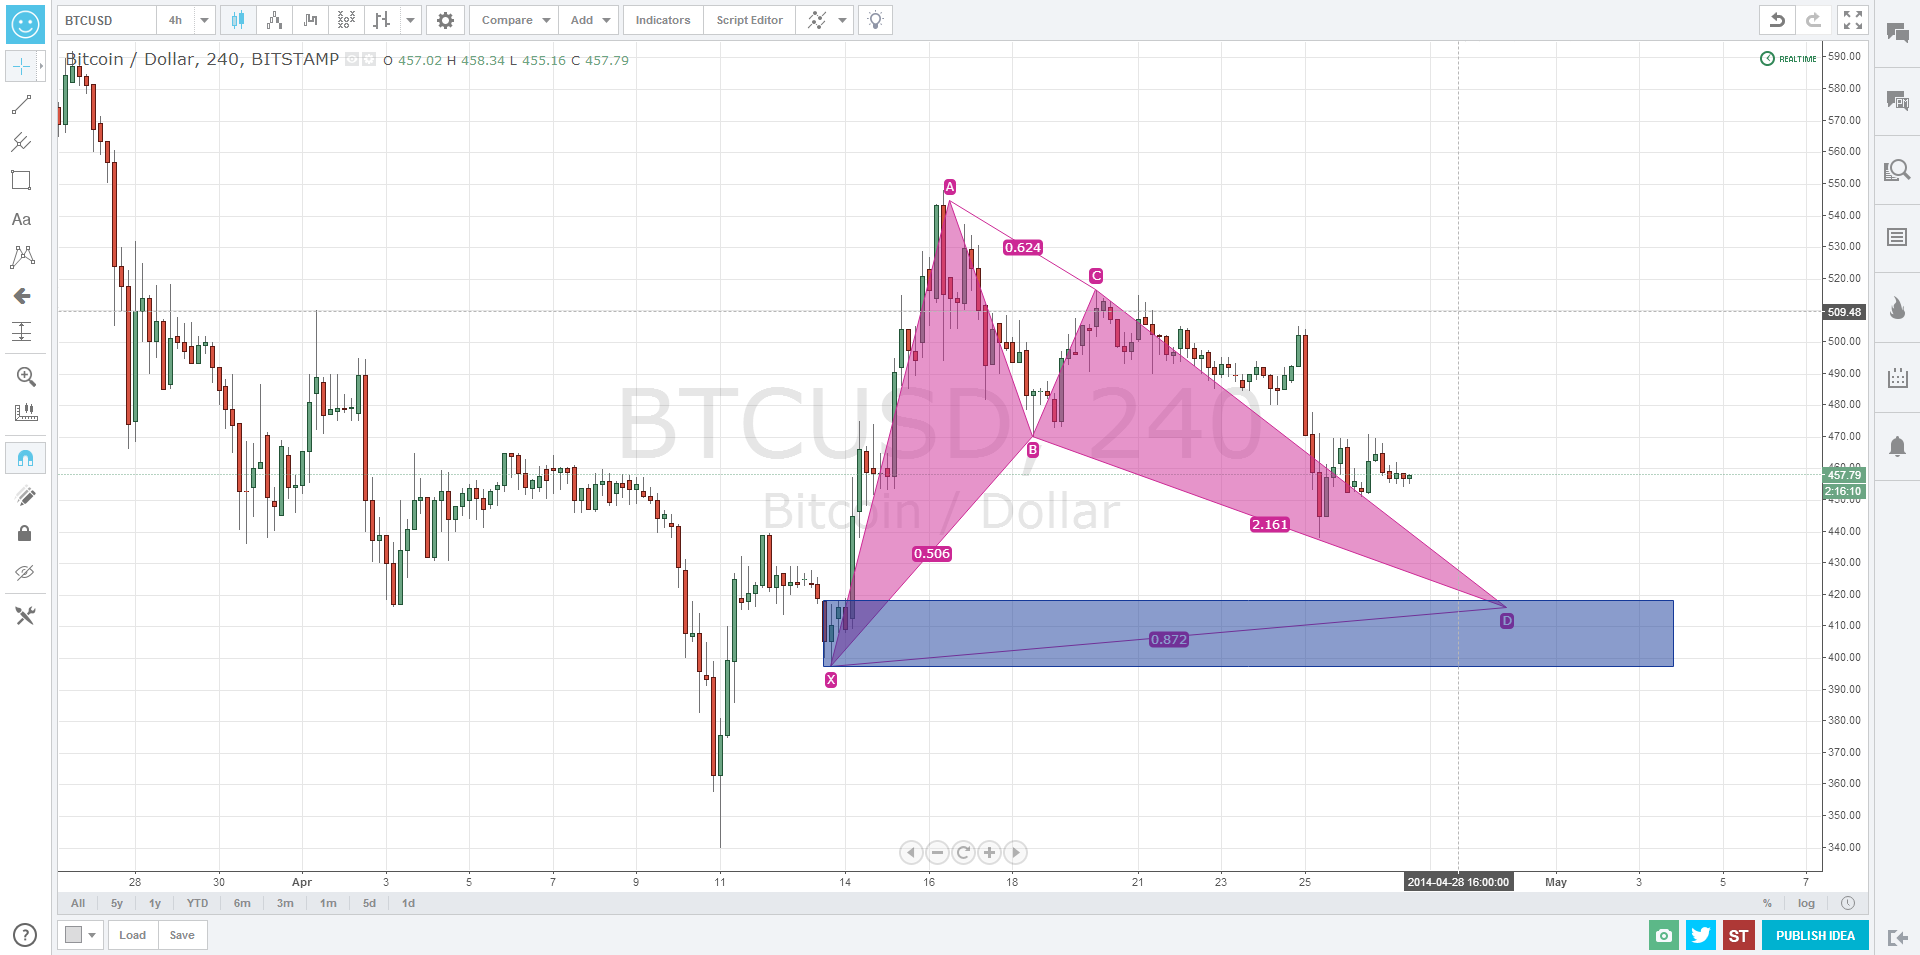
my first post,
was wondering is it a time to entry C-D to south?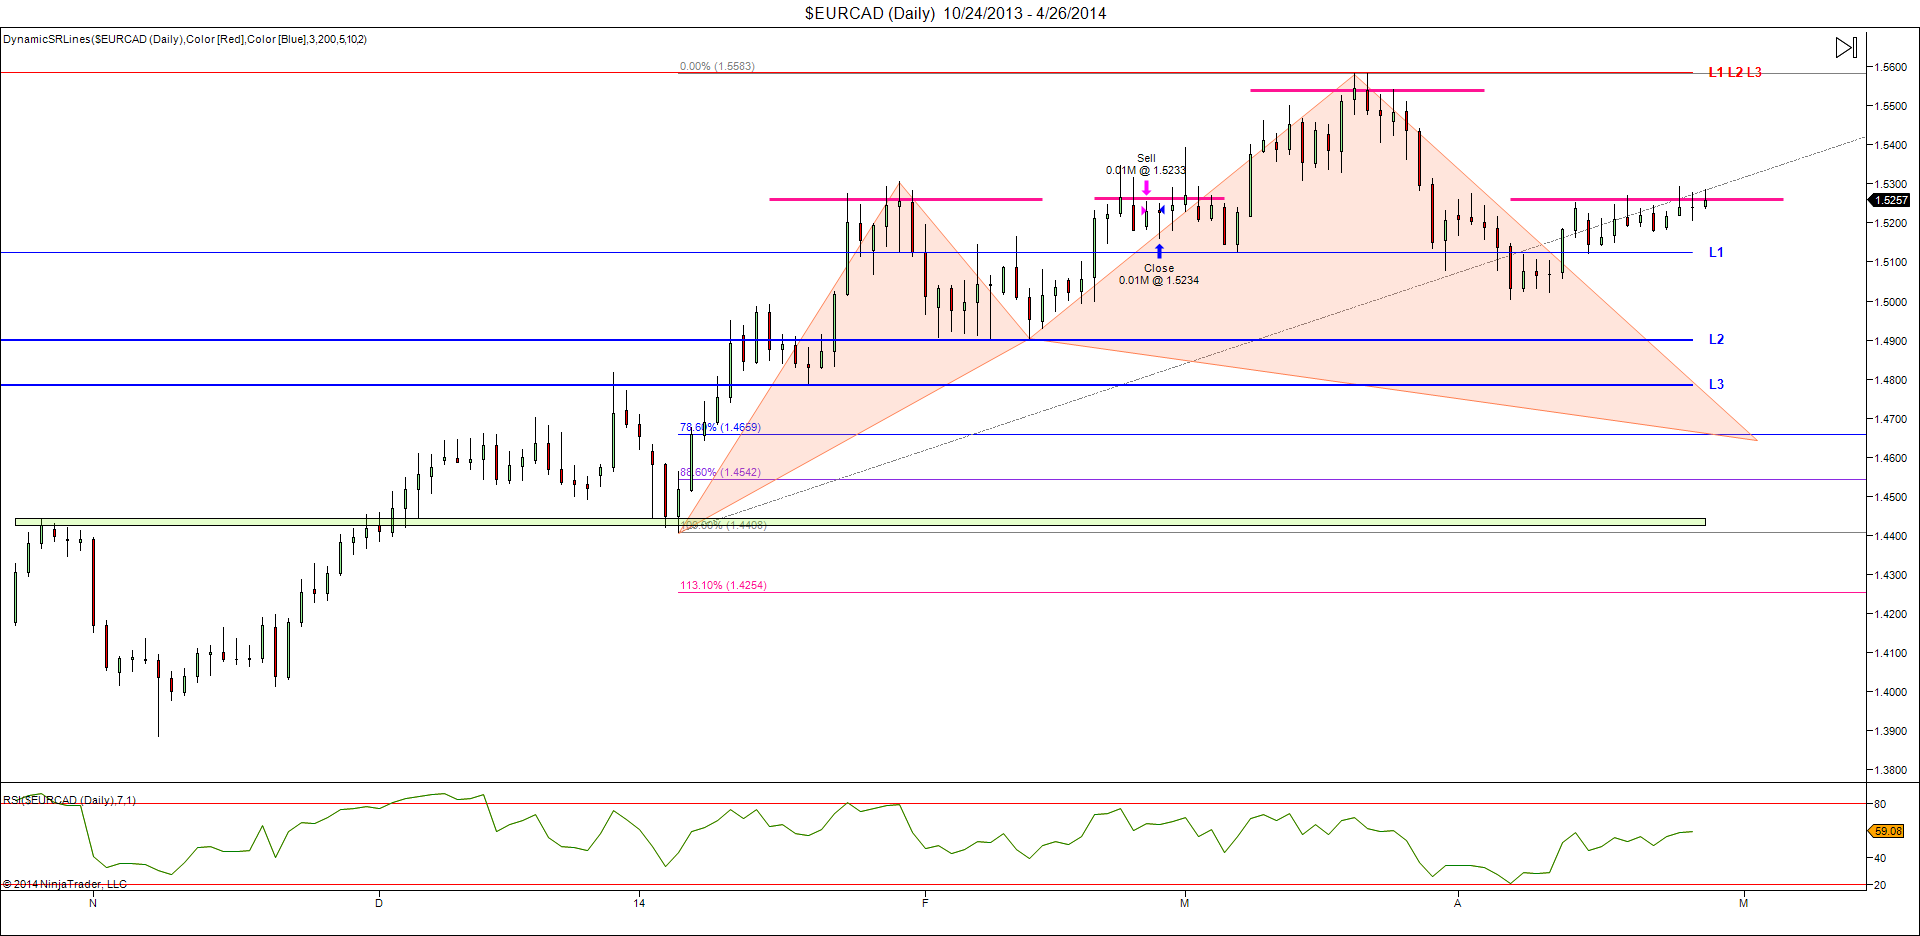
my first post, was wondering is it a time to entry C-D to south?
trading harmonics mean you wait for the price to reach from C to D
and you buy bullish pattern @ that point or sell bearish pattern.
no one guaranteed that price would reach D, if you want to trade from C to D you need to develop your own technic for entry
Thx Irad,
My wondering is based on head and shoulder pattern that we have at this stage. Never try that, so seek other opinion from more experience traders
you never mention anything about head and shoulder,
anyway I don't trade those.