

DRAWDOWN TRACKER PRO - Smart Risk Control for Prop Traders
This indicator include :
✔ Real-time **equity-based drawdown tracking**
✔ Auto-resets at midnight – tracks daily **PnL & win/loss %**
✔ Built-in **economic calendar** with countdown to events
✔ Filter news by **country** and **impact level**
✔ Color-coded dashboard for at-a-glance risk overview
✔ Displays **spread** and **candle time left**
✔ Works on all
👉 Click **Buy** : https://www.mql5.com/en/market/product/137034
Important Note on Economic News Data
To use the built-in economic calendar feature, you must manually download the latest news data using the provided downloader script.
Full instructions here: How to Download News Data – Guide
(News updates are handled separately to optimize performance and avoid WebRequest issues inside indicators.)
👉 Click **Download**: https://www.mql5.com/en/blogs/post/762107
Easy to set up
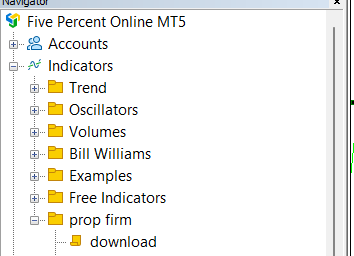
Just one click to download lastest .json file

Interface
The main tab of Drawdown Tracker Pro provides centralized control over the indicator’s key functions and delivers essential real-time insights:
daily equity drawdown, profit and loss (PnL), win/loss ratio, and countdown to economic events.
The following controls and outputs are available for clear, instant risk monitoring.
Main tab
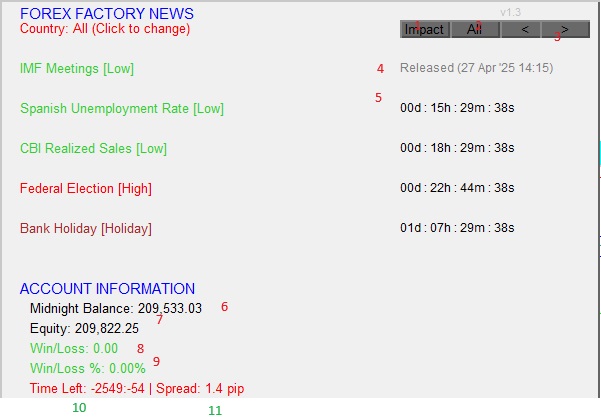
1. Country: All (Click to change)
- This label shows the currently selected country filter for news events.
- Clicking it cycles through available countries (from the JSON news list) to filter news by country
2. "Impact" Button
- This button allows filtering news by impact level: All, High, Medium, Low, or Holiday.
- Each click changes the impact filter to the next option in the list.
3. "<" and ">" Buttons (PrevButton / NextButton)
- These are pagination buttons.
- "<" moves to the previous page of news events.
- ">" moves to the next page (5 news items per page).
4. News Title – Example: "IMF Meetings [Low]"
- This shows the event title along with its impact level.
- Impact level ("Low", "Medium", "High", "Holiday") is color-coded:
- Red for High
- Blue for Medium
- Green for Low
- Brown for Holiday
5. News Countdown Timer
- This shows how much time remains until the news event is released, formatted
as dd : hh : mm : ss.
- If the event has already passed, it displays "Released" with the event date and time.
6. Midnight Balance
- Displays your account balance at broker midnight (00:00 based on BrokerTimezones setting).
- This value is crucial to calculate daily profit/loss and drawdown accurately.
7. Current Equity
- Displays your current equity in real time.
- Equity = Balance + Floating Profits/Losses from open positions.
8. Win/Loss
- Displays today’s total realized Profit/Loss, calculated from the midnight balance until now.
- Positive = profit, negative = loss.
9. Win/Loss %
- Displays today's Profit/Loss as a percentage relative to the midnight balance.
- Color-coded: Green if positive, Red if negative.
10. Candle Time Left
- Shows how much time is left for the current candle/bar to close.
- Automatically adjusts depending on the chart timeframe (M1, M5, H1, etc.).
11. Spread
- Displays the current market spread in pips for the selected symbol.
- Helpful for scalpers or high-frequency traders to monitor trading costs in real time
Input parameters
| Parameter | Description |
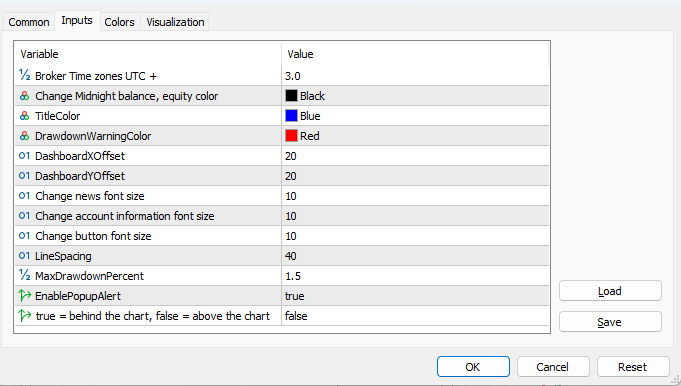
| Broker Time zones UTC + | Sets your broker's server timezone relative to UTC. Example: 3.0 for UTC+3 servers. Correct timezone ensures midnight balance is calculated accurately. For example : FTMO : UTC +1 Ther5ers : UTC+2 during standard time and UTC+3 during daylight saving time - Israel Standard Time (IST) |
| Change Midnight balance, equity color | Color for displaying "Midnight Balance" and "Equity" labels on the dashboard. Default is Black. |
| TitleColor | Color for dashboard section titles like "FOREX FACTORY NEWS" and "ACCOUNT INFORMATION". Default is Blue. |
| DrawdownWarningColor | Color for the drawdown percentage when it exceeds your maximum allowed limit. Default is Red. |
| DashboardXOffset | Horizontal offset in pixels to move the dashboard from the top-left corner of the chart. Default is 20. |
| DashboardYOffset | Vertical offset in pixels to move the dashboard downward. Default is 20. |
| Change news font size | Font size used for news event titles. Adjust for better visibility depending on screen resolution. Default is 10. |
| Change account information font size | Font size for displaying account data like balance, equity, win/loss, etc. Default is 10. |
| Change button font size | Font size for all buttons on the dashboard (Country, Impact, Prev/Next). Default is 10. |
| LineSpacing | Vertical spacing between each news item (in pixels). Default is 40. |
| MaxDrawdownPercent | Sets the maximum allowed drawdown (%) relative to your midnight balance. If exceeded, an alert will trigger. Default is 1.5%. |
| EnablePopupAlert | If true, a popup alert will appear if drawdown exceeds the MaxDrawdownPercent during the day. |
| true = behind the chart, false = above the chart | If true, the dashboard is drawn behind price candles (semi-transparent look). If false, it appears above price candles (full opacity). Default is false. |
Alert Explanation: Equity Drawdown Exceeded
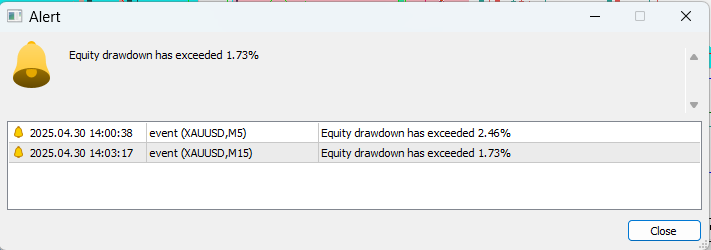
This alert is triggered when the equity drawdown — the percentage drop from the account’s highest equity point — exceeds a specific threshold.
In the screenshot:
-
At 14:03:17 on April 30, 2025, for symbol XAUUSD (M15), the system detected an equity drawdown of 1.73%, triggering the first alert.
-
Shortly after, at 14:00:38 (likely displayed due to overlapping time zones or chart refresh), for XAUUSD (M5), a further drawdown of 2.46% was detected.
These alerts are useful for risk management, especially in prop firm challenges, where exceeding a daily drawdown limit can result in disqualification.
-


