 and how does it work ?")
What is Market Structure Breakout (MSB) and how does it work ?

What is Market Structure Breakout (MSB) and how does it work ?
Market Structure Breakout (MSB) is a crucial concept in technical analysis, offering traders a way to identify shifts in market trends. This article explores what MSB is, how it works, and how it can be used to enhance trading strategies, particularly with the help of an indicator that automates MSB detection.
What is MSB?
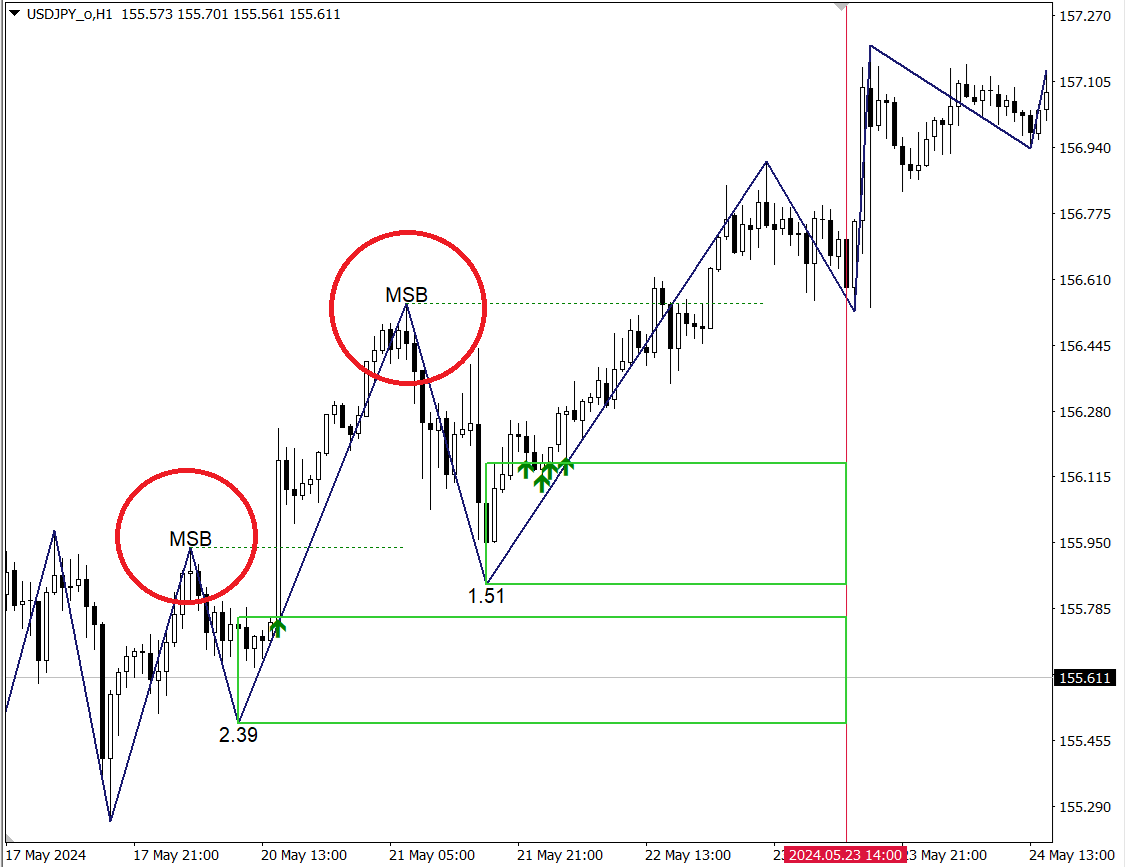
An MSB occurs when the price of an asset breaks above the previous high (for an upward trend) or below the previous low (for a downward trend) while drawing a zigzag-like structure on the chart. This breakout signifies a potential change in market sentiment, signaling new trends or continuation of existing trends.
How to Detect an MSB
To visualize MSB, traders often use a structure similar to a zigzag indicator, highlighting market highs and lows. Here's how MSB works:
- Break of Last High: When the price moves above the last significant high, an upward MSB occurs.
- Break of Last Low: When the price drops below the last significant low, a downward MSB occurs.
Confirming an MSB
Not all breakouts are significant, so it's important to confirm the strength of an MSB. The confirmation involves evaluating how much the price has successfully broken the previous leg. For example, a 2% or 5% break might be considered a valid MSB, depending on the market and timeframe.
Supply and Demand Zones in MSB
When an MSB occurs in the buy direction:
- The last low before the breakout often acts as a Demand Zone, a potential area for buying opportunities if the price returns.
For an MSB in the sell direction:
- The last high becomes a Supply Zone, indicating a potential area for selling opportunities if revisited.
Take Profit Targets: Sell TP and Buy TP
One of the most valuable aspects of understanding MSB is determining precise take-profit levels:
- Sell Take Profit (Sell TP): This can be identified by locating unfulfilled MSBs in the buy direction.
- Buy Take Profit (Buy TP): This is found by identifying missed, untouched MSBs in the sell direction.
Introducing the Market Structure Breakout Indicator
Our Market Structure Breakout Indicator is designed to automate the detection and analysis of MSBs. It offers the following features:
- Automatic MSB Detection: The indicator highlights MSBs as they form, allowing traders to see market structure shifts in real-time.
- Confirmation Factors: It includes criteria to qualify an MSB, indicating its strength.
- Supply and Demand Zones: The indicator identifies key supply and demand areas based on the latest MSBs.
- Sell TP and Buy TP Levels: It calculates potential profit-taking levels, helping traders to set precise exit points.
The indicator is available for testing at the following link: Test Market Structure Breakout Indicator.
Conclusion
Mastering Market Structure Breakout can significantly improve trading strategies by providing clear insights into market trends, key price zones, and optimal take-profit levels. By using our specialized indicator, traders can enhance their analysis and make informed decisions with greater confidence.
The attached image of our indicator demonstrates how MSB, supply and demand zones, and take-profit targets appear in real-time analysis, giving you a clearer understanding of market behavior.


")