

- SharkFin Pattern
- Check Strong/Weak Up or Down Trend and Strong/Medium/Weak BUY or SELL Signal
- Check if not Overbought/Oversold or Consolidation and Volatility
- Check if away from SR (if SR set to true)
- Check higher TF trend align (if set to true)
- Daily High/Low Detection
Available for sale here:
https://www.mql5.com/en/market/product/41826
Demo allows 3 pairs. But contains all functionality of the actual dashboard.
So you can try it before buying 🙂
To use TDI.tpl file, in Dashboard properties:
“Use Template For New Window”: TDI
Sharkfin Extras are also attached with this post
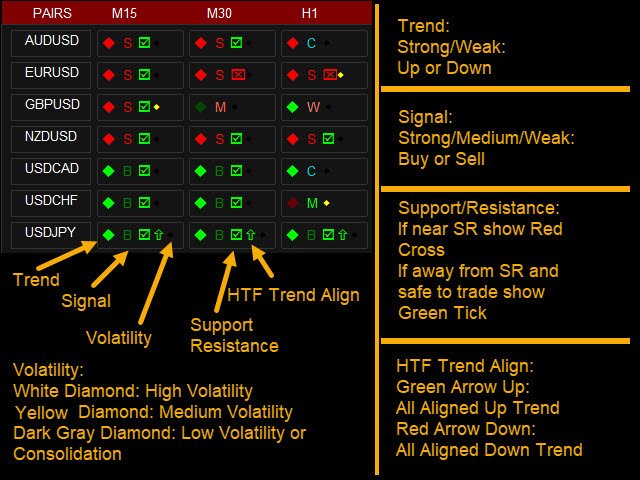
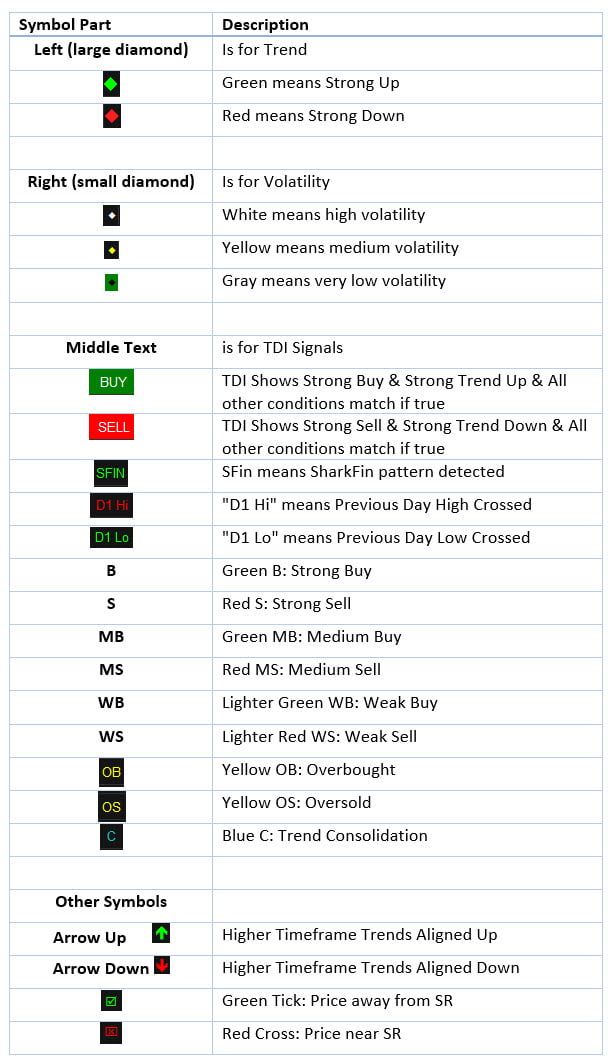
Symbols Meaning:
TDI Explained:
https://abiroid.com/indicators/traders-dynamic-index-tdi-explained
How TDI Scanner Checks work (Sequence of Checks):
– Check Strong/Weak Up or Down Trend
– Check Strong/Medium/Weak BUY or SELL Signal
– Check if not Overbought/Oversold
– Check if not Consolidation
– Check Volatility (and if Weak and Medium set to be ignored)
– Check if away from SR (if SR set to true)
– Check higher TF trend align (if set to true)
Other Checks:
– Daily High/Low Detection
Checks for:
– SharkFin Pattern
Free indicator for SharkFin:
https://www.mql5.com/en/market/product/42405/
– TDI Trend: Strong/Weak Trend Up/Down
– TDI Signal: Strong/Medium/Weak Signal for Buy/Sell
– Consolidation
– Overbought/Oversold
– Volatility Bands
– Previous Day/Week/Month High/Low
What each button means (examples):
Left diamond is for trend:
– Green means Strong Up and Red means Strong Down
– Dark Green means Weak Up and Dark Red means Weak Down
Right (small diamond) Icon is for Volatility:
– White means high volatility
– Yellow means medium volatility
– Black means very low volatility
Middle Text is for TDI Signals:
– SFin means SharkFin pattern detected
– “D1 Hi” or “D1 Lo” means Previous Day High or Low Crossed
– Green M: Medium Buy and Red M: Medium Sell
– Lighter Green W: Weak Buy and Lighter Red W: Weak Sell
– Yellow OB: Overbought and OS: Oversold
– Blue C: Trend Consolidation
Support/Resistance:
If price is close to Support or Resistance a Red cross is shown.
If price is away from Support or Resistance a green Tick is shown.
Alerts:
Popup alerts or email alerts or push notifications.
Settings:
All Common Dashboard settings are explained in detail here:
https://abiroid.com/indicators/abiroid-scanner-dashboard-common-settings
TDI Dash Specific Settings:
– ShowWeakTrend: true/false To Show left diamond if trend is weak or not
– ShowVolatility: true/false To Show right diamond for volatility or not
– Refresh After Ticks (if shift 0): For shift 0, wait for this number of ticks before refreshing everytime. By default 100. If you want this to refresh faster specify a lower number.
For higher TF use a higher number like 300 or 500.
SharkFin:
– Detect: true/false
– UseVolBands: Check Volatility Bands Cross along with SharkFin pattern
– Upper/Lower Levels: RSI Levels where price crosses and comes back to create a SharkFin
– MinLevelDist: Minimum distance from RSI Upper/Lower Level (for valid Sharkfin)
– MaxFinBars: Max no of bars within which pattern should be created
High/Low:
– Detect: true/false
– Period: Previous Day/Week/Month
– ShowAlerts
How to Trade:
Best way to use this indicator is with Support and Resistance, Fibo or other such supporting Indicators. Or any other indicator which might validate that trend is still strong and not near an SR Zone.
Use volatility for further checking the signal. Don’t trade when volatility diamond is black and trade carefully when Overbought or Oversold.
You can also use RSI and V-Bands patterns to trade. Like when an RSI “M” forms slightly outside the V-Bands, trade Sell if high volatility. Or if a “W” forms trade Buy.
Other good patterns are the RSI Head and Shoulders patterns. These patterns combined with Price Action are very accurate.
Important Note:
– Please don’t use too many Timeframes and too many Pairs because Scanner will need to scan each and every one and might get slower the more pairs you select.
– Best is to trade trending markets for higher timeframes. For lower timeframes, scalping sideways markets also works well with TDI.
– If you want price to be above the dashboard, then right click on chart -> Go to Properties (F8) -> Common Tab -> Check “Chart on Foreground”.
But if dashboard is behind the price chart, then you might have difficulty pressing the buttons. So, best to keep dash in the front and open buttons in new charts.


