Technical outlook suggests that sellers are stepping back in the near term. Next week's calendar highlights the U.S. Consumer Price Index (CPI) data for August. Gold (XAUUSD), which had faced moderate bearish pressure earlier in the week, benefited from a decline in U.S. Treasury yields and reclaimed the $2,500 level. The U.S. inflation data for August could drive the precious metal to its next directional move.
Gold Buyers Continue to Defend $2,500
At the start of the week, gold traded within a narrow range due to a thin market, as U.S. financial markets were closed for Labor Day.
On Tuesday, major Wall Street indices dropped sharply after the long weekend, causing the U.S. dollar to gain strength and pushing the XAUUSD pair below $2,500. On Wednesday, the U.S. dollar came under selling pressure after the Bureau of Labor Statistics (BLS) reported that job openings for the last business day of July were 7.67 million, below June's 7.9 million and market expectations of 8.1 million.
By early Thursday, gold had returned above the key $2,500 level, with technical sellers taking action to support the yellow metal's recovery. During the U.S. session, Automatic Data Processing (ADP) reported that private-sector employment increased by 99,000 in August, following a revised July increase of 111,000 (from 122,000), and falling short of market expectations of 145,000. The yield on 10-year U.S. Treasury notes dropped to 3.7%, opening the path for further gains in the XAUUSD pair.
On Friday, BLS reported that non-farm payrolls increased by 142,000 in August, falling short of the market forecast of 160,000. Additionally, July's growth was revised down to 89,000 from 114,000. Other details of the employment report showed the unemployment rate fell to 4.2%, as expected. As the 10-year Treasury yield continued its weekly decline, falling below 3.7% after the data, gold maintained its positions ahead of the weekend.
Gold Investors Await U.S. Inflation Data
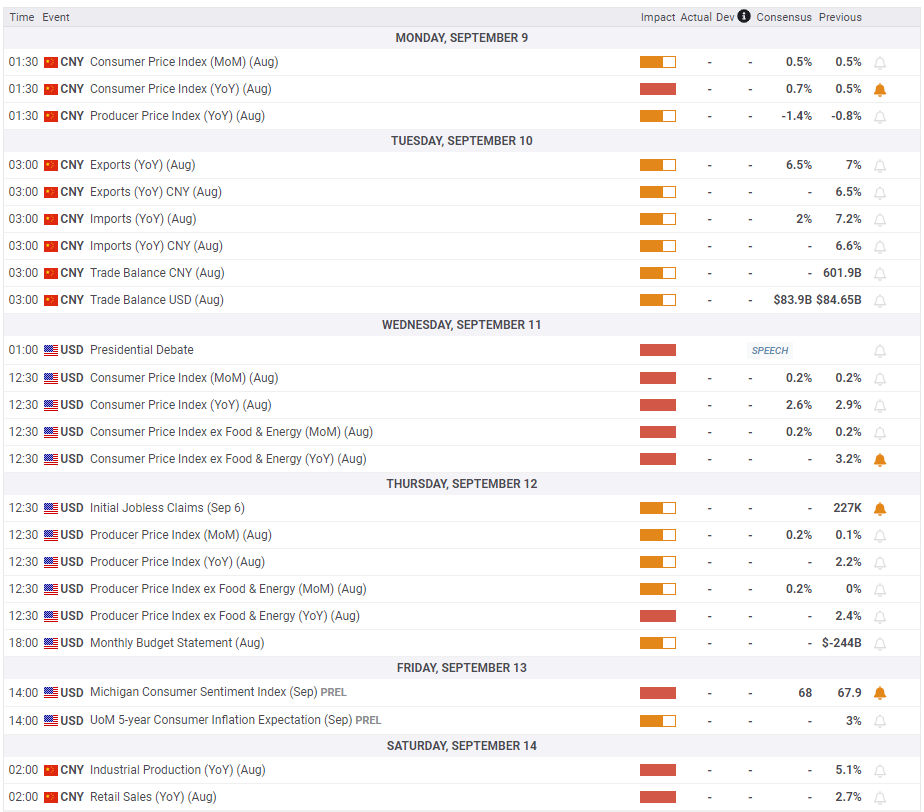
China’s trade balance data could influence gold during Asian trading on Tuesday. If China's trade surplus for August significantly increases, it may prompt a rise in gold prices as China is the world's largest consumer of gold. Conversely, if the trade surplus shrinks, concerns about gold demand prospects could lead to a price decline in the near term.
On Wednesday, market participants will closely monitor August CPI data from the U.S. The CPI and core CPI, excluding volatile food and energy prices, are expected to rise by 0.2%. If the core CPI increases by 0.4% or more, U.S. Treasury yields mightrise, potentially causing gold to lose support. On the other hand, if the index meets or falls below market expectations, the U.S. dollar may struggle to attract investors, supporting a rise in the XAUUSD pair.
On Thursday, the European Central Bank (ECB) will announce its monetary policy decisions. While this event is unlikely to directly impact gold prices, it could affect the U.S. dollar. A dovish surprise from the ECB could lead to a capital shift from the euro to the U.S. dollar, potentially limiting gains for XAUUSD.
“We see positioning dynamics at extreme levels that historically have marked significant turning points in gold markets,” said Daniel Gali, senior strategist at TD Securities. “Macro funds are currently positioned at levels seen only during Brexit in 2016, ‘hidden QE’ in 2019, or the peak panic of the COVID-19 crisis in March 2020. This time, physical markets have already quieted, while extreme positions in Shanghai traders and CTA trend followers are also evident. Downside risks are stronger,” added Gali.
Technical Outlook for Gold
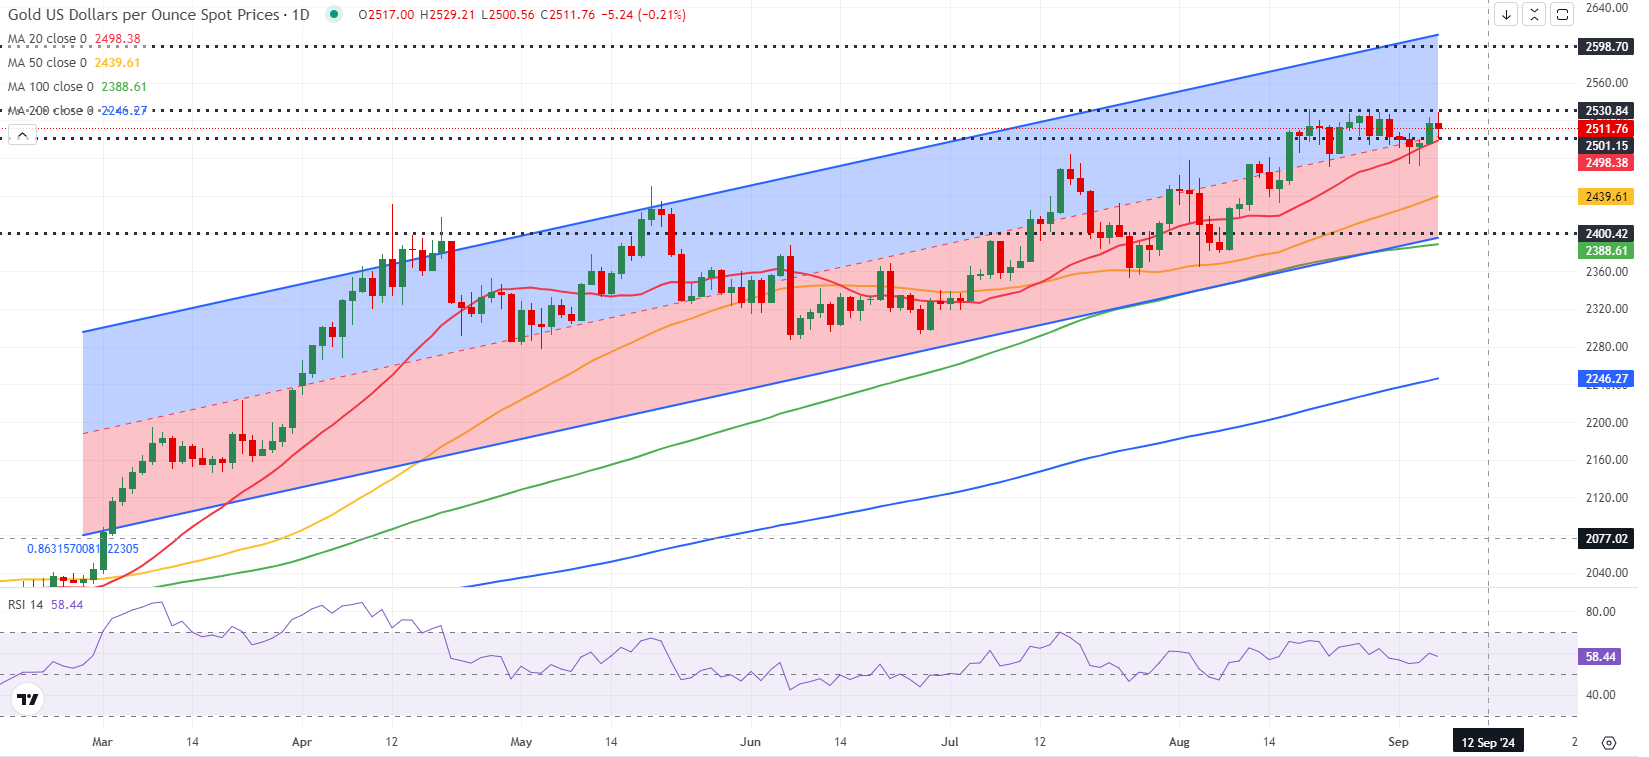
The bullish outlook remains intact in the near term: the Relative Strength Index (RSI) on the daily chart hovers around 60, and gold trades within the upper half of the upward regression channel formed in early March.
Immediate support is at $2,500 (20-day simple moving average (SMA), middle of the upward regression channel). If gold falls below this level and confirms it as resistance, $2,440 (50-day SMA) could be the next support before $2,400 (bottom of the upward channel).
On the flip side, initial resistance is at $2,530 (static level). Once gold clears this hurdle, it could target the upper boundary of the upward channel at $2,600.
Thanks for creating the material Eren Sengezer