
Forex and Cryptocurrency Forecast for August 26 – 30, 2024


EUR/USD: Fed Chair Sinks the Dollar
● On Wednesday, 21 August, the DXY dollar index dropped to an eight-month low, finding support at the 100.92 level. Consequently, the EUR/USD pair recorded a 13-month high, reaching 1.1173. The last time it reached such heights was in July 2023. This dynamic can be attributed to the rise in global investor risk appetite, the narrowing divergence in economic growth between the US and the Eurozone, and, of course, expectations of decisive steps by the Federal Reserve towards monetary policy easing (QE).
A 25 basis point rate cut at the FOMC (Federal Open Market Committee) meeting on 18 September is almost universally expected. Moreover, following the release of updated data on the US labour market, the probability of a 50 basis point cut increased from 30% to 35%. The futures market also anticipates that the total reduction in the cost of dollar borrowing by the end of the year will amount to 95-100 basis points.
As for the euro, expectations are significantly more modest: there is a 40% probability of a 25 basis point rate cut at the ECB meeting on 12 September. Overall, a 50 basis point cut is projected by the end of the year. This divergence in the pace of QE provides a certain advantage to the euro. As a result, according to data from Swiss UBS Group, algorithmic traders alone sold approximately $70-80 billion in August. On the other hand, as noted by analysts at Bank of New York Mellon, financial managers have been actively buying the euro in the last few days of the week.
● In July 2022, inflation in the US stood at 9.1%. Thanks to the tightening of monetary policy (QT), the US central bank managed to bring it down to 3.0%. However, the Consumer Price Index (CPI) then practically plateaued, stubbornly refusing to approach the target of 2.0%. In fact, it occasionally rose to 3.5-3.7%. In August, the CPI was recorded at 2.9%.
On the other hand, raising the interest rate to a 23-year high of 5.50% and maintaining it at this level for the past nine months has led to problems in the US economy. The manufacturing activity index dropped to eight-month lows, while unemployment in the country increased from 3.7% to 4.3%. As a result, the regulator is now faced with a choice: either continue the fight against inflation or support the economy. It is evident that the Fed will choose the latter. Notably, back in July, several FOMC members were ready to vote for a rate cut. However, they refrained, opting instead to wait until September to make a decision based on more up-to-date macroeconomic indicators.
● Unlike the Federal Reserve, the European Central Bank (ECB) may implement its monetary policy easing at a more moderate pace, judging by several factors. Consumer inflation (CPI) is currently at 2.6%, the growth of the average agreed wage in the Eurozone slowed in Q2 from 4.7% to 3.6%, and the interest rate stands at 4.25%, which is 125 basis points lower than the current Fed rate.
According to data released on Thursday, business activity in the Eurozone increased. The composite PMI index, according to preliminary estimates, rose to 51.2 points in August, up from 50.2 the previous month. Markets, on the contrary, had forecasted a decline in the index to 50.1 points. PMI values above 50.0 indicate economic growth, and this trend has slightly dampened expectations of two ECB rate cuts this year. However, some analysts believe this rise in business activity is temporary and driven by the Olympic Games in Paris. This theory is further supported by the fact that Germany's PMI, the engine of the European economy, is declining. The German composite index, which was expected to rise to 49.2, actually fell from 49.1 to 48.5 in August.
● Aside from macroeconomic statistics, the performance of the dollar this week may have been influenced by Federal Reserve Chair Jerome Powell's speech at the Annual Economic Symposium in Jackson Hole, USA, scheduled for the very end of the workweek, on Friday, 23 August. And it did have an impact, though not in the dollar's favour.
The Fed Chair confirmed that the time had come to adjust monetary policy. "Inflation has significantly decreased and is now much closer to the target. My confidence that inflation is on a sustainable path back to 2% has increased," Powell stated, noting that "upside risks to inflation have diminished, while downside risks to employment have increased." According to him, the cooling of the labour market is undeniable, and the Fed will do everything possible to support it. "The current rate level provides ample room to respond to risks, including an undesirable further weakening of the labour market. The timing and pace of rate cuts will depend on incoming data, outlook, and the balance of risks."
Thus, Powell left the door open for a gradual rate cut for the remainder of the year. The market responded to this by dropping the DXY dollar index to 100.60, and the EUR/USD pair surged to 1.1200. The pair ended the five-day period at the 1.1192 level. Before the Fed Chair's speech, 80% of surveyed analysts expected a further downward correction. However, after the speech, the balance of power shifted, and now only 40% expect the dollar to strengthen and the pair to fall to 1.1000 in the near future. An equal number sided with the euro, while the remaining 20% took a neutral stance. In technical analysis, all 100% of trend indicators and oscillators on D1 point north, although 15% of the latter are in the overbought zone. The nearest support for the pair is located in the 1.1170 zone, followed by 1.1095-1.1110, 1.1030-1.1045, 1.0985, 1.0880-1.0910, 1.0825, 1.0775-1.0805, 1.0725, 1.0665-1.0680, and 1.0600-1.0620. Resistance zones are found around 1.1200, then 1.1230-1.1275, 1.1350, and 1.1480-1.1505.
● The economic calendar for the upcoming week is packed with significant events. On Tuesday, 27 August, the GDP figures for Germany for Q2 will be released, and on Thursday, 29 August, the GDP data for the US will follow. Also, on 29 August, preliminary data on consumer inflation (CPI) in Germany will be available. Additionally, the traditional statistics on the number of initial jobless claims in the United States will be published on this day. Friday, 30 August, promises increased volatility due to the release of key inflation indicators such as the Consumer Price Index (CPI) in the Eurozone and the Core Personal Consumption Expenditures (Core PCE) index in the US. Moreover, 30 August is the last business day of the month, and many market participants will be taking steps to improve their balance sheet figures.

GBP/USD: Tortoises Beat Doves
● The slower a central bank reduces interest rates, the better its national currency tends to perform. This race between doves and tortoises has naturally extended to the GBP/USD pair. Investor confidence that the doves at the Federal Reserve will begin easing monetary policy at the upcoming September meeting continues to weigh on the dollar. On the other hand, the likelihood of a rate cut by the Bank of England (BoE) in September is far less certain. It is quite possible that QE in the United Kingdom will proceed at a tortoise-like pace, which has been pushing the GBP/USD pair upwards for the second consecutive week.
According to the latest data from the UK's Office for National Statistics, inflation (CPI) in the country remains relatively low at 2.2% year-on-year. This follows two months during which it was at the target level of 2.0%. The pound's rise accelerated amid strong unemployment figures, which exceeded expectations. On 13 August, it was reported that the unemployment rate fell in June to 4.2%, a significant improvement from May's 4.4%. Considering that the forecast pointed to a rate of 4.5%, this data made a strong impression on the market. Such a decline in unemployment indicates positive changes in the labour market and could be a sign of economic stabilization, which may boost investments.
Favourable reports on the Purchasing Managers' Index (PMI) further strengthened the pound. Data released by the Chartered Institute of Procurement & Supply and S&P Global on Thursday, 22 August, showed that the preliminary PMI in the UK exceeded expectations, jumping to 53.4 in August from 52.8 in the previous month. The manufacturing PMI also rose from 52.1 to 52.5 points, beating the forecast of 52.1. The services PMI increased to 53.3 in August from 52.5 in July, surpassing the consensus forecast of 52.8. Following the release of this positive data, the probability of a Bank of England rate cut in September dropped below 30%.
● Following the dovish speech by Fed Chair Jerome Powell, Friday evening in Jackson Hole also featured a speech by BoE Governor Andrew Bailey, during which the GBP/USD pair reached a high of 1.3230, closing at 1.3216.
The median forecast for the near term is entirely neutral: one-third of experts expect the dollar to strengthen and the pair to decline, another third favour the pound, while the remaining third are undecided. As for technical analysis on the D1 timeframe, similar to the EUR/USD, all 100% of trend indicators and oscillators point north (with 20% of the latter signalling overbought conditions). If the pair declines, it will encounter support levels and zones around 1.3070-1.3125, 1.2980-1.3010, 1.2940, 1.2815-1.2850, 1.2750, 1.2665-1.2675, 1.2610-1.2620, 1.2500-1.2550, 1.2445-1.2465, 1.2405, and 1.2300-1.2330. In case of an upward movement, resistance will be met at levels 1.3230-1.3245, 1.3305, 1.3425, 1.3485-1.3515, 1.3645, 1.3720, 1.3835, 1.4015, and the 30 May 2021 high of 1.4250.
● No significant events or macroeconomic statistics related to the state of the UK economy are scheduled for the upcoming week. Additionally, traders should be aware that Monday, 26 August, is a bank holiday in the UK.

CRYPTOCURRENCIES: Snake Trend in BTC Nears the Finish Line
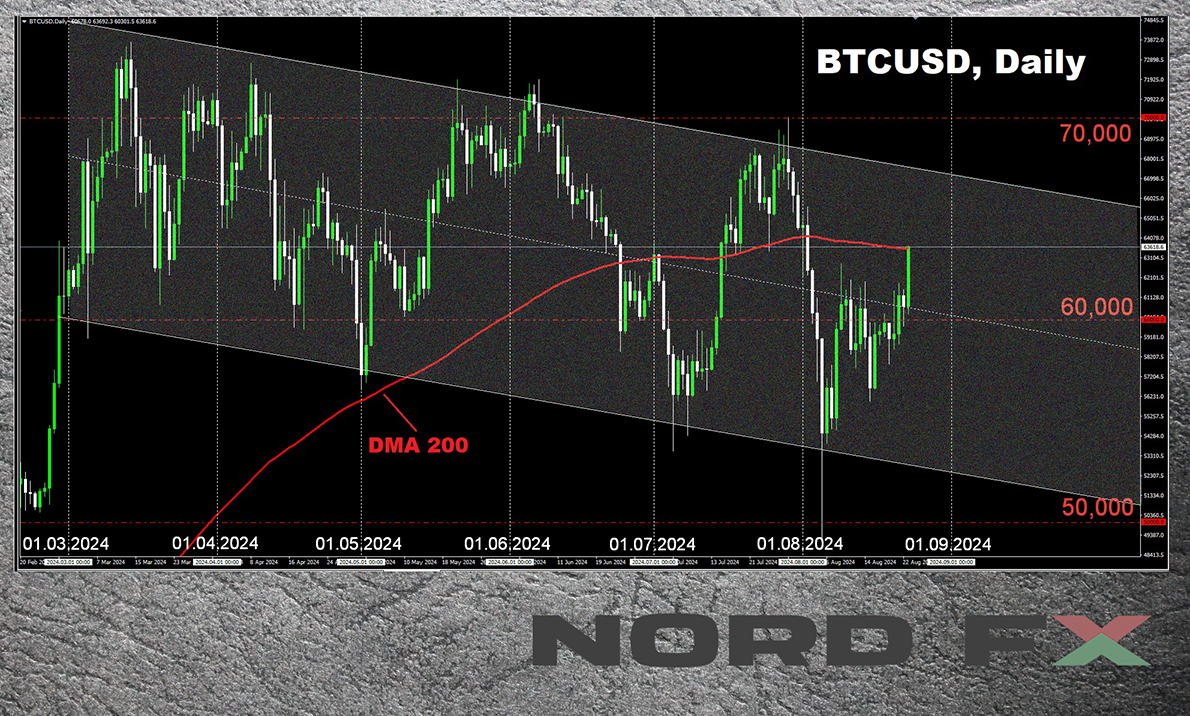
● In our previous review, we didn't limit ourselves to the conventional concepts of bearish and bullish trends and introduced our own term for sideways movement within a narrow range: the Snake trend. True to its name, the BTC/USD pair continued to slither in a snake-like manner last week, making attempts to break below the $58,000 support or above the $62,000 resistance. This pattern persisted until the evening of 23 August.
● If we look at the medium-term chart, it becomes clear that after 14 March, when bitcoin reached a new all-time high (ATH) of $73,743, it has been moving within a descending channel, displaying significant volatility. Analysts at CryptoQuant believe that the decline in BTC's price is due to a reduction in purchases by issuers of spot exchange-traded funds (ETFs) in the US. In March, investment firms were buying an average of 12,500 BTC per day on exchanges, whereas from 11 to 17 August, this average dropped to just 1,300 coins: nearly ten times less. The monthly growth rate of crypto assets held by whales has decreased from 6% in March to the current 1%, which has inevitably impacted the price of the leading cryptocurrency. However, in our view, the key takeaway is that despite the slowdown, these holdings are still gradually increasing.
It is also important to note that the number of hodlers continues to grow. According to CryptoQuant, long-term retail holders have continued to accumulate digital gold, with a record-high monthly figure of 391,000 BTC.
Bitwise reports that the share of large institutional investors in the total assets under management (AUM) has risen from 18.74% to 21.15%. The fact that institutional investors maintain their confidence in the leading cryptocurrency is an encouraging sign. Experts highlight that the rate at which spot BTC-ETFs have been filled is the fastest in the history of all exchange-traded funds. Notably, 60% of the top 25 investment firms own bitcoin-based spot ETFs. Additionally, 6 out of the 10 largest hedge funds, including Citadel, Millennium Management, and G.S. Asset Management, are increasingly incorporating bitcoin ETFs into their investment strategies.
● Reports from institutional fund managers and companies for Q2 2024 clearly demonstrate a preference among major players for spot BTC-ETFs over products based on other assets, such as gold. "Large investors have stopped fleeing from the increased volatility of bitcoin, remaining relatively stable and inclined towards hodling," writes Andre Dragosch, Head of Research at ETC Group. According to this expert, the vast majority of investors who purchased shares in spot BTC-ETFs since the beginning of 2024 have increased their positions in the assets. "Of the companies registered in Q1, 44% increased their holdings, 22% maintained them, 21% reduced them, and 13% withdrew their stake in bitcoin-ETFs during Q2," writes Andre Dragosch. He concludes, "When compared to other exchange-traded funds, this performance is indeed impressive."
"When the bullish cycle begins, the number of investors eager to invest in exchange-traded products based on the leading cryptocurrency will increase significantly," predicts Bitwise. "We anticipate that in 2025, the inflow of funds into spot bitcoin-ETFs will exceed that of 2024, and in 2026, it will surpass that of 2025."
● We would like to add a couple of figures to this positive forecast. The first is that, according to data from the cryptocurrency exchange Binance, 50% of investors in Latin America are purchasing cryptocurrency for the long term. The second is that the total market capitalization of stablecoins is on the rise, reaching a new all-time high of $165 billion. Both of these figures indicate not only growing confidence in the future of digital assets but also increasing liquidity, which could serve as a pivotal foundation for the next bull rally. The only remaining question is: when will this rally finally begin?
● A number of experts believe that without the resumption of ETF purchases, overall demand for bitcoin may remain subdued. Considering the current consolidation (Snake trend) and the fact that the leading cryptocurrency closed July in the red, it’s possible that August could also end with losses. Based on this, Artificial Intelligence from PricePredictions has calculated that by 31 August, bitcoin will be trading at around $53,766, and in the last decade of September, it could approach the $48,000 mark.
● The analyst known as Crypto Banter strongly disagrees with the AI's forecast. He points out that the Stochastic RSI momentum indicator is entering the investment zone, signalling a potential opportunity for adding BTC to investor portfolios. Additionally, Crypto Banter highlights the Bitcoin Fear and Greed Index levels as important indicators for identifying potential market bottoms and profitable entry points. According to his observations, the current conditions suggest that now is an optimal time to open long positions on BTC.
● CryptoQuant shares a similar stance. On the Hash Ribbons indicator chart, the 30-day moving average (DMA) has crossed above the 60-day moving average. According to the company's analysts, this crossover often coincides with a low point in BTC's price, offering investors an opportunity to enter the market under more favourable conditions. "The Hash Ribbons indicator suggests that miner capitulation is nearing its end," they write. "The decrease in profitability due to increased computational power and reduced block rewards is pushing companies to invest in more energy-efficient equipment and data processing centres."
CryptoQuant experts believe that miners will continue with their strategy of accumulating bitcoin reserves, anticipating a rise in the cryptocurrency’s value to $70,000 or higher by the end of the year. As for smaller miners, CryptoQuant expects that they will gradually exit the market due to a lack of resources to purchase expensive equipment, leading to the formation of conglomerates dominated by major players in the mining industry.
● Michael Van De Poppe, CEO of MN Trading, is convinced that bitcoin will reach a new peak as early as this autumn, with institutional investors serving as the primary catalyst for its growth. These investors have been actively buying bitcoin during its price dip, and Van De Poppe believes that the recent correction could trigger a powerful rally in September or October this year. The key factor, according to him, is that bitcoin must continue to hold above the $57,000 mark.
Similarly, the analyst known as Rekt Capital has predicted that the bull rally will start around the same time. He suggests that approximately 160 days after the halving, bitcoin will enter a parabolic phase. Based on his calculations, this should occur in late September 2024.
● Matthew Sigel, Head of Digital Assets Research at VanEck, is also optimistic about bitcoin's future. He believes that bitcoin will approach its all-time high shortly after the US presidential elections. "We are observing a typical seasonal pattern where the first cryptocurrency usually faces challenges […] after the halving," he writes. "With the influx of liquidity, bitcoin should soon begin to rise." According to Matthew Sigel, regardless of who becomes the next US president, the market should prepare for four years of "reckless fiscal policy." It is during such a period that the first cryptocurrency will reach its peak values. He predicts that by 2025, influenced by a loosening of monetary policy, BTC will surpass its historical maximum.
● Zach Pandl, Managing Director at Grayscale Investments, agrees with this outlook in principle. He believes that the rise in bitcoin's price is driven not by statements from US presidential candidates but by macroeconomic trends and the weakening of the dollar. Pandl argues that the new administration is unlikely to take any significant steps toward regulating the crypto industry, and everything will likely remain as it is, as authorities are more concerned with the growing national debt. The Grayscale Investments executive noted that bitcoin is increasingly being seen by investors as an attractive tool for protecting against inflation and the devaluation of fiat currency. Pandl predicts that the US dollar will depreciate even further over the next decade, leading to increased investments in the leading crypto asset.
● Recently, the digital asset management company VanEck released a new forecast for bitcoin, outlining three potential price levels for BTC depending on market developments and its adoption as a global reserve asset. According to the base scenario, by 2050, the flagship cryptocurrency could reach $3 million per coin. Under the bearish scenario, the minimum value of BTC would be $130,314. However, if the bullish scenario comes to pass, 1 bitcoin could be worth $52.4 million in 26 years.
Against this backdrop, the forecast by Robert Kiyosaki, author of the bestseller "Rich Dad Poor Dad," seems relatively modest. The writer and economist believes that amid an impending downturn in currency and stock markets, the prices of precious metals will multiply, and the price of digital gold could reach $10 million per BTC.
● As of the time of writing this review, on the evening of Friday, 23 August, the BTC/USD pair is still far from reaching $10 million or $50 million. However, following the dovish speech by Fed Chair Jerome Powell in Jackson Hole, the pair capitalized on the weakening dollar, surged upwards, and reached a height of $64,200. The total market capitalization of the crypto market now stands at $2.24 trillion (up from $2.08 trillion a week ago). The Crypto Fear & Greed Index has risen from 27 to 34 points but remains in the Fear zone.

CRYPTOCURRENCIES: Bulls Poised to Lift ETH and Ripple
● According to data from the cryptocurrency exchange Crypto.com, the number of cryptocurrency holders grew by 6.4% in the first half of 2024, rising from 580 million to the current 617 million. Notably, Ethereum outpaced bitcoin in this regard. The number of ETH holders increased by 9.7%, from 124 million to 136 million, while bitcoin holders grew by 5.9%, reaching 314 million compared to 296 million at the end of December 2023.
Analysts at Crypto.com attribute the broader adoption of Ethereum to the Dencun upgrade in March. This hard fork resulted in some layer-2 protocols on the ETH blockchain reducing transaction fees by 99%. For bitcoin, key factors included the April halving, the launch of the Runes protocol, and the approval of spot BTC-ETFs, which attracted over $14 billion from institutional investors.
● Recently, well-known analyst and trader Peter Brandt, head of Factor LLC, predicted that Ethereum could "signal" a drop to $2,000 per coin or even lower. However, analysts at CryptoQuant disagree with this forecast from the Wall Street legend. In their view, ETH buyers are starting to regain their strength. "In June, when Ethereum's price reached $3,800, the Open Interest (OI) hit a record high, exceeding $13 billion. This indicated a potential market correction, which indeed occurred. On 5 August, the OI dropped to $7 billion, but it is now recovering," the company's analysts reported.
They believe that a significant increase in the price of the leading altcoin will become possible once leveraged players return to the market. "Current data shows that buyers are becoming more active. There is a trend suggesting that a strong bullish rally is on the horizon," CryptoQuant indicated. According to expert forecasts, positive momentum in the cryptocurrency market is already emerging, and it is expected to become more pronounced by the end of Q3.
● The Ripple (XRP) token is also showing a bullish signal. Technical indicators point to an inverted "Head and Shoulders" pattern on the daily chart of the altcoin, with the second shoulder still in the process of forming. Since the court ruling in the SEC (U.S. Securities and Exchange Commission) case against Ripple, XRP has been correlating with major cryptocurrencies like bitcoin, Ethereum, and Solana. Bouncing off the $0.55 support level, it has traded in a narrow sideways trend along with these mentioned assets following a 50% drop after the court decision.
As analysts have observed, Ripple has recently begun forming the second shoulder in this bullish pattern, with a potential risk-to-reward ratio of 1:2. This formation suggests that XRP could be poised for a significant upward move if the pattern completes as expected.
NordFX Analytical Group
Disclaimer: These materials are not an investment recommendation or a guide for working on financial markets and are for informational purposes only. Trading on financial markets is risky and can lead to a complete loss of deposited funds.
#eurusd #gbpusd #usdjpy #forex #forex_forecast #nordfx #cryptocurrencies #bitcoin


")