
Forex and Cryptocurrency Forecast for August 19 – 23, 2024


EUR/USD: Wall Street Triumphs Over the Dollar
● The Dollar Index (DXY) fell throughout the beginning of the week, while the EUR/USD pair rose. This was due to the after-effects of the "Grey Friday" on August 2 and the "Black Monday" on August 5, which we covered in detail in our previous review. The EUR/USD pair reached a local high of 1.1046 after the release of the US Consumer Price Index (CPI) for July on Wednesday, August 14. The data showed that annual inflation had fallen to 2.9%, below both the previous reading and the forecast of 3.0%. The Core Consumer Price Index (Core CPI), which excludes volatile food and energy prices, rose by 3.2% year-on-year in July compared to 3.3% in June.
● This decrease in inflationary pressure, despite the CPI still being above the Fed's target level of 2.0%, has strengthened the argument that the regulator may lower interest rates at its September meeting. Analysts had already considered such a move highly likely, given other indicators pointing to a slowdown in the US economy. Among these indicators are the lowest Manufacturing Business Activity Index in eight months and the rise in unemployment to 4.3%. According to strategists at Principal Asset Management, the current CPI data "eliminate any obstacles related to persistent inflation that could have prevented the Fed from beginning a rate-cutting cycle in September."
(Remember that the Federal Reserve started raising interest rates to combat inflation, which reached 9.1% in July 2022, a record high in many decades. As a result of this tightening (QT), after a year, in July 2023, the rate reached a 23-year high of 5.50%, where it remains to this day).
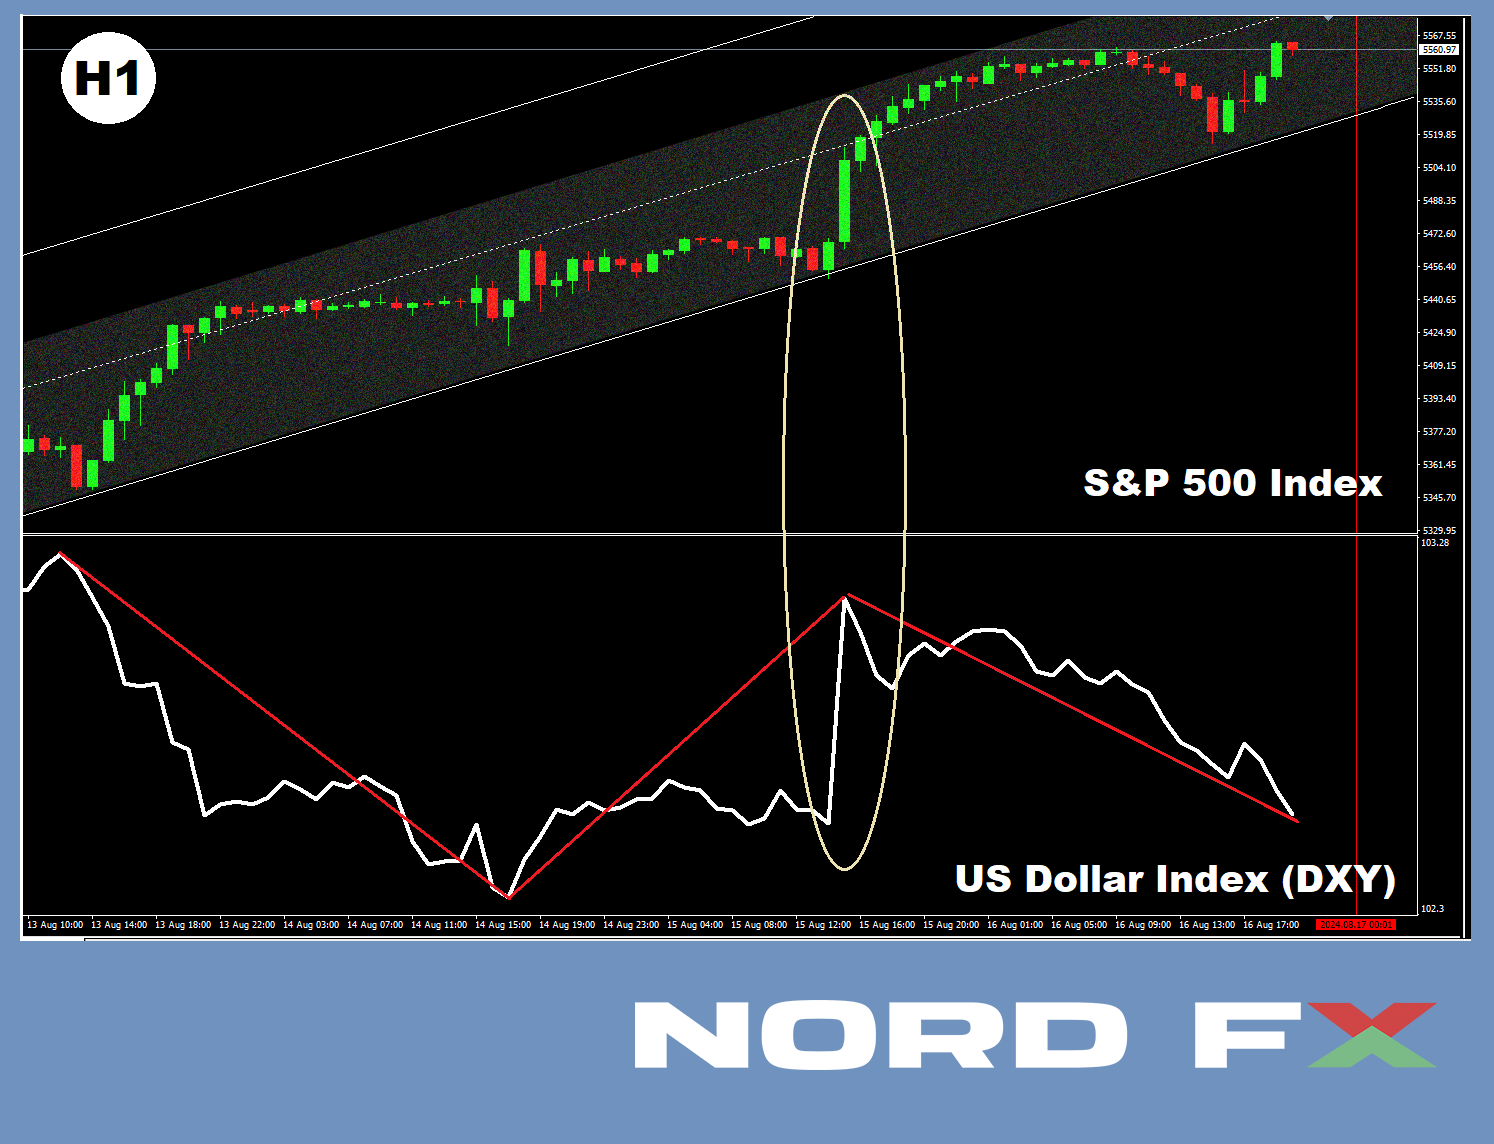
After the release of inflation data on August 14, stock indices (S&P500, Dow Jones, Nasdaq) rose. The DXY reached a minimum but then slightly strengthened, as the CPI figures were far from radically changing the situation.
● Thursday, August 15, brought another batch of important data from the US. After declining by -0.2% in June, retail sales in July exceeded the forecast of 0.3% and rose by 1.0%. This marked the fastest growth since the beginning of 2023. Market participants also closely monitored the US labour market data following the disappointing figures of "Black Friday." This time, the data was positive: initial jobless claims for the week amounted to 227K, which was lower than both the previous figure of 234K and the forecast of 236K. Additionally, the world's largest retailer, Walmart, reported increased revenue and raised its profit forecast.
Weak consumer spending typically leads to layoffs and higher unemployment, which reduces people's ability to spend. In contrast, the growth in retail sales and Walmart's performance indicate a revival in the consumer market. Yes, the US economy's growth is still slowing, but fears of a recession, if not entirely gone, have at least significantly diminished.
These news events, on the one hand, dispelled the spectre of a recession but, on the other, reinforced confidence in a Fed rate cut in September. As a result, the DXY rose alongside Wall Street stock prices. It is quite rare for a safe-haven asset to rise in parallel with investor risk appetites, but that's exactly what happened this time. However, it was the stock indices that held back the dollar's bull rally, preventing it from strengthening further. In the end, the pressure on the dollar from the stock exchanges was so strong that the EUR/USD pair turned north and ended the week at 1.1027.
● According to forecasts, the Fed is expected to lower interest rates by a total of 95-100 basis points (bps) by the end of the year. Currently, the US Central Bank is inclined to cut the rate by 25 bps in September. However, if the August labour market report disappoints traders again, the FOMC (Federal Open Market Committee) may be forced to lower the rate by 50 bps at once—from 5.50% to 5.00%, which could significantly weaken the US dollar's position.
As of the evening of August 16, at the time of writing this review, 60% of analysts favoured the dollar's strengthening and the pair's movement to the south, while 40% supported the euro's strengthening. In technical analysis, all 100% of trend indicators and oscillators on the D1 chart point to the north, although 20% of the latter are in the overbought zone. The nearest support for the pair is located in the 1.0985 zone, followed by 1.0950, 1.0890-1.0910, 1.0825, 1.0775-1.0805, 1.0725, 1.0665-1.0680, and 1.0600-1.0620. Resistance zones are found in the areas of 1.1045, 1.1100-1.1140, 1.1240-1.1275, 1.1350, and 1.1480-1.1505.
● In the upcoming week, on Tuesday, August 20, the Eurozone inflation figures (CPI) will be released. The following day, the minutes of the latest FOMC meeting will be published. On Thursday, August 22, business activity indicators (PMI) will be released for various sectors of the German economy, the Eurozone as a whole, and the United States. Additionally, the traditional weekly statistics on initial jobless claims in the United States will be published on that day. Also on Thursday, the Annual Economic Symposium in Jackson Hole (USA) will commence, running through Saturday. This important event, dedicated to monetary policy issues, has been held since 1981 and brings together Central Bank leaders and leading economists from many countries around the world.

GBP/USD: The British Pound Gains Strength
● The dynamics of the GBP/USD pair were naturally influenced not only by macroeconomic statistics from the US but also by economic data coming out of the UK. Last week saw a considerable amount of such data.
The acceleration of the pound's growth occurred against the backdrop of strong unemployment figures from the UK, which exceeded expectations. On Tuesday, August 13, it was revealed that the unemployment rate fell in June, reaching 4.2%. This represents a significant improvement compared to May, when the rate was 4.4%. Given that the forecast predicted a rate of 4.5%, this data made a strong impression on the market. Such a decrease in unemployment indicates positive changes in the labour market and could be a sign of economic stabilization, contributing to increased investments.
● The following day, on Wednesday, August 14, consumer inflation data was released. The Office for National Statistics reported that the CPI rose for the first time this year to 2.2% year-on-year. This increase followed two consecutive months of remaining at the Bank of England's (BoE) target level of 2.0%. Although the result was slightly below the forecast of 2.3%, the pound experienced only a minor and brief decline against the dollar, as markets raised the probability of a 25 bps rate cut by the BoE in September from 36% to 44%.
It is worth noting that inflation in the UK reached a 41-year high of 11.1% in October 2022. This was driven by a sharp rise in energy and food prices following Russia's invasion of Ukraine, as well as labour shortages due to COVID-19 and supply chain disruptions. However, thanks to a well-thought-out monetary policy, price pressures were significantly reduced, and consumer inflation in the UK is now lower than in the Eurozone and the US. However, the Bank of England expects the CPI to rise, reaching approximately 2.75% by the end of the year, as the impact of the sharp drop in energy prices in 2023 fades. According to BoE economists, the CPI is expected to return to the target of 2.0% only in the first half of 2026.
According to some experts, much (if not all) of the GBP/USD pair's behaviour will depend on the pace of monetary policy easing by the Fed and the BoE. If the US interest rate is lowered aggressively while the Bank of England delays similar measures until the end of 2024, the bulls on the pound may have a good opportunity to push the pair towards the 1.3000 level.
● On Thursday, August 15, the British currency continued to strengthen following the release of strong GDP data. The UK's Office for National Statistics (ONS) reported that the economy grew by 0.6% quarter-on-quarter in the second quarter. On an annual basis, growth reached 0.9% compared to 0.3% in the previous quarter. According to analysts, these figures confirm the trend of the country's economic recovery after the recession, despite the impact of widespread strikes and poor weather, which slowed consumption in June.
● The GBP/USD pair closed the week at 1.2944. Economists at Scotiabank expect further growth towards the 1.2950-1.3000 range. As for the average forecast, 30% of experts support Scotiabank’s view, 50% anticipate a strengthening of the dollar and a decline in the pair, while the remaining 20% remain neutral.
Regarding technical analysis on the D1 chart, similar to the EUR/USD situation, all 100% of trend indicators and oscillators point to the north (with 15% of the latter indicating overbought conditions). In case the pair falls, it will encounter support levels and zones around 1.2900, followed by 1.2850, 1.2795-1.2815, 1.2750, 1.2665-1.2675, 1.2610-1.2620, 1.2500-1.2550, 1.2445-1.2465, 1.2405, and 1.2300-1.2330. If the pair rises, it will face resistance at 1.2980-1.3010, followed by 1.3040, 1.3100-1.3140, 1.3305, and 1.3425.
● In the upcoming week, the calendar highlights Thursday, August 22, when, along with business activity data from the Eurozone and the US, similar PMI figures from S&P Global for the UK will be published. At the very end of the workweek, on Friday, August 23, a speech by the Governor of the Bank of England, Andrew Bailey, is expected.

USD/JPY: A Very Quiet Week
● The past week was surprisingly calm for the USD/JPY pair. Some activity was observed with the release of several Japanese economic indicators on Thursday, August 15. According to preliminary data, the country's economy grew by +0.8% in Q2 (market expectations were +0.5%). This was a significant improvement, as GDP had declined by -0.6% in Q1 2024. Similarly, in annual terms, GDP growth reached +3.1% after a contraction of -2.3% in the previous quarter.
Consumer spending rose for the first time in five quarters, increasing by 1.0% in April-June. This was driven by an increase in average wages in the country by more than 5% following spring negotiations between companies and trade unions, marking the largest increase in over 30 years.
● After the release of this data, the USD/JPY pair showed a slight increase, but then retraced downward, ending the workweek at 147.60. The analysts' forecast for the near term is as follows: one-third expect the pair to move upward, one-third anticipate a decline, and the remaining third have taken a neutral stance. Among trend indicators on the D1 chart, 75% are coloured red, and 25% are green. Among oscillators, 50% align with the red, 25% with the green, and the remaining 25% are in neutral grey.
The nearest support level is in the 146.55-146.90 zone, followed by 145.39, 143.75-144.05, 141.70-142.15, 140.25-140.60, 138.40-138.75, 138.05, 137.20, 135.35, 133.75, 130.65, and 129.60. The nearest resistance is located in the 148.20 zone, followed by 149.35, 150.00, 150.85, 151.95, 153.15, 154.20, then 154.85-155.20, 156.80-157.20, 157.70-158.25, 158.75-159.00, 160.20, 160.85, and 161.80-162.00, with further resistance at 162.50.
● No significant events or macroeconomic data releases related to the state of the Japanese economy are scheduled for the upcoming week.

CRYPTOCURRENCIES: Bitcoin's Snake Trend
● Unlike the first ten days of August, the past week was relatively calm. Bitcoin, of course, continued to react to US macroeconomic data, but unlike stock indices and the dollar, the reaction of the leading crypto asset was rather muted. The BTC/USD pair moved in a narrow sideways channel, slightly undulating between resistance at $62,000 and support at $58,000. (Two timid attempts to break below this support don't really count).
● According to analysts, at the current price of bitcoin, many public mining companies are in a difficult financial position. This is due to both the increased complexity of computations and the drop in revenues following the halving. Miners faced another blow on the last day of July. It is important to note that the mining difficulty is adjusted every two weeks based on the total power of the mining equipment in use. This adjustment is necessary to maintain the block mining speed at roughly one every 10 minutes. On July 31, the difficulty increased by 10.5%—the largest jump since October 2022.
As a result, according to Ki Young Ju, CEO of the analytical firm CryptoQuant, the average cost of mining one bitcoin is currently around $43,000. While this figure is lower than the current price of BTC, it does not take into account the repayment of loans previously taken out for the construction of data centres and the purchase of equipment, as well as various overhead and administrative expenses.
Experts at TheMinerMag, based on financial reports for Q2, calculated the total cost of the coins mined in July for leading mining companies. It turns out that companies like Marathon Digital and Riot are operating at a loss. However, they continue to accumulate digital gold reserves, betting on its future price increase.
● It's worth noting that Marathon Digital is currently the largest miner in the world, with a market capitalization of $4.44 billion. According to company representatives, Marathon views bitcoin as its "primary strategic treasury asset." In addition to mining, Marathon is also increasing its reserves by "applying a multifaceted strategy for purchasing bitcoins." Just recently, the company bought additional digital gold worth $249 million, issuing bonds maturing in 2031 to finance the purchase. The average purchase price was around $59,500 per coin, bringing Marathon's total holdings to over 25,000 BTC (approximately $1.48 billion). This significant investment reflects the company's confidence in the continued price growth of the leading cryptocurrency.
● Another major player exuding confidence is MicroStrategy, which has announced the potential addition of up to $2 billion to its already massive bitcoin portfolio. According to the company's financial report, in the second quarter, it acquired 12,222 BTC for $805.2 million, bringing its total bitcoin holdings to 226,500 coins (worth more than $13 billion at current prices).
Over the past four years, MicroStrategy has invested approximately $8.4 billion in BTC, yielding a profit of more than $5 billion. As a result, the company's stock price has increased by 995% since 2020. Interestingly, Arkham has even created a dedicated portal to track MicroStrategy's bitcoin purchases. The potential injection of another $2 billion into BTC will undoubtedly attract significant attention from market participants.
● Data from the analytics firm Glassnode also confirms that large investors have shifted towards long-term accumulation of bitcoins. The Accumulation Trend Score (ATS) metric, which evaluates changes in market balances, has recorded the highest possible value of 1.0. This indicates significant bitcoin accumulation in recent times. Previously, PitchBook reported that venture capital investments in the crypto industry increased by 2.5% from April to June, marking the third consecutive quarter of positive capital inflows.
● According to experts at Santiment, renewed market excitement could push bitcoin back to the $70,000 zone, with a subsequent achievement of a new all-time high at $75,000 in the short term. The analyst known as TheScalpingPro also believes that despite the recent dip, bitcoin is capable of a bullish rally. In his view, the leading cryptocurrency is forming a classic parabolic curve, often associated with a strong upward momentum. This curve suggests that within a 6-12 month horizon, BTC could experience rapid growth with a potential target of around $180,000, followed by a sharp correction.
Another analyst, TheMoonCarl, suggests that a decisive breakout and consolidation above the $60,000 resistance could lead to a rise to $125,000. This forecast is based on the formation of a "cup and handle" pattern. TheMoonCarl cited BTC's price movement in 2021 as an example, noting that if bitcoin reaches the $70,000 level, the next target could be $125,000.
● CryptoQuant holds a different view, believing that in the short term, bitcoin does not show signs of recovery. The high volatility of cryptocurrencies, the decline in stocks of leading technology companies associated with artificial intelligence, such as Nvidia, Google, and Microsoft, combined with rising geopolitical tensions, are pushing investors to seek safer investments, such as physical gold. On Wednesday, August 13, the price of gold reached another all-time high of $2,477, and according to some experts, this precious metal has a strong chance of rising to $3,000 by the end of the year.
● Long-term forecasts for bitcoin remain extremely impressive, ranging from total collapse to soaring to the Moon and beyond—to the edges of the Solar System. For instance, the digital asset management company VanEck has released a new forecast that outlines three potential price levels for BTC, depending on market development and the global adoption of bitcoin as a reserve asset. According to the base scenario, by 2050, the flagship cryptocurrency could reach $3 million per coin. In the bearish scenario, the minimum value of BTC would be $130,314. However, if VanEck's bullish scenario comes to pass, in 26 years, one bitcoin could be worth $52.4 million, nearly 900 times more than its current value.
● Unfortunately, as of the evening of Friday, August 16, at the time of writing this review, the BTC/USD pair has yet to reach $50 million or even $3 million and is trading at $59,300. The total cryptocurrency market capitalization stands at $2.08 trillion (down from $2.11 trillion a week ago). The Crypto Fear & Greed Index has dropped from 48 to 27 points, shifting from the Neutral zone into the Fear zone.
● In conclusion, a few words about… copyrights. This is precisely what we want to secure for ourselves. Let us explain. Everyone knows that an upward trend is called bullish, and a downward trend is bearish. But what do we call a sideways trend? No name? Now, take a look at the BTC/USD chart from this week: does it remind you of anything? Yes, it’s like a snake slithering and winding along the ground. This is why we propose calling the sideways trend from now on the "Snake Trend," and we officially request that the authorship of this term be attributed to us.
NordFX Analytical Group
Disclaimer: These materials are not an investment recommendation or a guide for working on financial markets and are for informational purposes only. Trading on financial markets is risky and can lead to a complete loss of deposited funds.
#eurusd #gbpusd #usdjpy #forex #forex_forecast #nordfx #cryptocurrencies #bitcoin


