EURUSD - Next Week Ready for Long- TRADING WITH WEIS WAVE WITH SPEED INDEX

Setup : 1Hour Chart Indicators: Weis Pip Wave, Weis Wave with Alert (+Speed Index) and No Demand No Supply ( https://www.mql5.com/en/users/takisd/seller)
Our Story: This is a long story and it is a continuation of a previous post https://www.mql5.com/en/blogs/post/736377
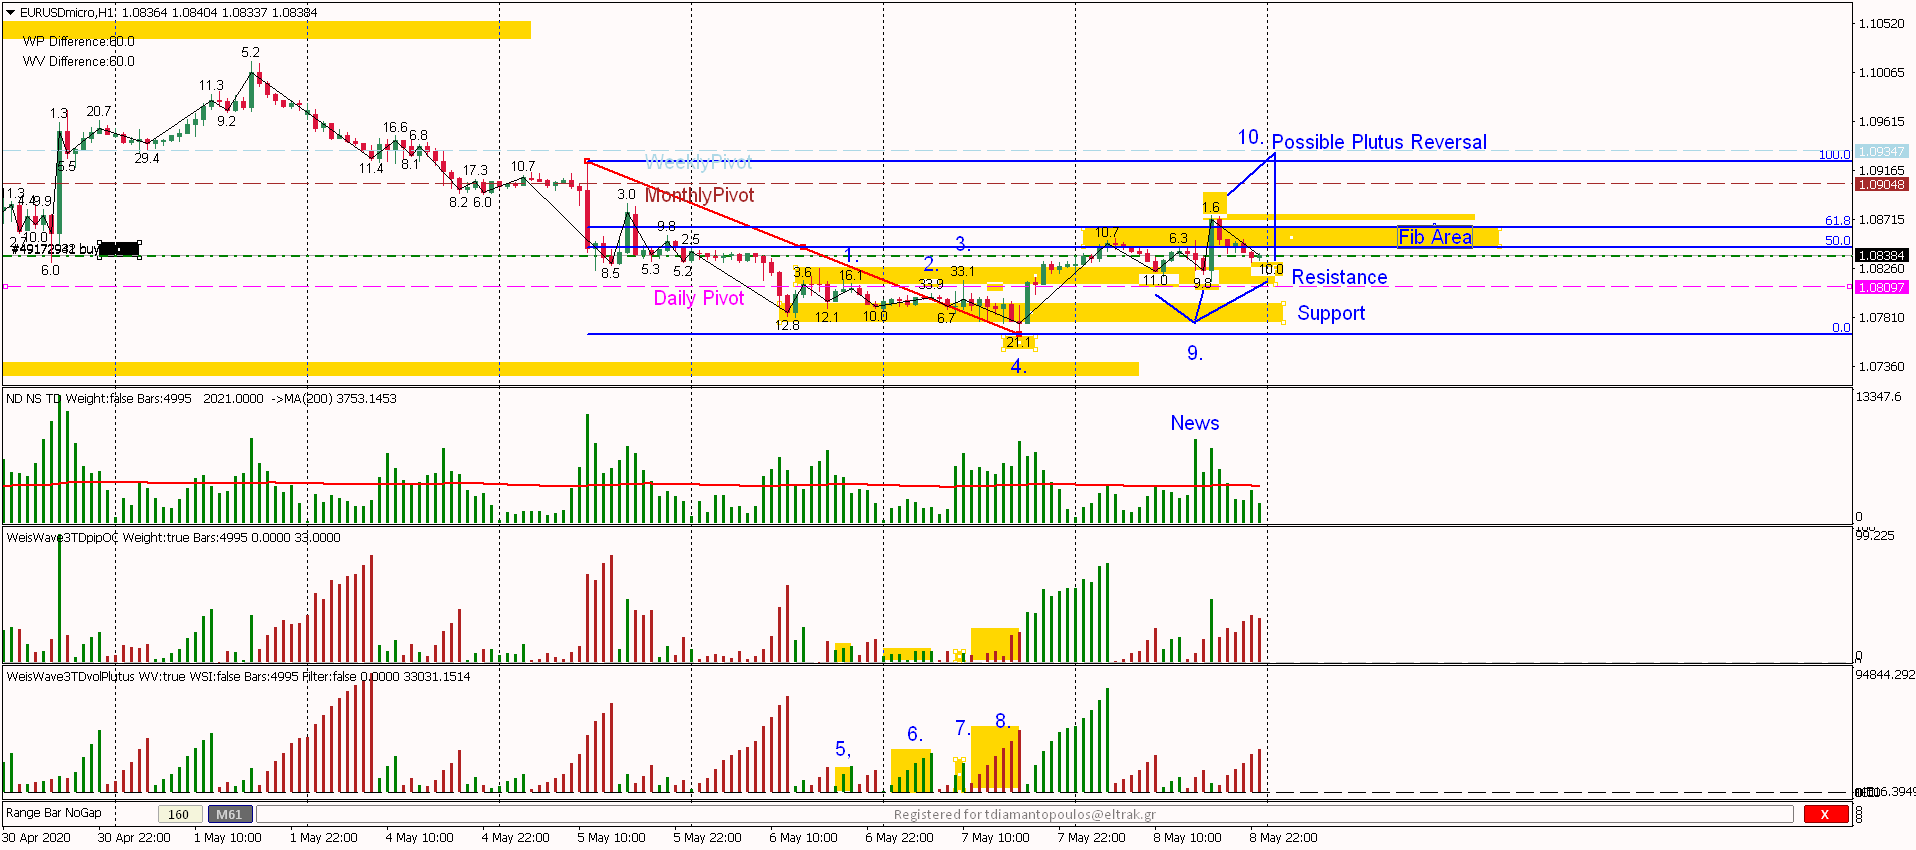
1. and 5. This is where buying started with that 16.1 SI and that volume wave at the bottom
2. and 6. More buying SI 33.9
3. and 7. More buying SI 33.1
4. and 8. More buying but now on the way down SI 21.1 - nice false break of Support and then start moving up
Then we broke Resistance Level and this is where I got in Long (order visisble on chart).
9. Retraced back to Resistance after hitting the Fib but the bottom SIs (11.0, 9.8 and 10.0 still forming) are Higher than the top SIs (10.0, 6.3 ,1.6) which means hard time to move down
Some sellers showed up at that 1.6 SI
10. Finally a possible Plutus Reversal Long pattern might be forming. (SIs 1.6 and 10.0 still forming)
Considering all the backround the above the forecast is Long for next week (Monday or Tuesday) the only question mark is are these sellers at that 1.6 SI but most probably this could be closing positioning since it was Friday.