This is the first episode of a blog series on how to use the „Netsrac SR Dashboard“ to find trading opportunities. The SR Dashboard is designed to reduce your time in front of the monitor. It can find many setups for us. All we have to do is trade those setups.
I have been asked by some people how to operate the dashboard correctly. That's why I want to start this blog series. We will cover the following topics:
- Using the "Netsrac SR Dashboard" (quick guide)
- Trading Pinbars
- Quick Set-Gets with the Dashboard
- Trade the Engulfing Pattern
- Weekly pivot as potential reversal points
- Scalping the short term trend
- Trend trading with important moving averages
- Volatility outbreak
- ... (may continue)
What do we need? We need the SR Dashboard - which you can find here in full version. Or you can use the free but limited version here.
Trading PinBars
Let's take a look at what we are looking for.
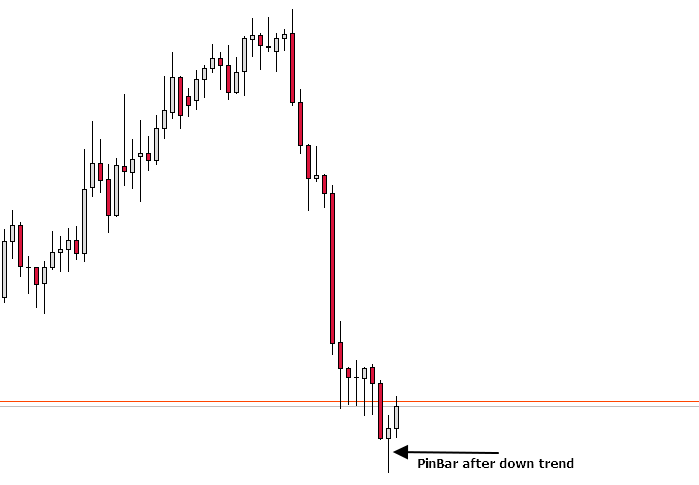
We do not want to make it too complicated. So we keep off things like support&resistance or moving averages. We want to find the "PinBar after the Trend" with our Dashboard. So let´s ...
Setup "Netsrac SR Dashboard"
We need the sections TREND and PRICE ACTION / CANDLESTICKPATTERN. So choose "true" there.
![]()
![]()
We dont need the other sections (ADR, MOVING AVERAGES and PIVOT LEVEL). Choose "false" there.
![]()
![]()
![]()
![]()
![]()
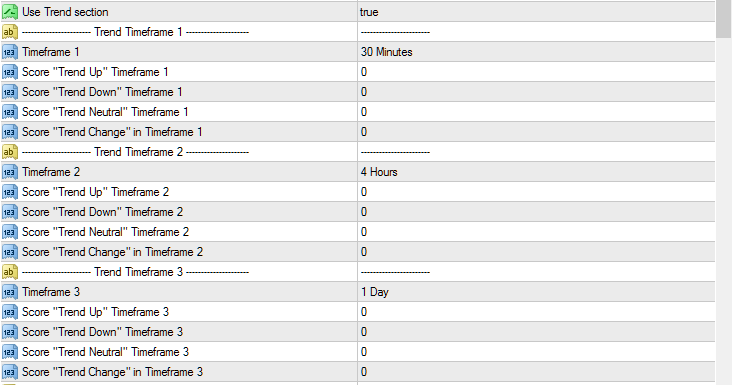
Setting timeframes in the trend section
In this case, we trade M30 (short term), H4 (mid term) and D1 (long term). So let´s set these timeframes in Trend-Section:
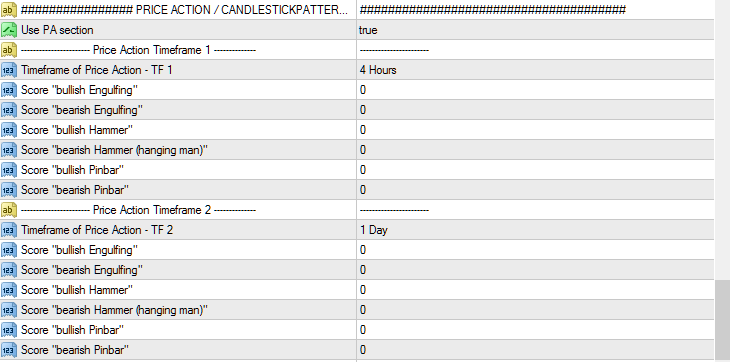
Setting timeframe for PRICE ACTION / CANDLESTICKPATTERN
We want to find PinBars in our mid-term timeframe H4. So let´s choose "4 Hours" for our "TF1". (The second time frame "TF2" does not interest us right now.)
Setting Scores for PinBars
What comes next may sound a bit complicated, but if you get familiar with the principle, you will love it. Take a look at the picture below. We have set the Scores for bullish and bearish Pinbar in Timeframe 1 (H4).
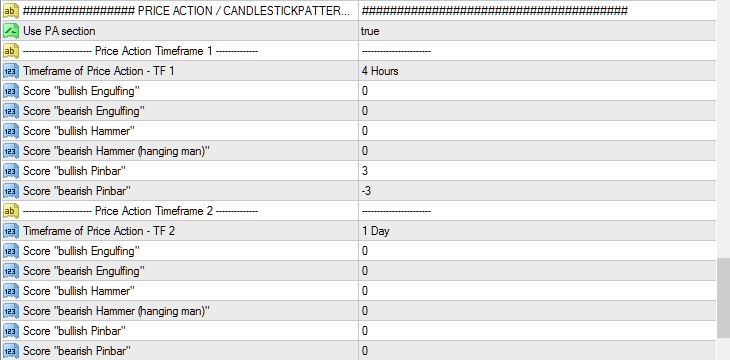
What do these settings mean? It is easy:
- if the dashboard was found a "bullish Pinbar": Add +3 to the overall score
- if a "bearish Pinbar" was found: Add -3 to the overall score
For each condition that can be found with the dashboard, we can give a "score". This "score" can have a value from -3 to +3. For example, if a condition was found that has a score of +2 and another condition was found that has a score of +3 - then we have a total score of +5. Now you can configure thresholds for an alert, one for a negative "setup-value" and one for positive "setup-value".
It is very important that you understand this concept! Feel free to contact me, if you have trouble to understand it!
Setting Scores for Trend
We are searching pinbars in trends. So let's rate trends because it is an entry criterion. For now, we are only interested in the mid- and long-term timeframe. Take a look at the picture below.
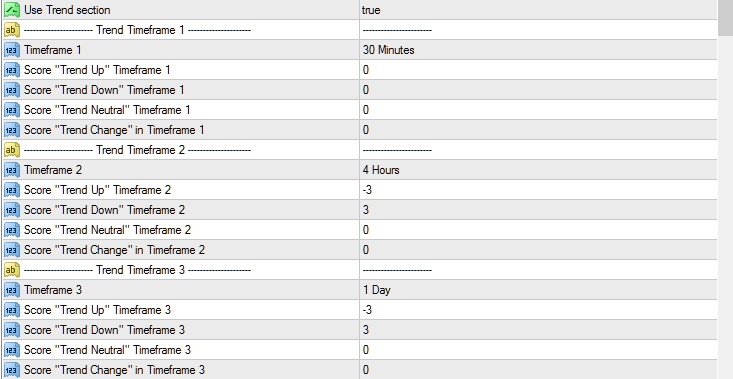
What do these settings mean? It´s easy:
- A downtrend in H4 : +3
- An uptrend in H4: -3
- No trend in H4: 0
- A downtrend in H4 AND D1: +6
- An uptrend in H4 AND D1: -6
- A downtrend in H4 and Uptrend in D1: 0
- ... and so on
Got it?
Put it all together
Here are a few examples, which values the (overall-)score can reach:
- A Downtrend in H4 AND bullish Pinbar (no setup!): +3 +3 = +6
- An Uptrend in H4 AND Uptrend in D1 AND bullish PinBar (no Setup!): -3 -3 +3 = -3
- A downtrend in H4 AND Downtrend in D1 AND bullish PinBar (Bingo, it´s a setup!): +3 +3 +3 = +9
- An uptrend in H4 AND Uptrend in D1 AND bearish PinBar (Bingo, it´s a setup!): -3 -3 -3 = -9
What is the conclusion? We have a bullish setup if the overall score is +9. We have a bearish setup if the overall score is -9. The dashboard should inform us if there is a bearish or bullish setup. So we have to set alerts.:
Setting Alert
We would rather spend our time with the family than in front of the monitor. So we use alerts.

We enter 9 and -9 as alert thresholds. The option "Text-prefix in alerts" is helpful, if you have more than one instance of the dashboard. So you can distinguish the different messages.
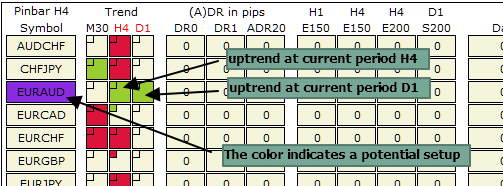
In this case, the dashboard has found a setup. We´ve got an Alert (and a message on the smartphone), that we have a potential setup at EURAUD. Let´s klick at EURAUD and see the chart.
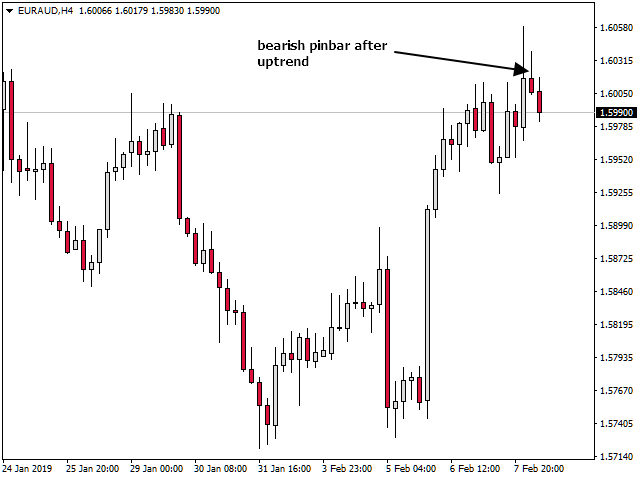
With the SR Dashboard, you always receive the alerts immediately after a pattern is complete (at open of current candle).
This is what the dashboard shows:

Attached you will find a set file so you can start right away.
Get the full version: https://www.mql5.com/en/market/product/34855
Get the lite version: https://www.mql5.com/en/market/product/34863
Good Luck and green pips to you!


![[$9,496] in 5 Days Using 'Supply Demand EA ProBot' (Live Results) [$9,496] in 5 Days Using 'Supply Demand EA ProBot' (Live Results)](https://c.mql5.com/6/965/splash-preview-761070-1740062258.png)