

This is the fourth episode of a blog series on how to use the „Netsrac SR Dashboard" (SRD) to find trading opportunities. The SRD is designed to reduce your time in front of the monitor. It can find many setups for us. All we have to do is trade those setups.
I have been asked by some people how to operate the dashboard correctly. That's why I want to start this blog series. We will cover the following topics:
- Using the "Netsrac SR Dashboard" (quick guide)
- Trading Pinbars
- Quick Shots with the Dashboard
- Trading the Engulfing Pattern
- Weekly pivot as potential reversal points
- Scalping the short term trend
- Trend trading with important moving averages
- Volatility outbreak
- ... (may continue)
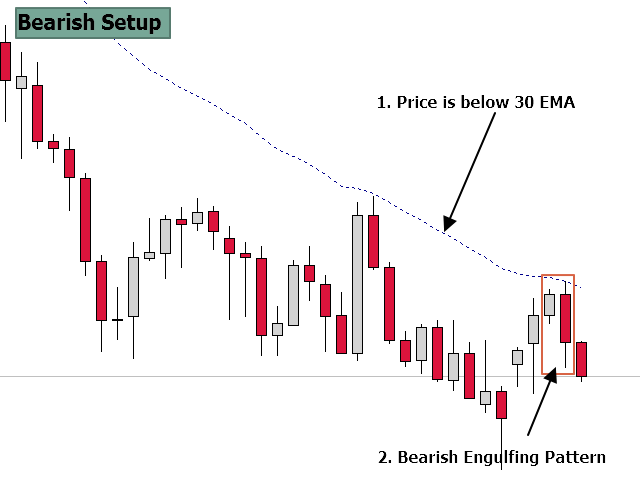
We want to trade with the trend. So we are trend traders. To find out, if we were in a trend, we are using the EMA 30. Now we are looking for a pattern, which has an engulfing candle. An engulfing candle is one, who engulfs the previous candle. Take a look at the next picture to see a bearish engulfing pattern. If we see a bearish engulfing, we expect a drop. We use the H4-timeframe.

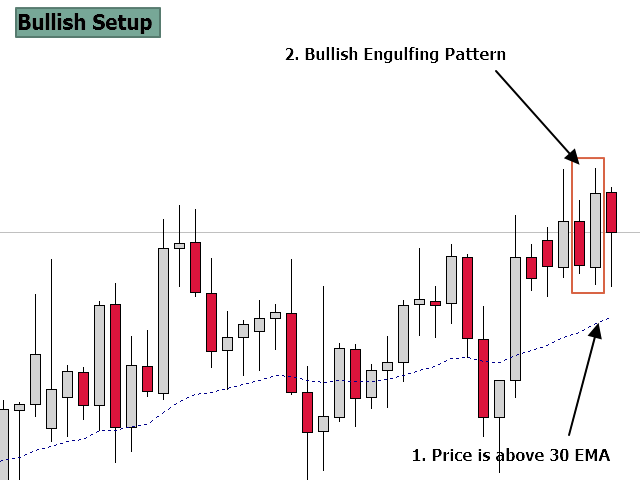
- We want to monitor the Moving Average 30 EMA. So we use the section "MOVING AVERAGES".
- We are looking for bullish or bearish Engulfing. So we use the section "PRICE ACTION / CANDLESTICKPATTERN"
| Variable in SR Dashboard-Options | Value |
|---|---|
| Use Trend section | false |
| Use (A)DR section | false |
| Use RSI section | false |
| Use Moving Average section | true |
| Use Pivot section | false |
| Use High/Low section | false |
| Use PA section | true |
Setting Moving Average
These are the settings in this section:
| Variable in SR Dashboard-Options | Value |
|---|---|
| Timeframe of MA 1 | 4 Hours |
| Mode MA 1 | Exponential |
| Period MA 1 | 30 |
| Score if price is below MA 1 | -3 |
| Score if price is above MA 1 | 3 |
Setting Price Action / Candlestickpattern
These are the settings in this section:
| Variable in SR Dashboard-Options | Value |
|---|---|
| Timeframe of Price Action - TF 1 | 4 Hours |
| Score "bullish Engulfing" | 3 |
| Score "bearish Engulfing" | -3 |
Now at last the settings for the alert:
| Variable in SR Dashboard-Options | Value |
|---|---|
| Alert, if score is greater or equal to ... | 6 |
| Alert, if score is smaller or equal to ... | -6 |
| Use Screen-Alert | true |
With this settings, we get a Screen-Alert, when a bullish setup occured (Score 6). And we get an alert, when a bearish setup occured (Score -6).
Let's take a look at our dashboard now:
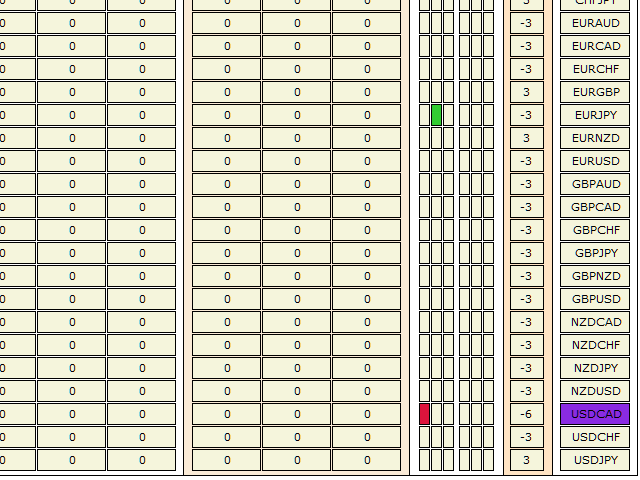
In this case, we have a bearish setup in USDCAD. Klick on "USDCAD", and plan your trade.
That's all. Now we have configured our SR Dashboard to find Engulfing Pattern in Relation to an EMA 30. Please find the setfile in the attachements.
Get the full version: https://www.mql5.com/en/market/product/34855
Get the lite version: https://www.mql5.com/en/market/product/34863
Good Luck and green pips to you!


