
EURUSD Intra-Day Technical Analysis - ranging for correction
28 July 2015, 10:37

2
1 125
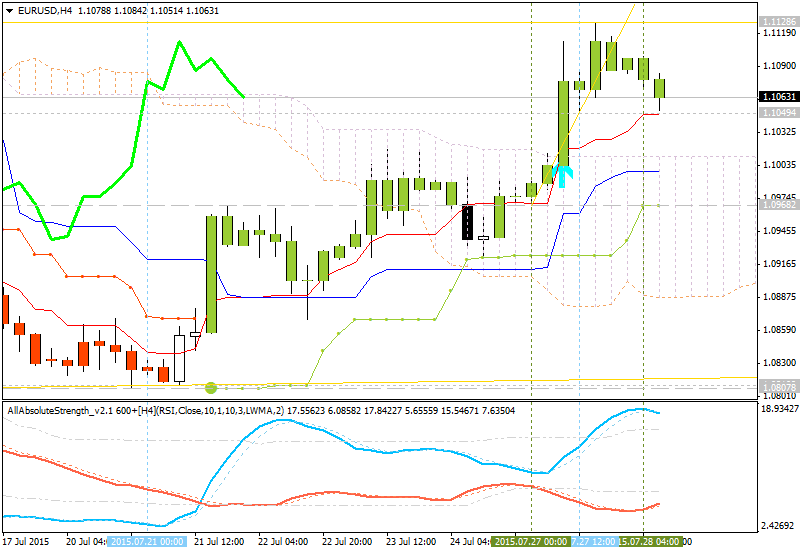
H4 price is on primary bullish market condition with secondary ranging between 1.1128 resistance and 1.1049 support levels which are located above Ichimoku cloud and far above Senkou Span A line which is the virtual border between the primary bullish and the primary bearish on the chart.
- Chinkou Span line is above the price indicating the local downtrend by direction as the secondary correction to be started in the near future.
- price is ranging between 1.1128 resistance and 1.1049 support levels;
- next target in case of the secondary correction to be started is 1.0968.
| Resistance | Support |
|---|---|
| 1.1128 | 1.1049 |
| N/A | 1.0968 |
If H4 price will break 1.1128 resistance level so the bullish trend will be continuing.
If not so the price will be ranging between 1.1128 and 1.1049 levels with primary bearish
- Recommendation for long: watch close H4 price to break 1.1128 for possible buy trade
- Recommendation
to go short: watch H4 price to break 1.1049 support level for possible sell trade
- Trading Summary: ranging
SUMMARY : bullish


