How to Build a Strategy - traders should look to match their strategy with the appropriate market condition

When utilizing multiple time frame analysis with a trend-trading
strategy, traders are often going to look to the longer time frame to
find and diagnose the strength of the trend. This can be done in a
multitude of ways. Some traders will prefer to do this without any
indicators at all, using price and price alone.
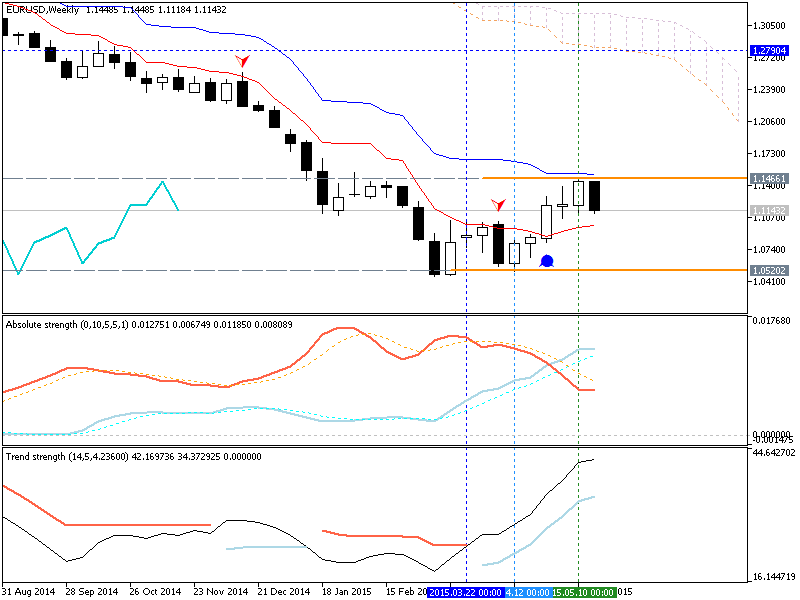
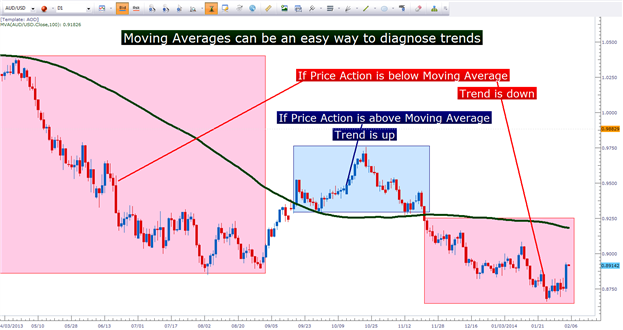
Other traders will look to one of the more common indicators, the moving average. There are a lot of different flavors and types of moving averages, but the goal is all the same – to show us a ‘line-in-the-sand’ as to whether price movements are ‘above-average’ or ‘below-average’ for a given period of time.
After the trend has been recognized so the trader can then plot the entry
into the position; and for that, there are a multitude of options
available.
Entering into the Trend
There is an old saying that goes: ‘The Trend is your friend until it ends.’
This one line pretty much sums up the quandary that traders are faced
with when trading trends. While a bias has been exhibited in the
marketplace, and may continue; there is no such thing as a ‘sure-fire
trend continuation setup.’ So, when the trend doesn’t continue, the trader is often advised to look
to mitigate the loss so that a reversal doesn’t damage their trading
account too badly. In an effort to be as precise as possible, many traders will move down
to a lower time frame in an effort to get a more detailed look at the
move inside of the larger-term trend.