

Get the product here:
https://www.mql5.com/en/market/product/124185/
This is a slope indicator for Bollinger Bands indicator. It provides slopes for BB top band, center band (main) and Lower Band.
You can also set a threshold value for Center line to control Red/Green slope histogram lines.
Here's what the indicator look like:
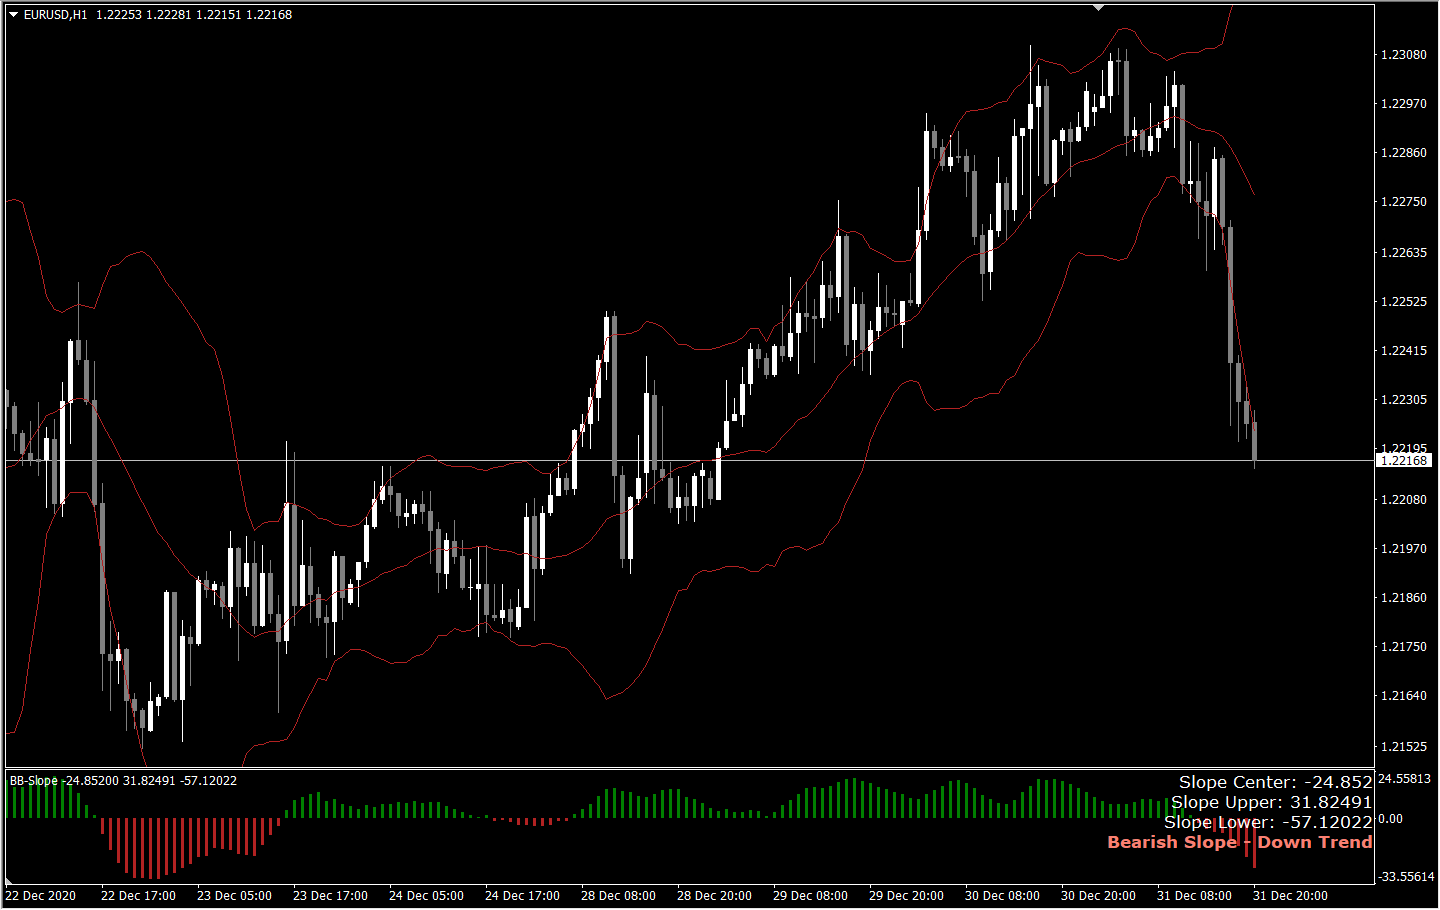
Slope Threshold: for indicating crossed levels. In the above Image the Threshold is set to 0, because of that all Bullish slope is Green and Bearish is Red.
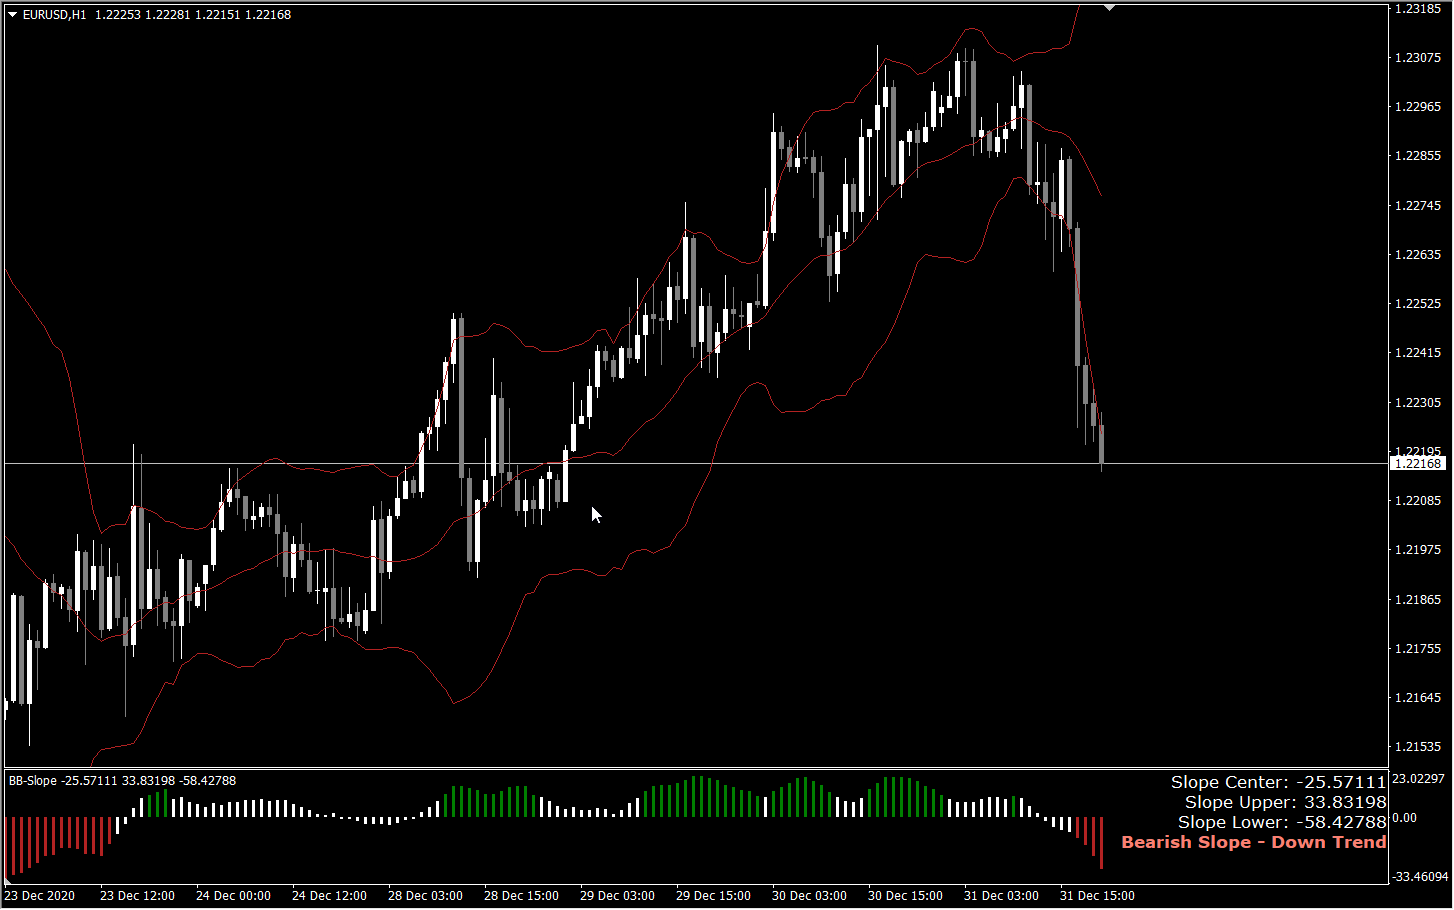
Suppose we set Threshold to -10 and 10, then this is what we get:
Buffers: values for specified bars back.
Buffer 6: BB Center Slope
Buffer 7: BB Upper Slope
Buffer 8: BB Lower Slope

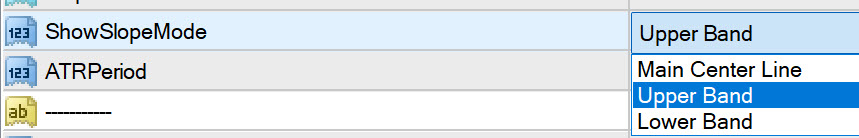
You can choose which line you need the slope and Threshold Alerts for in Drop down.
Alerts: when slope changes. They only happen when Threshold is crossed. e.g.: If Threshold is 10, -10 and if slope goes from say 9... to above 10.
And can be Popups, Push Notifications, Email or in a File.
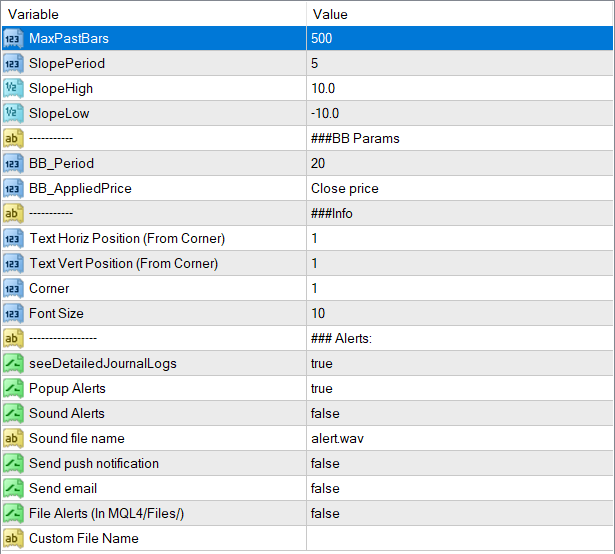
Slope Period: Default is 5, which means it will measure the line values for past 5 bars and find the Slope based on time for past 5 bars.
What slope means:
Center Slope:
This slope indicates whether price is trending up or down
Upper/Lower Slopes:
These can be used to calculate volatility. Whether bands are closing or opening up.
In Bollinger bands, if bands are opening up, means trend is picking up and volatility is increasing. So it's good to trade.
Bands coming together, meaning upper band going down or lower band coming up, then consolidation period. So wait and don't trade yet.
Best Use:
Use this slope indicator to supplement your existing Bollinger Bands strategy.
Or use the buffer values with an EA to figure out the ongoing trends and consolidations.


