
MQL5 Wizard Techniques you should know (Part 44): Average True Range (ATR) technical indicator
Introduction
The Average True Range is a common and popular volatility indicator, which arguably, for forex traders, is the ‘closest-thing’ to volume data. Developed as an indicator which was meant to track price bar range without skimping on intra-bar price changes, it has become a bit of a stalwart in the industry not just for filtering entry signals but also in guiding on position sizing. We look at this indicator by decomposing it into possible patterns as we have been doing with the previous indicator’s articles with perhaps the main difference being we look into patterns outside of the custom signal class by also considering the custom money management class for wizard assembled Expert Advisors.
Before we get into that though, we will wrap up the indicator we had started last, the ADX.
ADX Reversal
Pattern 6 for the ADX is the reversal that is characterized by a drop in the main buffer of the ADX at the end of a prominent trend. To do a brief recap on the ADX, it measures the strength of a trend, with spikes or rises in the main buffer of the oscillator indicating strength of the prevalent trend. In addition, there are 2 extra buffers, the DI+, and DI- that also quantify the strength of price rises and price falls respectively.
So, a bullish signal is marked by a strong bearish trend that has been going on for some time plus a drop in the readings of the main oscillator buffer from above the 50 level to below 4 over about 2 – 3 price bars. The argument behind this being that since ADX measures trend strength, the current trend is weakening and therefore a reversal of it, which in this case is a bullish trend, is about to take hold. Conversely, a bearish signal is marked by a strong bullish trend that also witnesses a similar drop in the ADX main buffer to below 40 from a lofty figure. We implement this in the signal class as follows:
//+------------------------------------------------------------------+
//| Check for Pattern 6.                                             |
//+------------------------------------------------------------------+
bool CSignalADX::IsPattern_6(ENUM_POSITION_TYPE T)
{  if(Base(X()+3) >= 50 && Base(X()) <= 40)
   {  if(T == POSITION_TYPE_BUY && Close(StartIndex()) > Close(StartIndex() + m_ma_period))
      {  return(true);
      }
      else if(T == POSITION_TYPE_SELL && Close(StartIndex()) < Close(StartIndex() + m_ma_period))
      {  return(true);
      }
   }
   return(false);
}
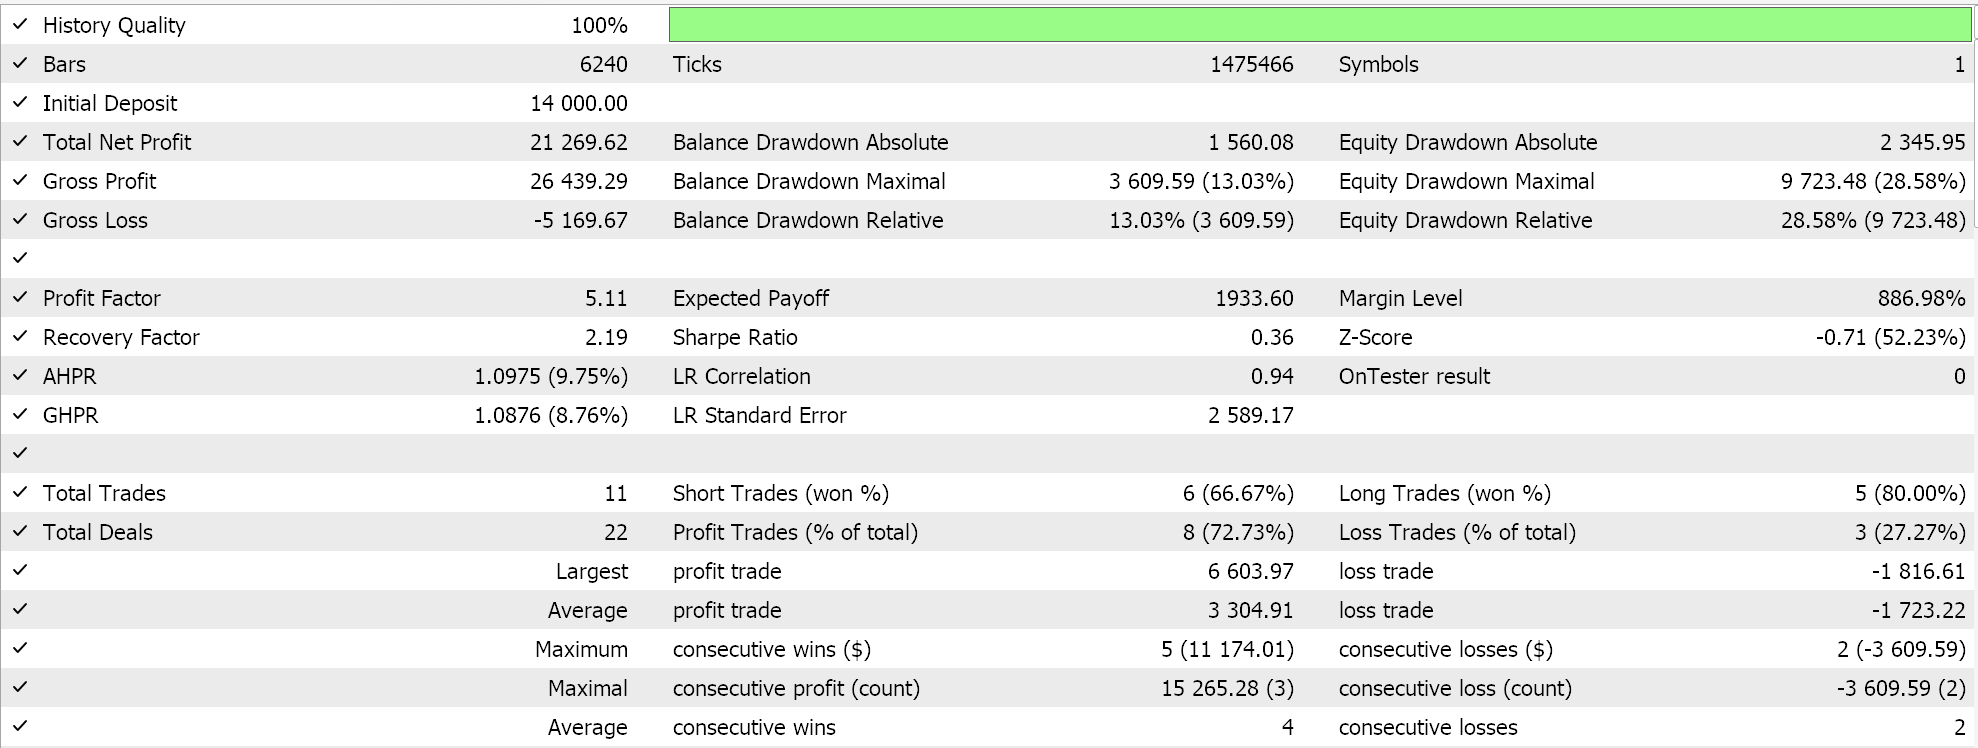
And testing of exclusively this pattern, by having the input parameter ‘Patterns Used’ assigned the integer value 64, gives us the following results:
ADX and Support/Resistance Break
Pattern 7, which is the 8th and penultimate of the ADX patterns that we are considering, marries spikes in the main ADX buffer with breakthroughs of either the support or resistance levels. Because interpretation of support and resistance lines is more problematic in code than it is in manual trading, we will rely on a secondary indicator, the Bollinger Bands, to help better define these. There are more nuanced workarounds to this, that I had considered in the recent articles on RSI, and Bollinger Bands, and the reader is welcome to have a look at them in redefining what we have chosen to use here.
Our support and resistance breakouts will simply be marked by piercing through the lower and upper bounds of the Bollinger Bands indicator. Therefore, a bullish signal is marked by a rise in the main ADX buffer above the 25 level and also a price spike through the upper Bollinger Bands while a bearish signal is marked by a similar rise in the ADX and a drop, in price below the Bands’ lower band. We implement this in MQL5 as follows:
//+------------------------------------------------------------------+
//| Check for Pattern 7.                                             |
//+------------------------------------------------------------------+
bool CSignalADX::IsPattern_7(ENUM_POSITION_TYPE T)
{  if(Base(X()+2) < 25 && Base(X()) > 25)
   {  if(T == POSITION_TYPE_BUY && Close(StartIndex()) >= Upper(StartIndex()))
      {  return(true);
      }
      else if(T == POSITION_TYPE_SELL && Close(StartIndex()) <= Lower(StartIndex()))
      {  return(true);
      }
   }
   return(false);
}
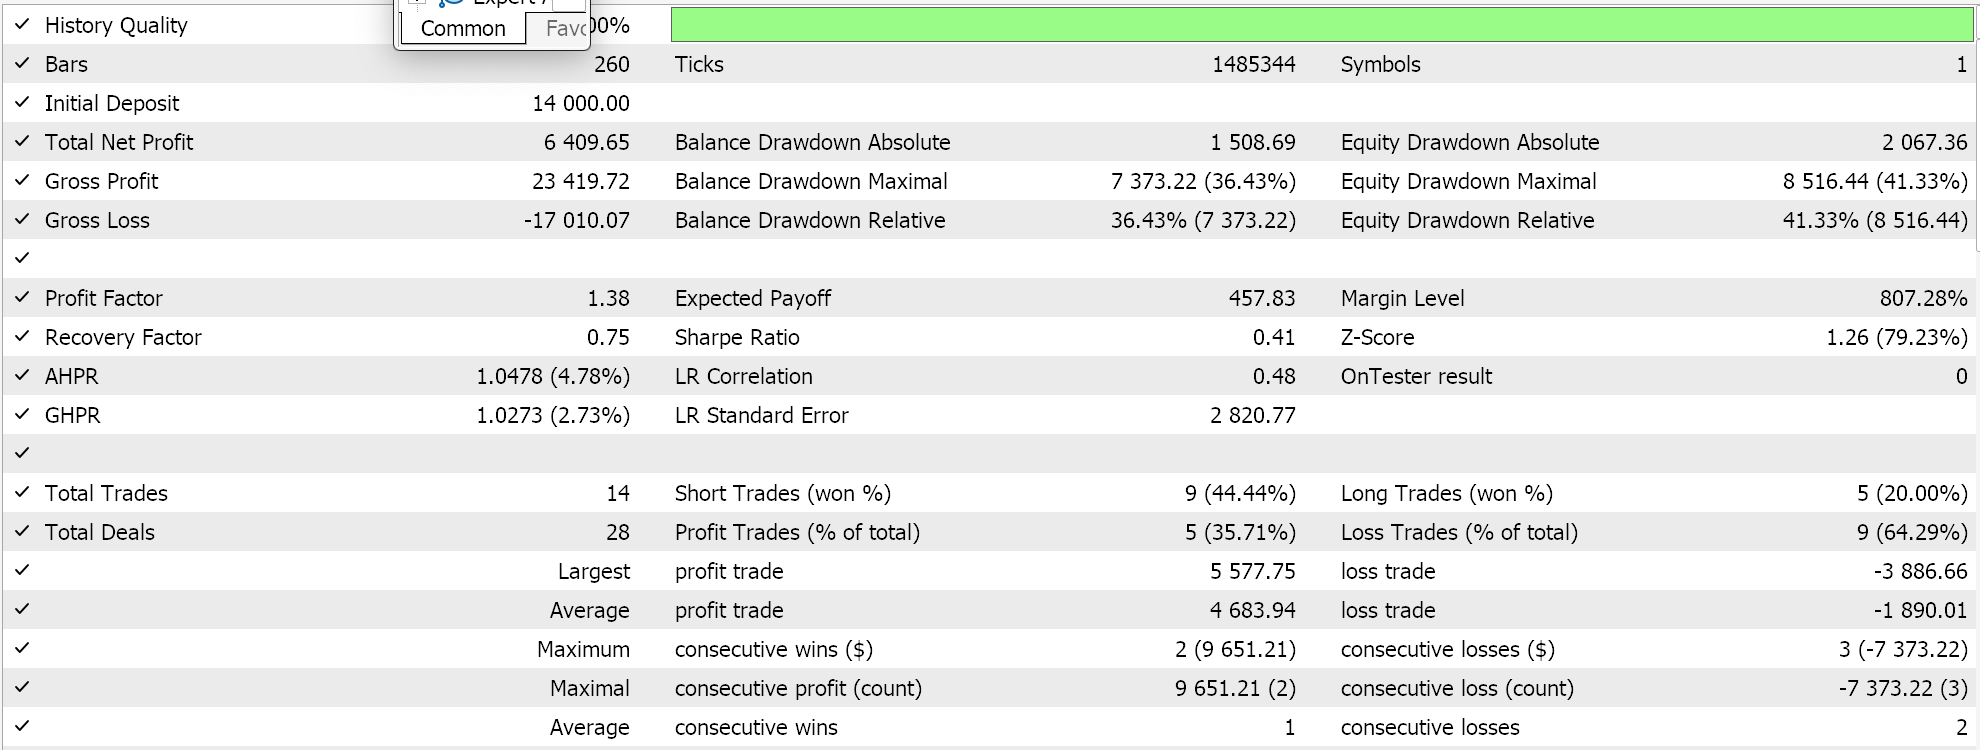
Testing the wizard assembled Expert Advisor that uses only this pattern by having the input parameter for Patterns Used set to 128, gives us the following results:
ADX with RSI Confirmation
Our final pattern, 8, combines ADX with an indicator we have already looked at the RSI. Since the ADX is a trend measuring indicator and the RSI often is used in marking over-bought and oversold points, the combination of these two from the ADX’s standpoint will need to factor in rising or major trends, not their end. To this point, we focus on the RSI crossings at the 50-level, not on it hitting the 70/30 thresholds.
The bullish signal is marked therefore by a crossing of the RSI from below 50 to over 50 together with a rise in the ADX main buffer from below 25 to above 25. Conversely, the bearish signal is signified by a drop in the RSI from above the 50 level to below it, with again a push-up in the ADX value above the 25 mark. We implement this in MQL5 as follows:
//+------------------------------------------------------------------+
//| Check for Pattern 8.                                             |
//+------------------------------------------------------------------+
bool CSignalADX::IsPattern_8(ENUM_POSITION_TYPE T)
{  if(Base(X()+1) < 25 && Base(X()) > 25)
   {  if(T == POSITION_TYPE_BUY && RSI(StartIndex()) > 50 && RSI(StartIndex() + 1) < 50)
      {  return(true);
      }
      else if(T == POSITION_TYPE_SELL && RSI(StartIndex()) < 50 && RSI(StartIndex() + 1) > 50)
      {  return(true);
      }
   }
   return(false);
}
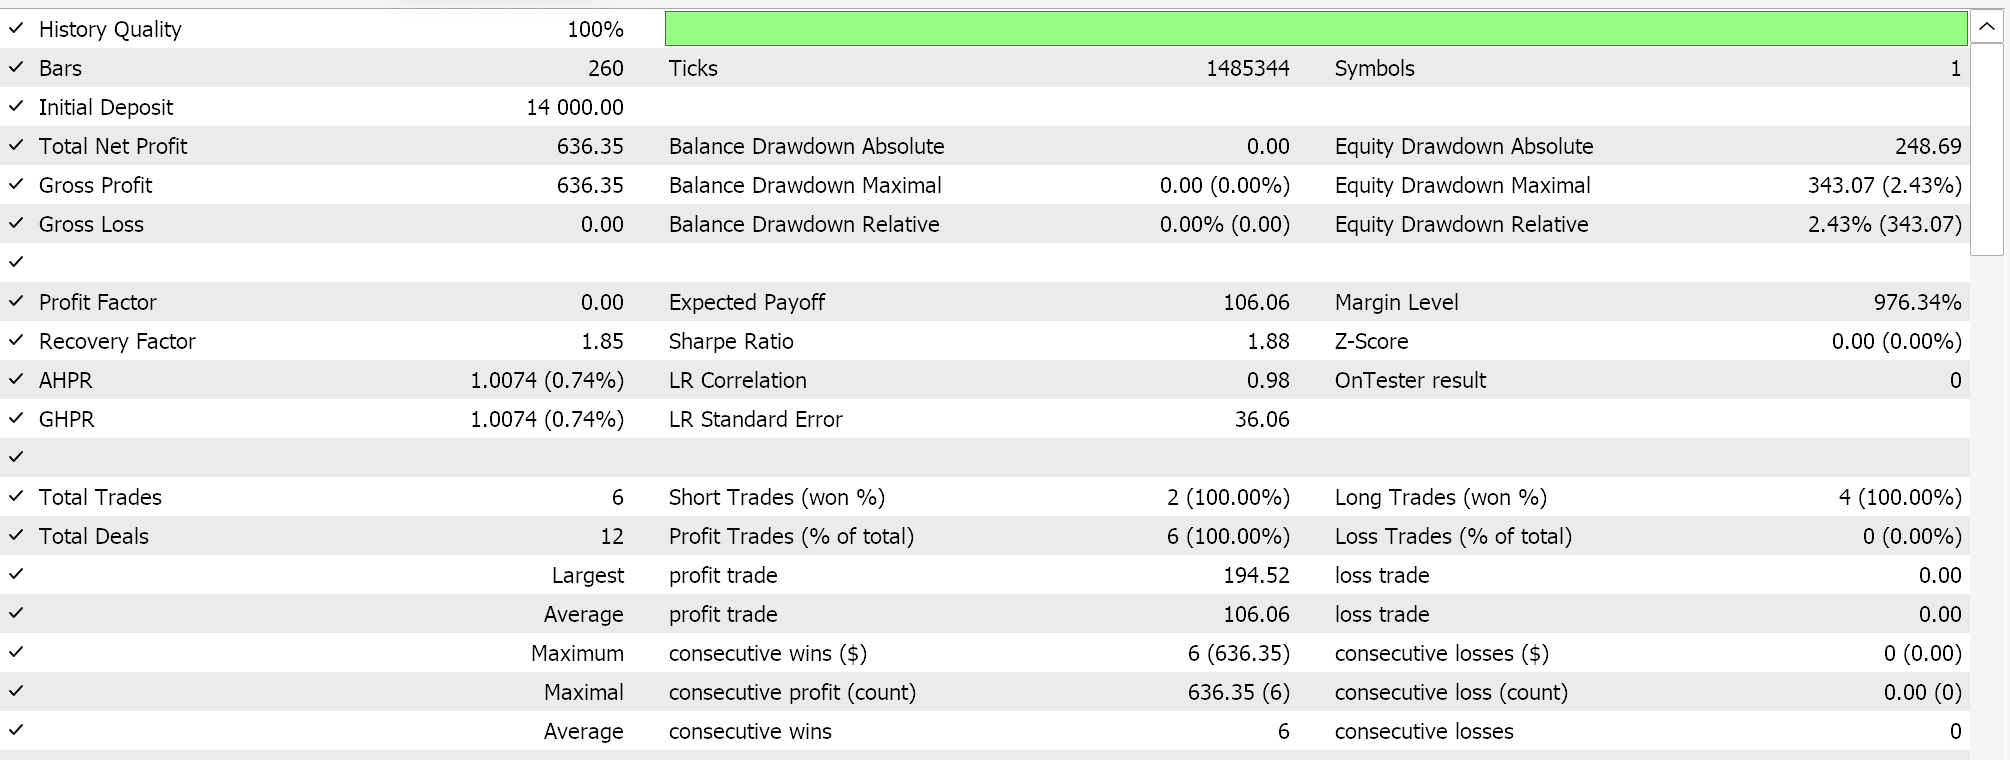
Testing of just this pattern, by having the input integer of patterns used assigned to 256, does give us the following results:
Optimization for Ideal ADX Patterns
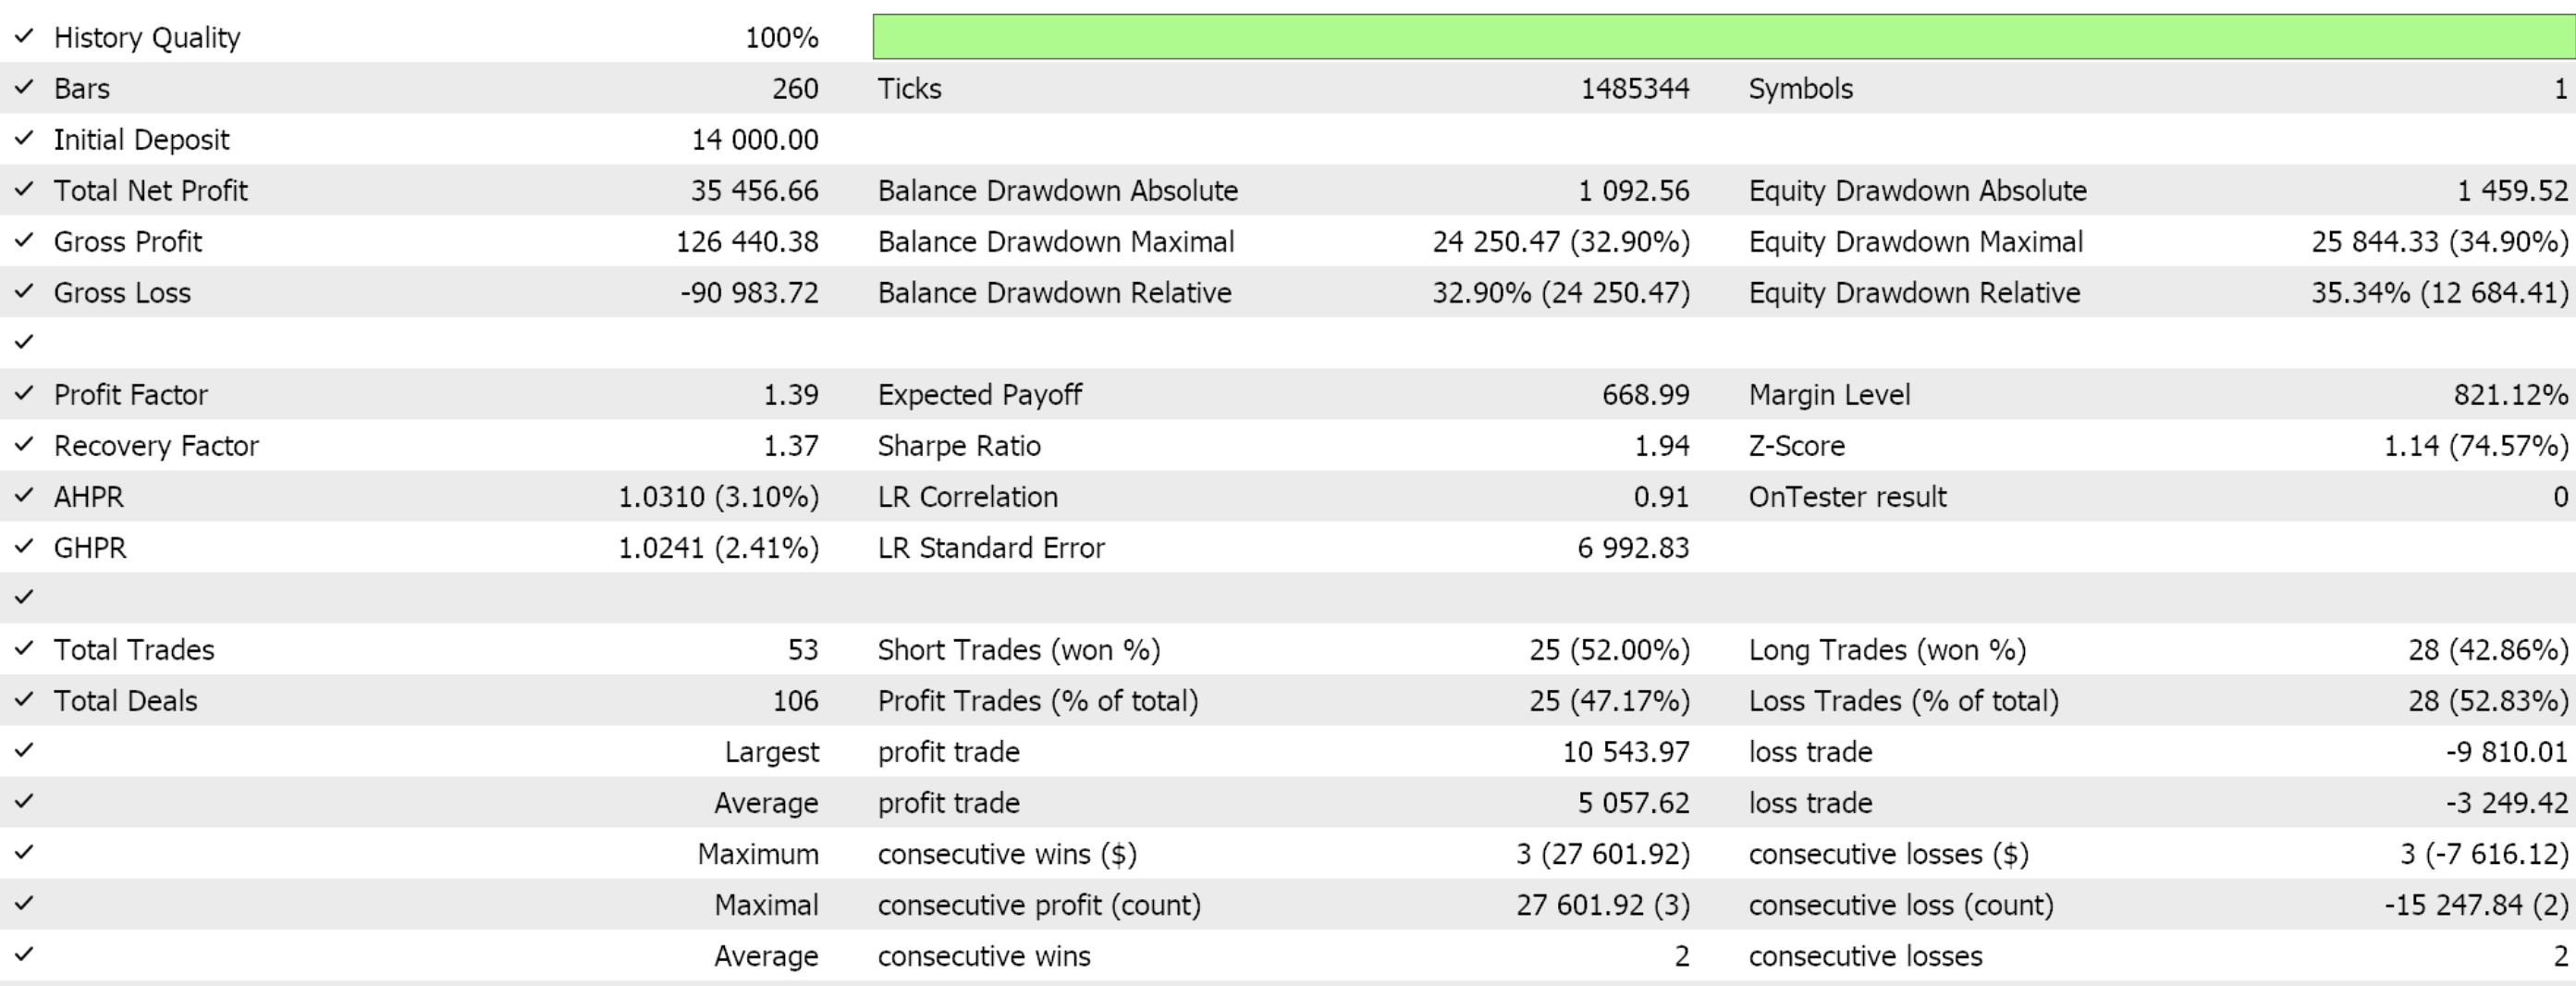
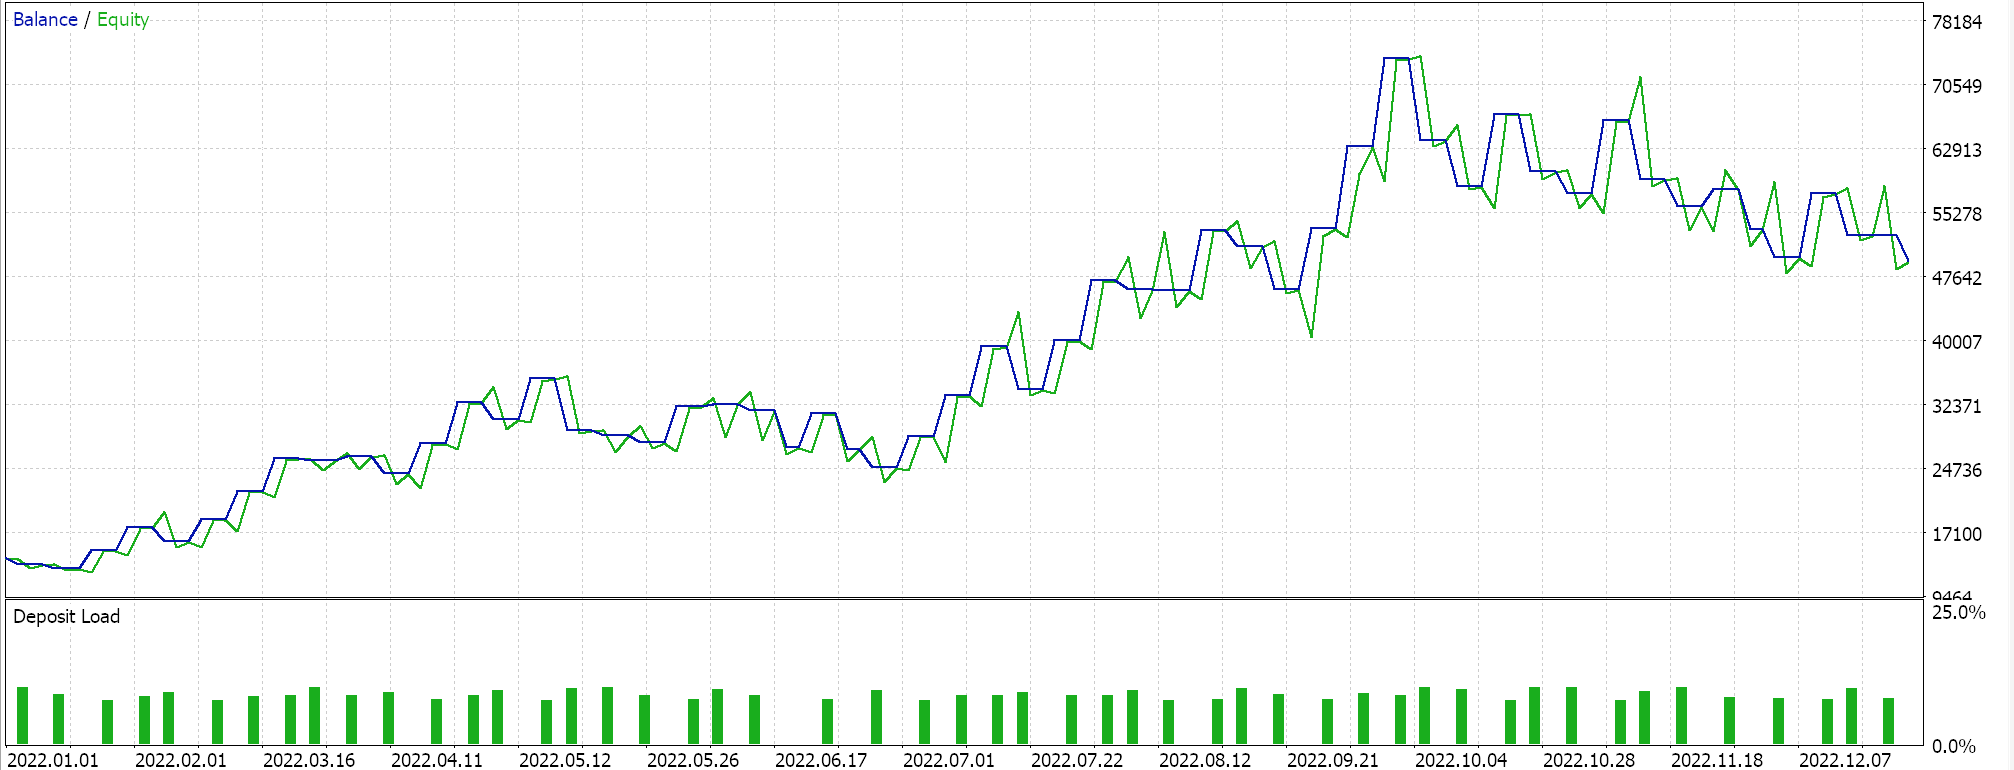
Our wizard assembled Expert Advisor, for which there are guide articles here and here on how to accomplish this with the code attached at the end of this article, can also be used while using all the ADX patterns we have considered thus far, albeit with different weightings. As I have mentioned before this is not necessarily ideal because you tend to have different patterns cancelling each other out meaning from optimization runs, one tends to get results that are ‘curve fitted’ and often struggle to replicate their performance on out of sample data. With that mentioned, here are some test results from combining all the nine patterns of the ADX we have considered this far.
The ATR
The average true range oscillator as already introduced above measures volatility, which for forex traders is crucial given the lack of volume data. Let’s therefore also look at its patterns, a few of which are applicable outside our typical custom signal class.
Volatility Breakout Signal
When the current ATR value rises significantly above its recent average, it may indicate a volatility breakout. This, in turn, implies a trading strategy where entry into a trade in the direction of the breakout when ATR increases significantly, signals that the market is likely to experience large price movements in that direction. Supplemental indicators such as the Moving-Average, MACD etc. can also determine the direction of the trade. We implement this in MQL5 as follows:
//+------------------------------------------------------------------+
//| Check for Pattern 0.                                             |
//+------------------------------------------------------------------+
bool CSignalATR::IsPattern_0(ENUM_POSITION_TYPE T)
{  if(ATR(X()) > ATR(X() + 1) && ATR(X() + 1) > ATR(X() + 2) && ATR(X() + 2) > ATR(X() + 3))
   {  if(T == POSITION_TYPE_BUY && Close(X()) > Close(X() + 1) && Close(X() + 1) > Close(X() + 2) && Close(X() + 2) > Close(X() + 3))
      {  return(true);
      }
      else if(T == POSITION_TYPE_SELL && Close(X()) < Close(X() + 1) && Close(X() + 1) < Close(X() + 2) && Close(X() + 2) < Close(X() + 3))
      {  return(true);
      }
   }
   return(false);
}
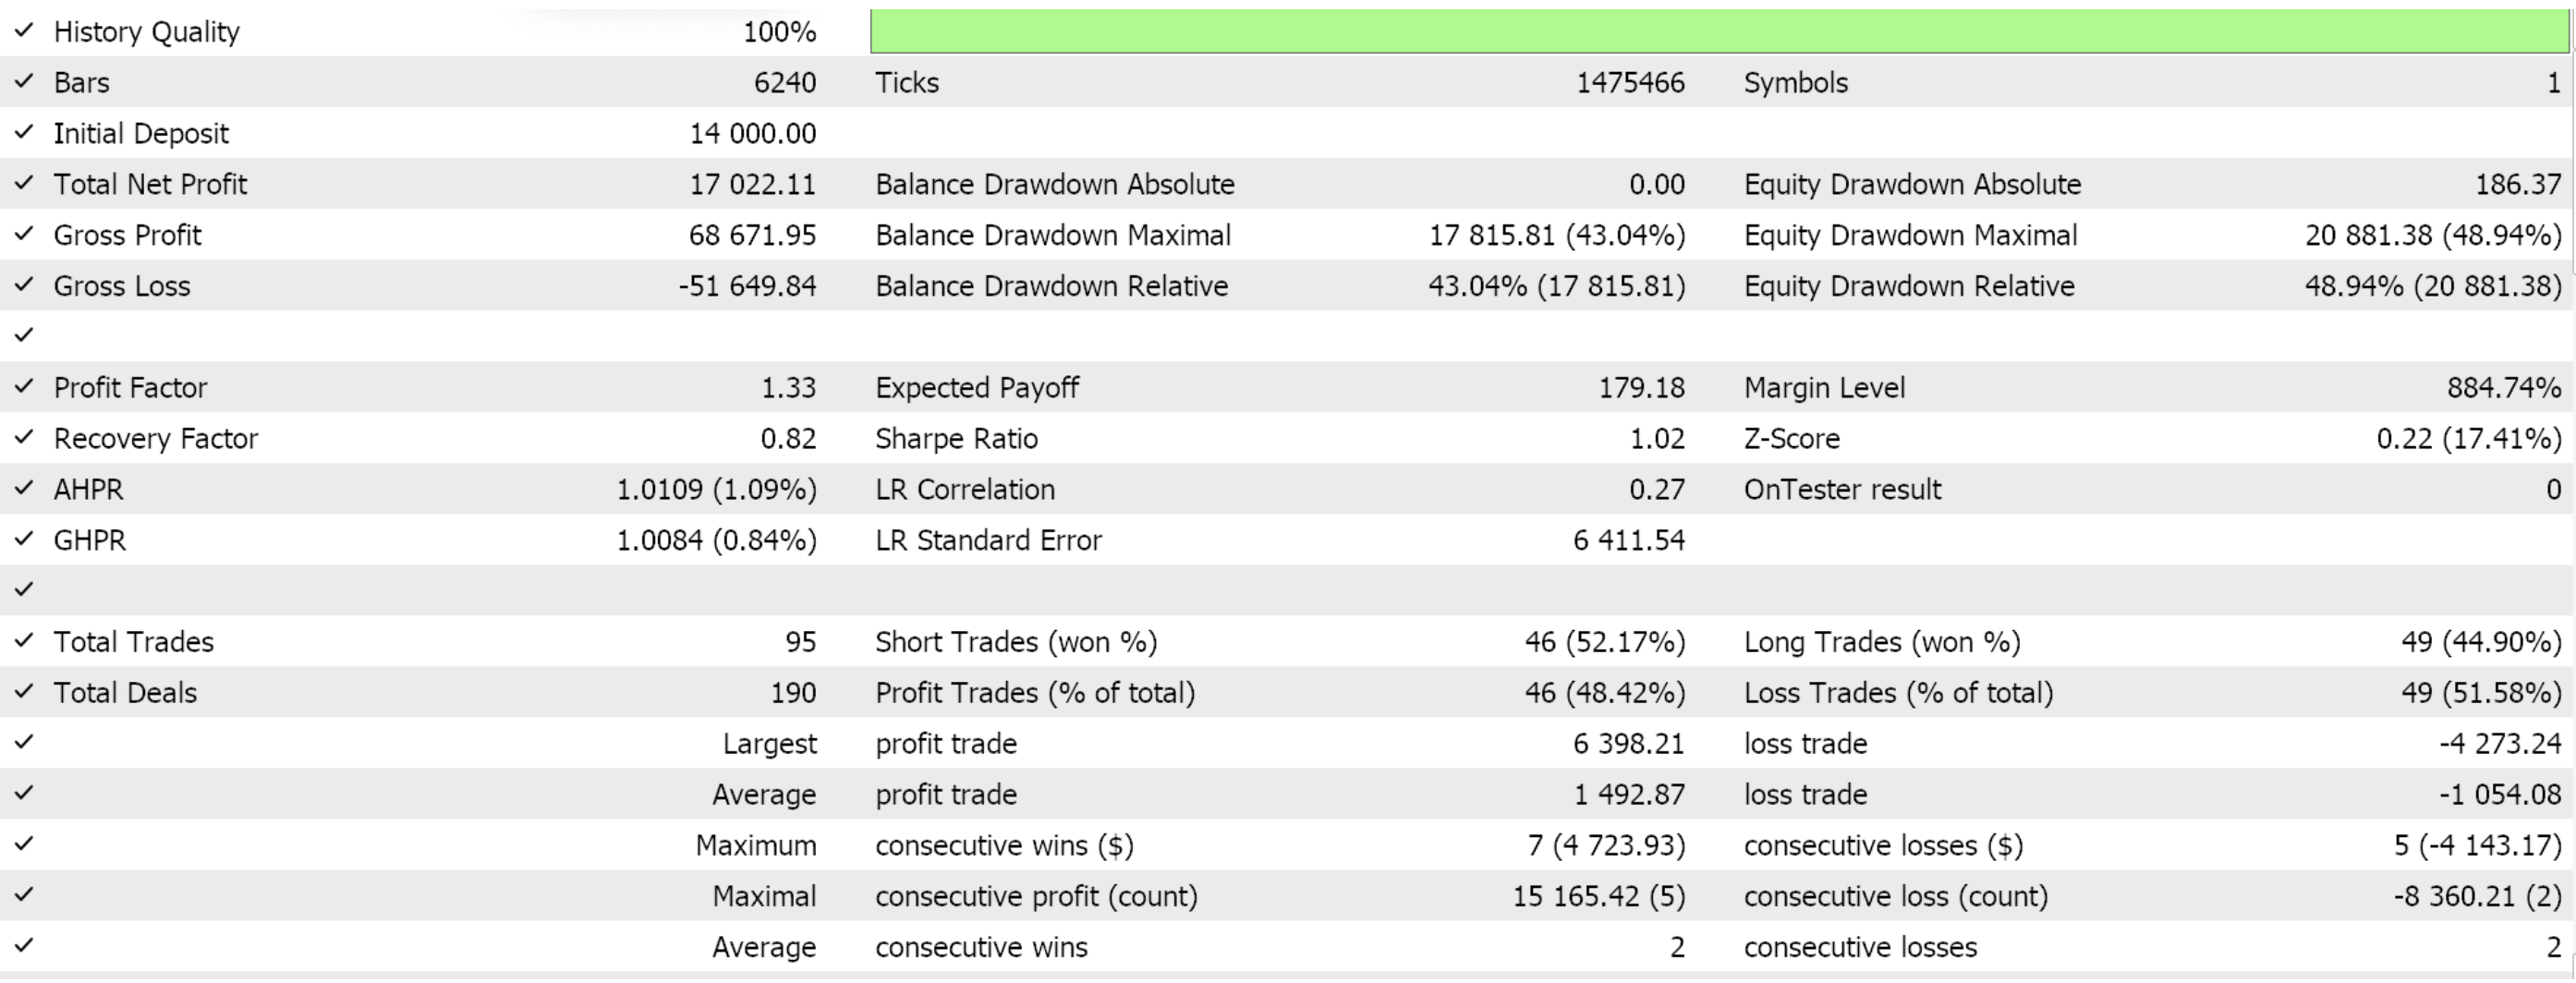
Testing this particular solo pattern with the input for Used Patterns assigned to 1 does give us the following reports as one of its many favourable results from a short optimization stint. We are optimizing for the pair EUR USD for the year 2022, on the hourly time frame.
ATR Threshold for Breakout Confirmation
Breakout confirmations with ATR are key, given that ATR is a volatility measure. By putting a value to the average range (highs minus lows) over a set period, it helps traders determine how much the price typically moves, with each new bar. A breakout occurs when the price moves beyond a defined support or resistance level. ATR therefore can serve as a filter for false breakouts, by using volatility thresholds to confirm the move.
A common issue with breakouts is that prices may breach a level briefly, only to retrace. The ATR threshold, when supplemented to these breeches, helps filter this by confirming the breakout if the price moves a specific percentage above/below the key level, relative to the ATR value. For instance, if the ATR is 20 pips, a breakout might be considered valid if the price moves beyond a support/resistance level by at least 1.5x or 2x if the 20 pips, thus indicating a true shift in momentum rather than noise. These ATR readings therefore are bound to be very sensitive which is why setting a lower ATR period (e.g., 7 or 10 as opposed to the typical 14 value) may be used for faster markets or short-term strategies, providing a better adaptability to volatility. With Swing Trading, though, a longer ATR period (e.g., 14 or 20) smooths out noise and provides a more stable breakout confirmation signal.
Our implementation in MQL5 however uses a slightly different approach in that we track price swings against an absolute ATR value. If price changes in a particular direction are had with reasonable ATR move that is more than an optimized threshold, then a new signal is triggered in the direction of the price trend. This we code as follows:
//+------------------------------------------------------------------+
//| Check for Pattern 1.                                             |
//+------------------------------------------------------------------+
bool CSignalATR::IsPattern_1(ENUM_POSITION_TYPE T)
{  if(ATR(X()) >= m_threshold_points*m_symbol.Point())
   {  if(T == POSITION_TYPE_BUY && Close(X()) > Close(X() + 1) && Close(X() + 1) > Close(X() + 2) && Close(X() + 2) > Close(X() + 3))
      {  return(true);
      }
      else if(T == POSITION_TYPE_SELL && Close(X()) < Close(X() + 1) && Close(X() + 1) < Close(X() + 2) && Close(X() + 2) < Close(X() + 3))
      {  return(true);
      }
   }
   return(false);
}
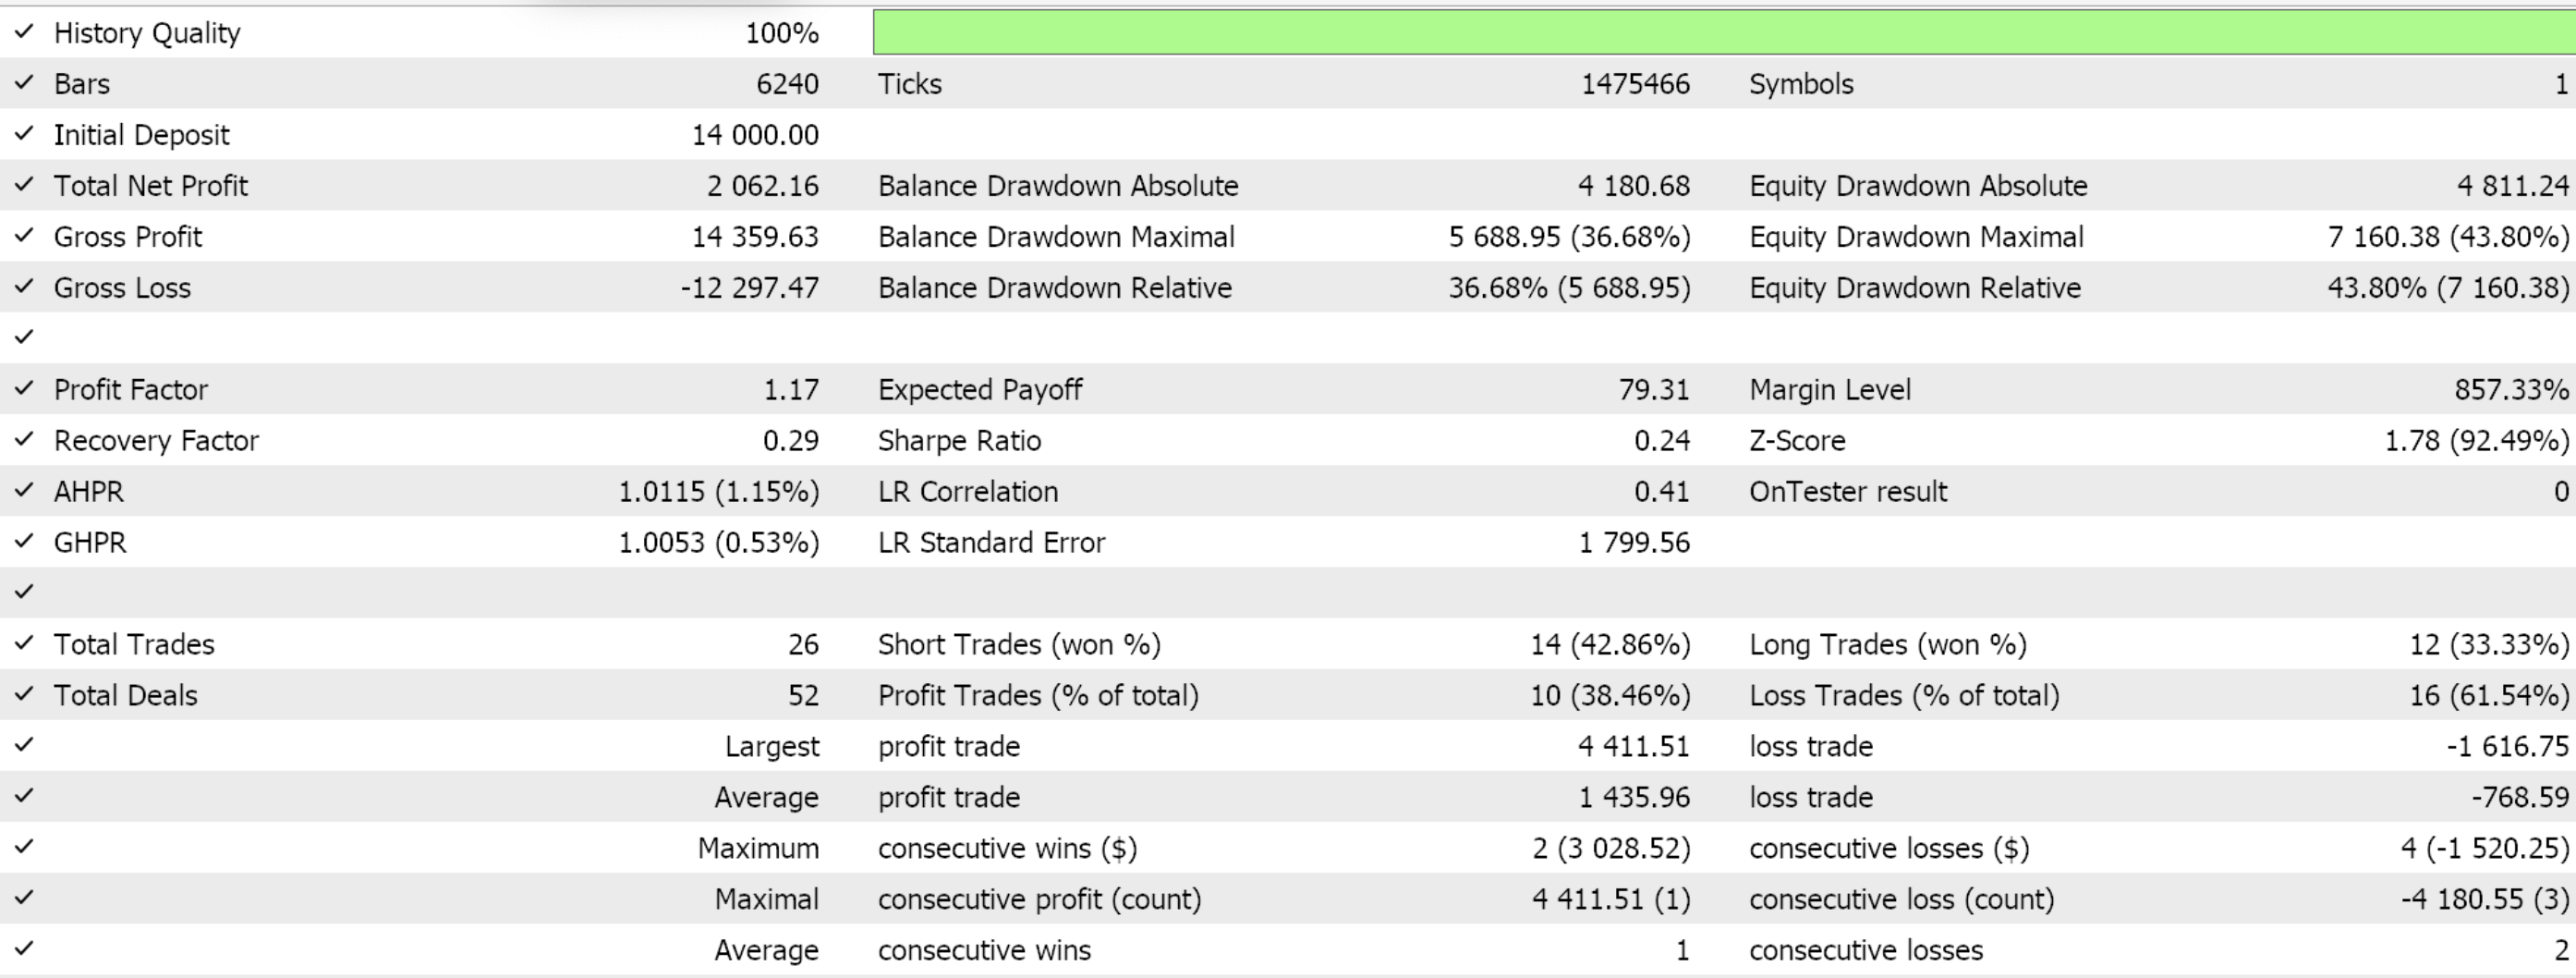
A test run from optimizations with just this pattern give us the following results:
ATR as an Exit Signal
ATR’s measure of market volatility makes it an effective tool for determining dynamic exit points based on current market conditions. Unlike fixed pip or point exit strategies, ATR-based exits adapt to the volatility of the market, ensuring that exits occur at meaningful levels rather than arbitrary thresholds. Sudden increase in ATR values could indicate a significant market event (Fed minutes, etc.) or a potential reversal. Traders therefore could choose to exit a position when ATR expands beyond a certain threshold, signalling heightened volatility that could lead to trend exhaustion or reversals. This pending reversal thus does present a signal.
Swing traders can further use ATR to exit positions at key known/identified price-levels by adding or subtracting a multiple of ATR to recent swing highs or lows. This allows them to account for average price movement and exit near key reversal points. This form of exiting, based on ATR levels by swing traders, reduces exposure to Adverse Excursions or unwarranted-drawdowns, especially during periods of increased volatility that can signal an impending reversal or a consolidation phase.
Also, in range-bound markets, ATR tends to be low therefore when ATR suddenly rises, it might indicate a potential breakout or increased volatility. Traders could use this rise as an exit signal if they were positioned within the range. The cardinal rule here being that avoiding low volatility exits, consistently, does help traders avoid being trapped in choppy, sideways markets, thus maintaining a favourable risk/reward profile on their trades. Our implementation in MQL5, though, is a bit simplistic because we are building a custom signal class, and we are looking for entry. This is how we code pattern 2:
//+------------------------------------------------------------------+
//| Check for Pattern 2.                                             |
//+------------------------------------------------------------------+
bool CSignalATR::IsPattern_2(ENUM_POSITION_TYPE T)
{  if(ATR(X()) >= 2.0 * m_threshold_points*m_symbol.Point())
   {  if(T == POSITION_TYPE_SELL && Close(X()) > Close(X() + 1) && Close(X() + 1) > Close(X() + 2) && Close(X() + 2) > Close(X() + 3))
      {  return(true);
      }
      else if(T == POSITION_TYPE_BUY && Close(X()) < Close(X() + 1) && Close(X() + 1) < Close(X() + 2) && Close(X() + 2) < Close(X() + 3))
      {  return(true);
      }
   }
   return(false);
}
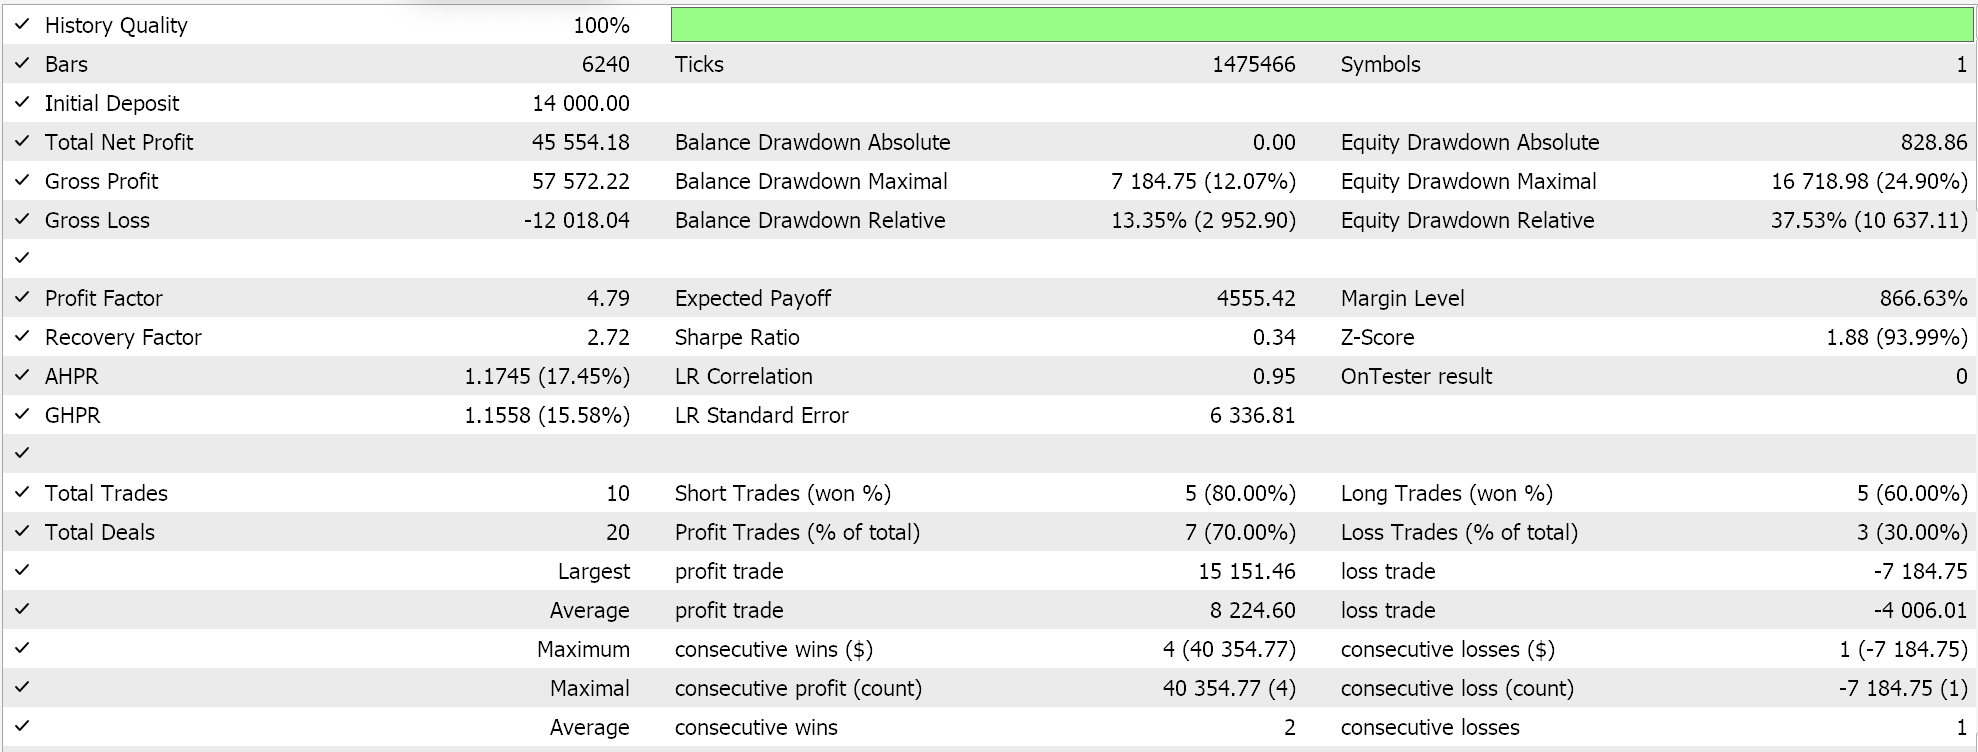
Our approach here essentially calls for a trend reversal when the ATR values get too high, more than double an optimized threshold. This is certainly not the best approach at exploiting this, as readers may already note that we have mentioned ‘more interesting’ ways of capitalizing on exits above. However, as always, the attached source code can be modified to have an alternate approach. A test run from a brief optimization stint for the pair EUR CHF for the year 2022 on the 1-Hour time frame does give us the following report:
Volatility Contraction Signal
ATR Contraction can also serve as a signal to prepare for a volatility expansion, the Quiet Before the Storm. Periods of low volatility typically come before a surge in price or some bout of volatility. Some traders often monitor ATR contraction to anticipate when a breakout is likely, positioning themselves for the upcoming move. A sudden rise in ATR after such a period is often a strong confirmation that a breakout has occurred. Traders therefore can use the ATR contraction to enter trades once volatility starts to expand again, thus aligning with the trend.
Another boon from ATR contractions relates to time-limited exits. Some traders exit positions after a certain time period, thus using ATR to guide when to close positions that are stagnating, can be very helpful with this. If ATR is low or declining as time passes, it might signal reduced momentum, which would make sense to exit since holding the position will not yield significant movement. In trend-following strategies, ATR contraction can also be resourceful. In a strong trend, if a contraction takes root, it could signal that the trend is losing momentum and may be entering consolidation. This can thus provide trend-followers an opportunity to either prepare for potential reversals or do some profit-taking. For trend-traders, a temporary exit may make sense.
For swing traders, ATR contraction can signal that the price is stuck in a consolidation phase, suggesting it is time to exit positions and avoid being caught in sideways movement. Conversely, once the contraction ends, swing traders can look for entry points when volatility starts to expand again. Alternatively, swing traders can use ATR contraction to identify range-bound markets, for trading the range by buying at support and selling at resistance until a breakout or breakdown occurs.
Also, worth noting, especially for opaque forex markets, is that ATR contraction often occurs alongside declining trading volumes, which usually implies market participants are indecisive. When volume does increase and ATR expands, it could suggest a potential breakout as new liquidity enters the market. Combining ATR contraction with a subsequent volume surge is a useful confirmation for breakout traders looking to enter during volatility expansion. For this article, volatility contraction as an entry signal is used to catch reversals. These pending reversals then define our anticipated price direction. If ATR tapers off after a downward trend, we anticipate a pullback and therefore have a bullish signal. If, on the other hand, this drop in ATR happens towards the end of a bull-run, we would take this as a bearish signal. Our code to this effect is given below:
//+------------------------------------------------------------------+
//| Check for Pattern 3.                                             |
//+------------------------------------------------------------------+
bool CSignalATR::IsPattern_3(ENUM_POSITION_TYPE T)
{  if(ATR(X()) < ATR(X() + 1) && ATR(X() + 1) < ATR(X() + 2) && ATR(X() + 2) < ATR(X() + 3))
   {  if(T == POSITION_TYPE_SELL && Close(X() + 3) > Close(X() + 4) && Close(X() + 4) > Close(X() + 5) && Close(X() + 5) > Close(X() + 6))
      {  return(true);
      }
      else if(T == POSITION_TYPE_BUY && Close(X() + 3) < Close(X() + 4) && Close(X() + 4) < Close(X() + 5) && Close(X() + 5) < Close(X() + 6))
      {  return(true);
      }
   }
   return(false);
}
Test run from some of the optimization results that use only pattern 3 by having the input parameter for patterns used as 8, do give us the following results:
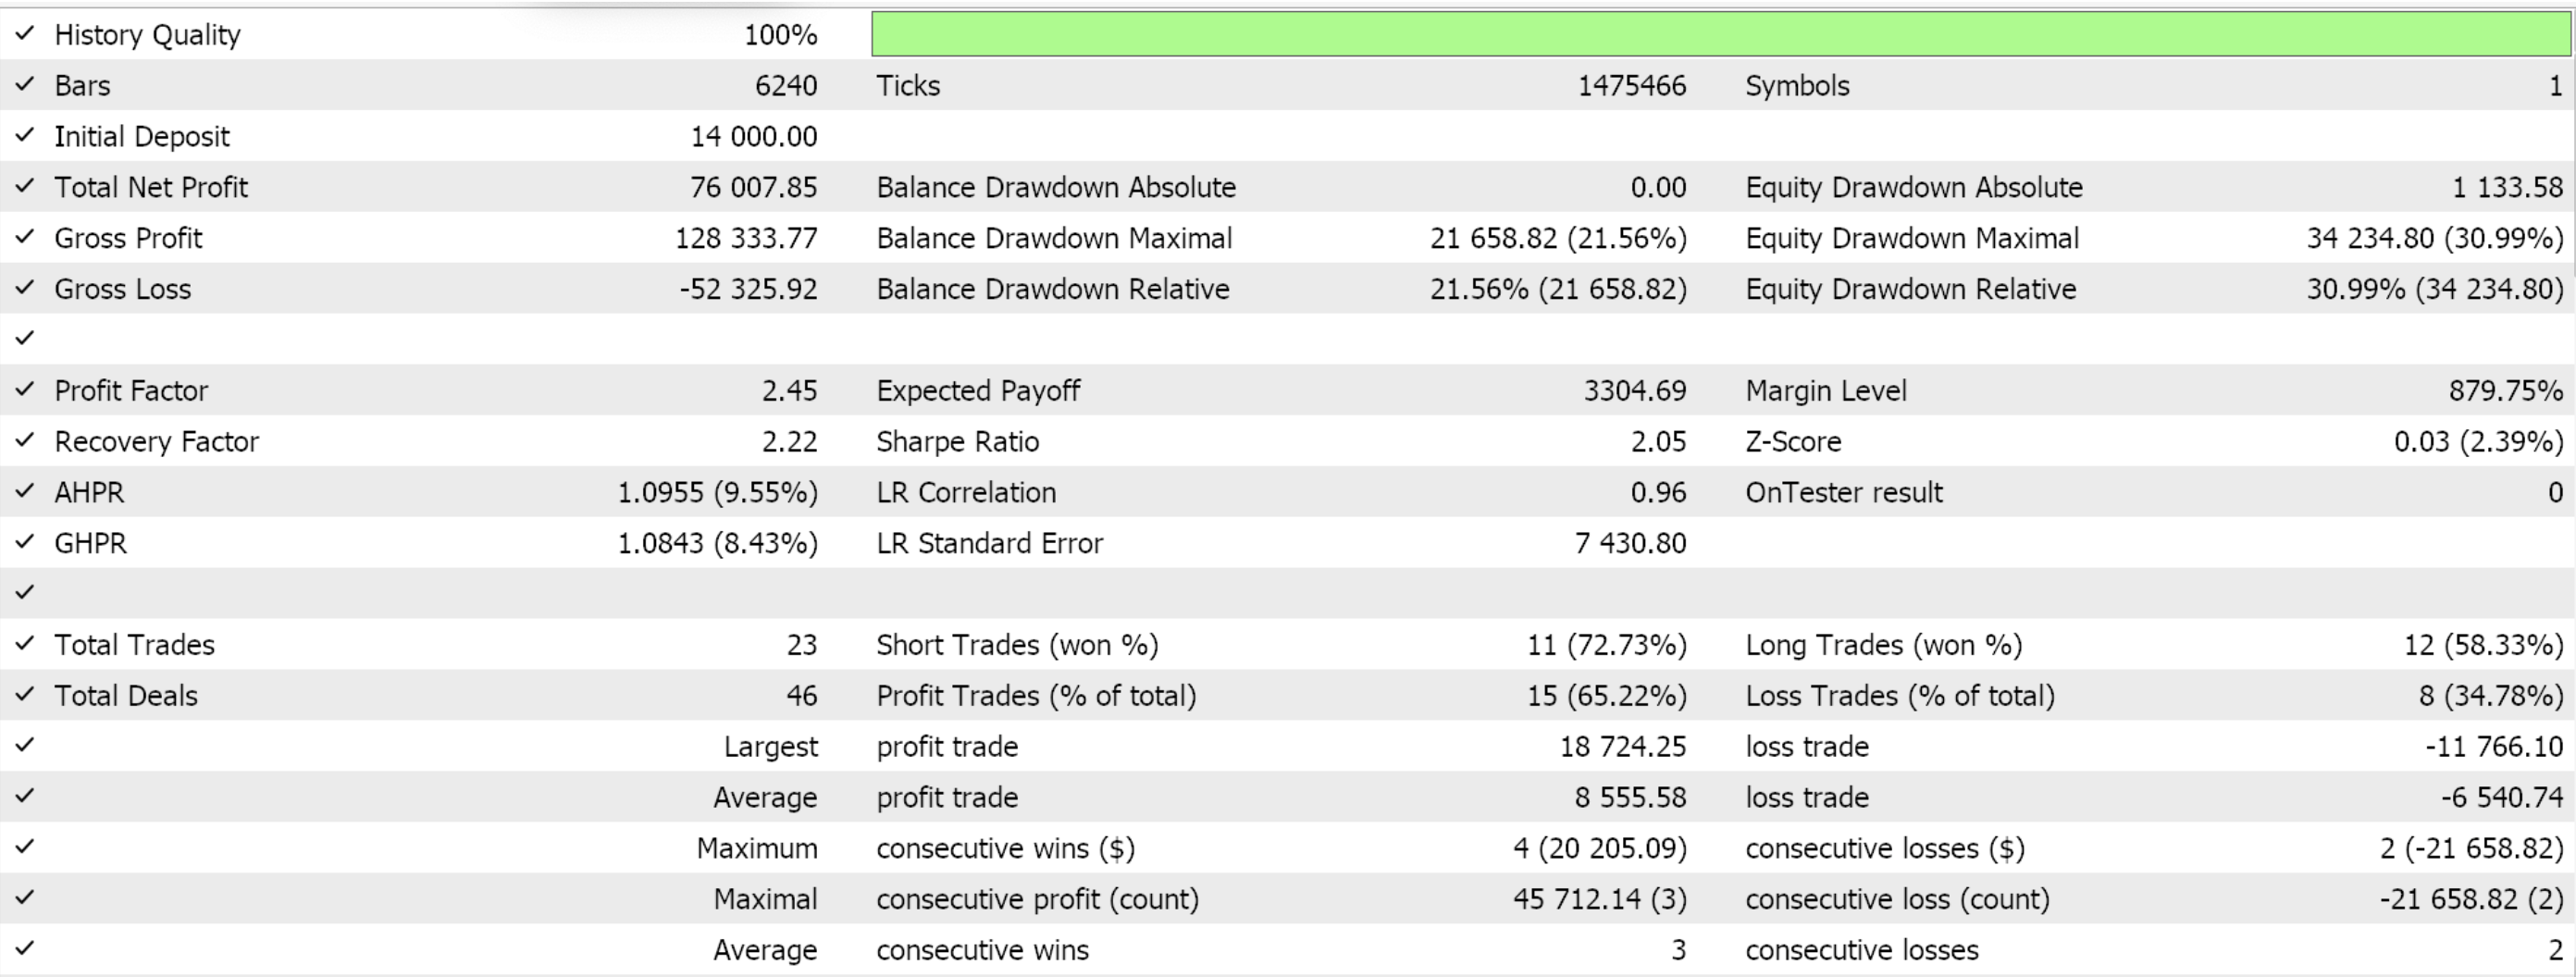
ATR Channel (ATR Bands)
ATR Channels (also known as ATR Bands) are dynamic volatility-based bands that can be plotted above and below the price using a multiple of the Average True Range (ATR). Just like the Bollinger Bands, they help to create a channel around the price, which in this particular case can be helpful in reflecting market volatility.
And just like the Bands, these expand and contract based on price volatility, providing traders with a sense of how much price typically moves from its mean within a given timeframe. Also, the upper and lower Bands do act as a dynamic support and resistance level respectively, such that as price tends to fluctuate within these bands, and touch or break of these ‘levels’ signals for potential reversals or continuation can be generated. Unlike static support/resistance levels, these are bound to be more dynamic, making them more responsive to prevalent market conditions.
So, the signals from these bands are when we have a price breakout above the upper ATR Band for a bullish trend or increased buying pressure, while a break below the lower band can indicate a bearish trend or selling pressure. For a manual trader, a custom indicator that physically plots these bands will have to be implemented but in our case since we use wizard assembled Expert Advisors (with guides here & here for new readers), we do not have to bother with that. Since we are automating our trading process, we can take the two separate indicator readings of price moving-average and ATR and sum them up to define these bands, on each new bar. We implement the pattern in MQL5 as follows:
//+------------------------------------------------------------------+
//| Check for Pattern 4.                                             |
//+------------------------------------------------------------------+
bool CSignalATR::IsPattern_4(ENUM_POSITION_TYPE T)
{  if(T == POSITION_TYPE_BUY && Close(X()) > MA(X()) + 2.0 * ATR(X()))
   {  return(true);
   }
   else if(T == POSITION_TYPE_SELL && Close(X()) < MA(X()) - 2.0 * ATR(X()))
   {  return(true);
   }
   return(false);
}
Such bands can take on extra roles such as filtering false breakouts when used with other indicators like the Bollinger Bands or Keltner Channels, by confirming that the breakout is significant enough. Other applications for the ATR channel do overlap a bit with what we have mentioned above, however they still bear mentioning. ATR Channels can help identify the strength and direction of a trend. When the price consistently moves near the upper ATR Band, it intimates a strong bullish trend. Similarly, price moving along the lower band indicates a strong bearish trend. This trend spotting can come in handy in some markets that seem whipsawed on large time frames. Conversely, if the price struggles to break out of the ATR Bands or frequently touches the bands without follow-through, this could signal trend exhaustion or dwindling momentum.
Traders also use ATR Bands to identify mean reversion opportunities, especially in range-bound markets. When the price touches the upper or lower band, it may signal that the asset is overbought or oversold, and a reversal toward the mean (average price) is likely. Therefore, depending on the timeframe under consideration, when the price bounces off the upper or lower ATR Band without breaking it, this can signal to traders to take profits or reverse their positions.
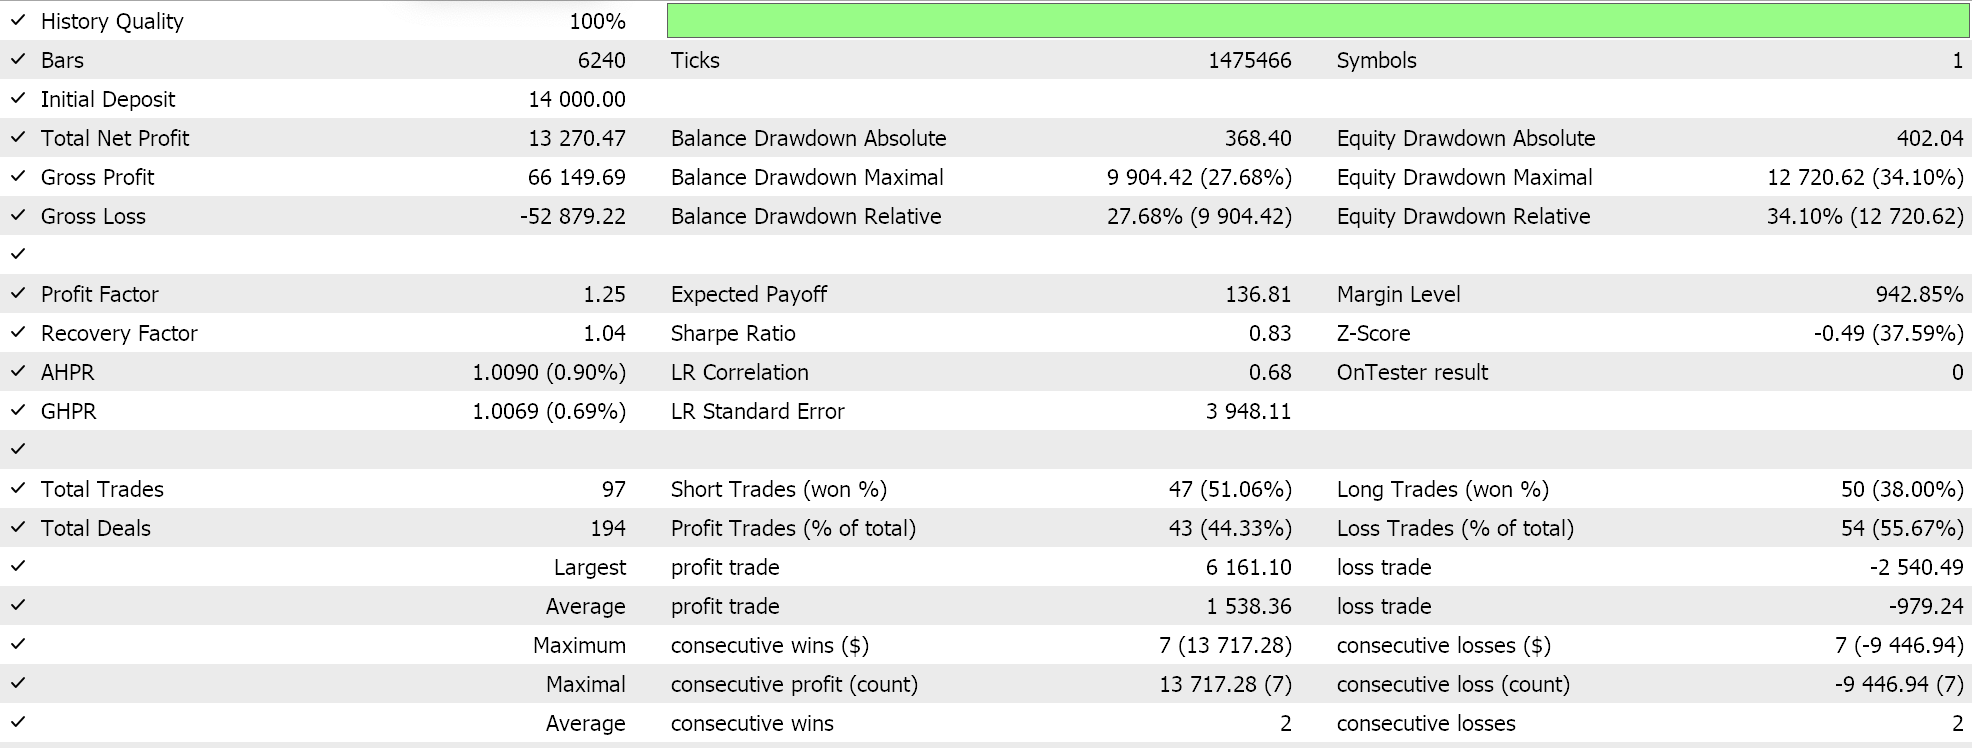
When using volatility-based take-profit, these bands can provide dynamic levels based on volatility. A take-profit placed just outside the ATR Band can help protect trades from normal market noise, which would leave money on the table, by allowing room for price fluctuations within the band. This was not considered in our pattern 4 implementation since we are doing a custom signal class however it can feature in a custom trailing class of another wizard assembled Expert Advisor. Test runs from an optimization stint, with settings similar to what we have used above of; EUR CHF, hourly time frame, year 2022, do present as follows:
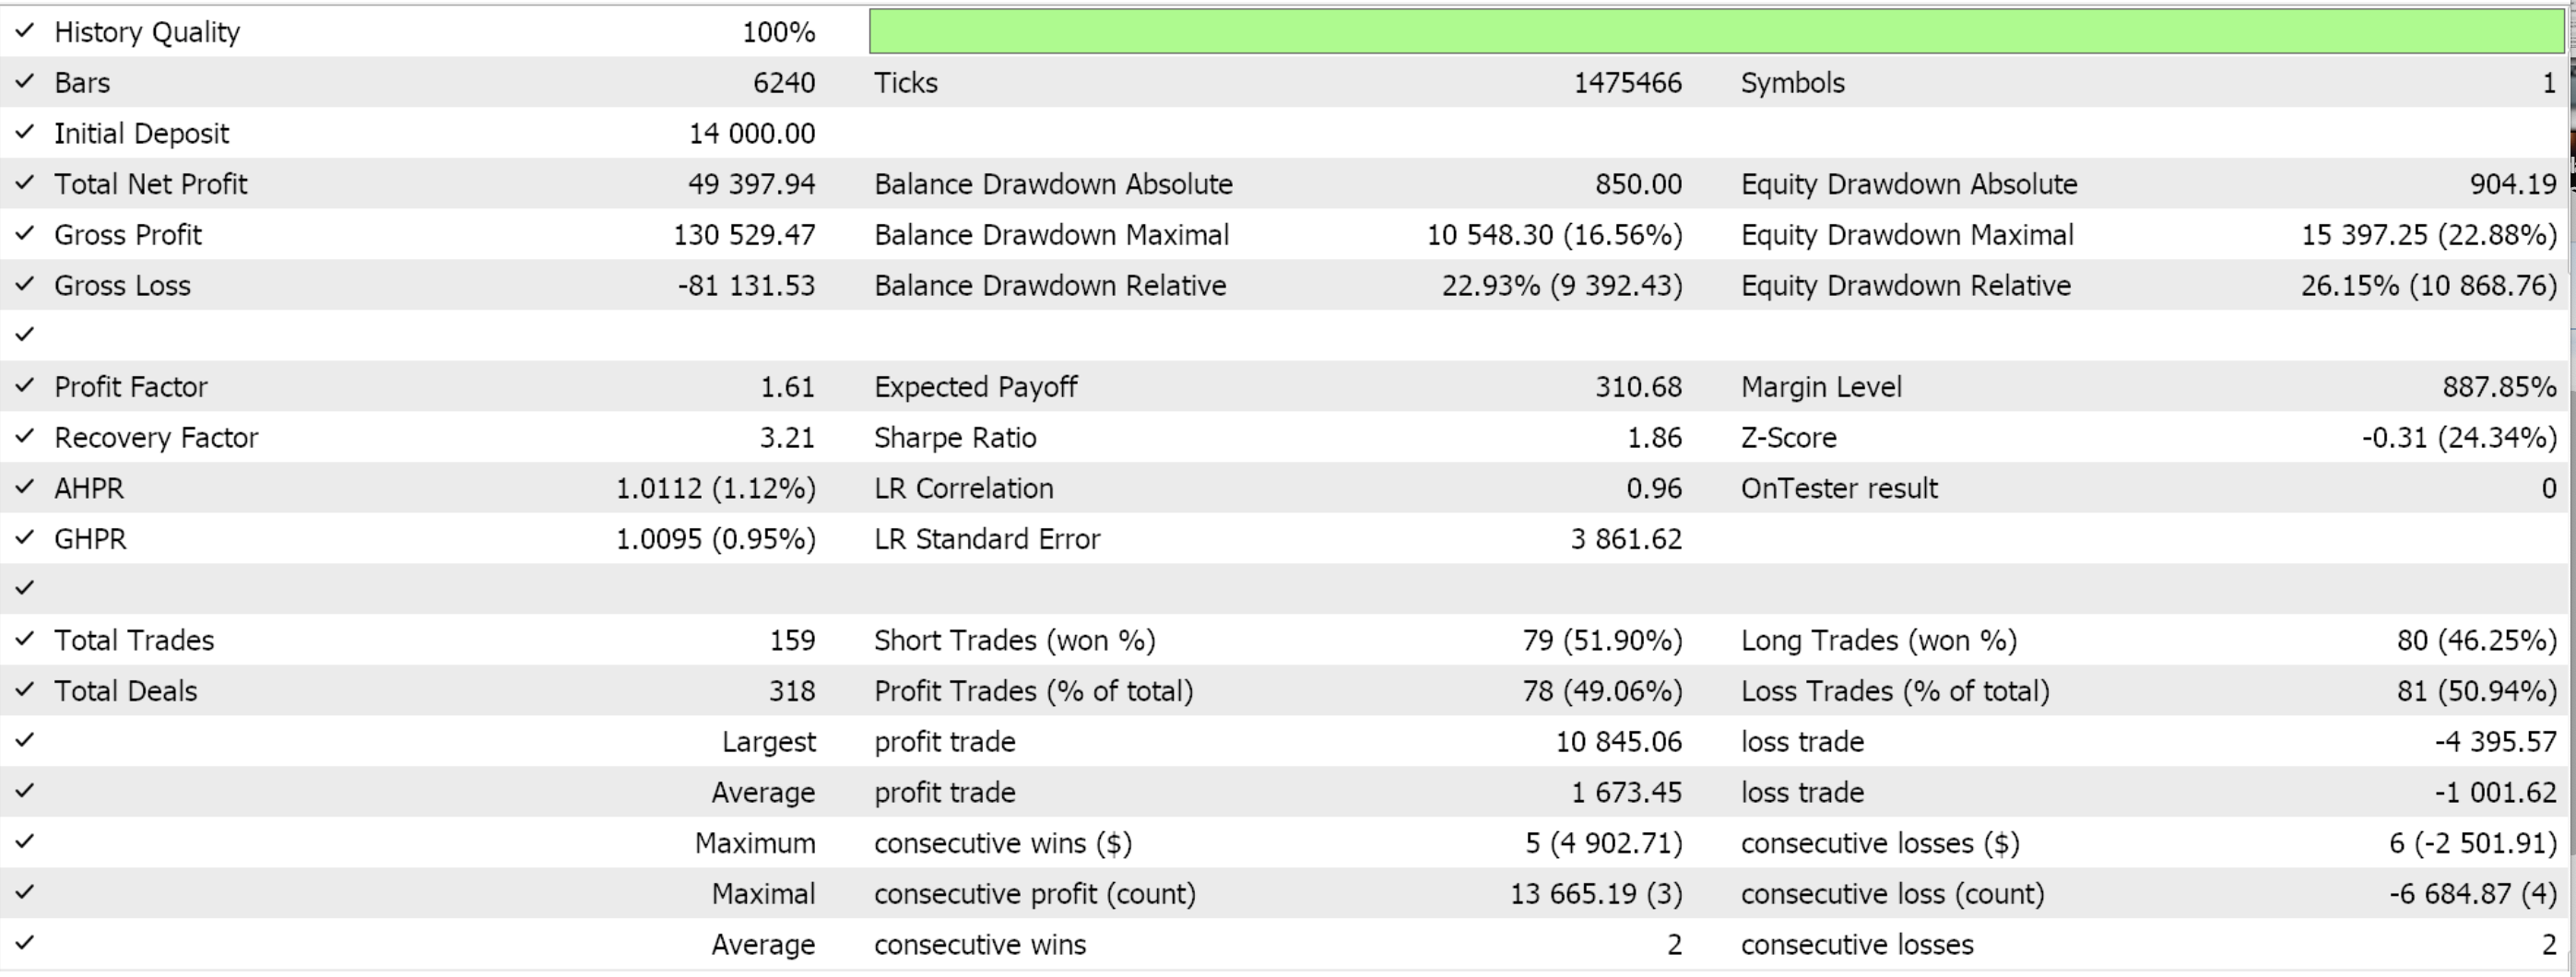
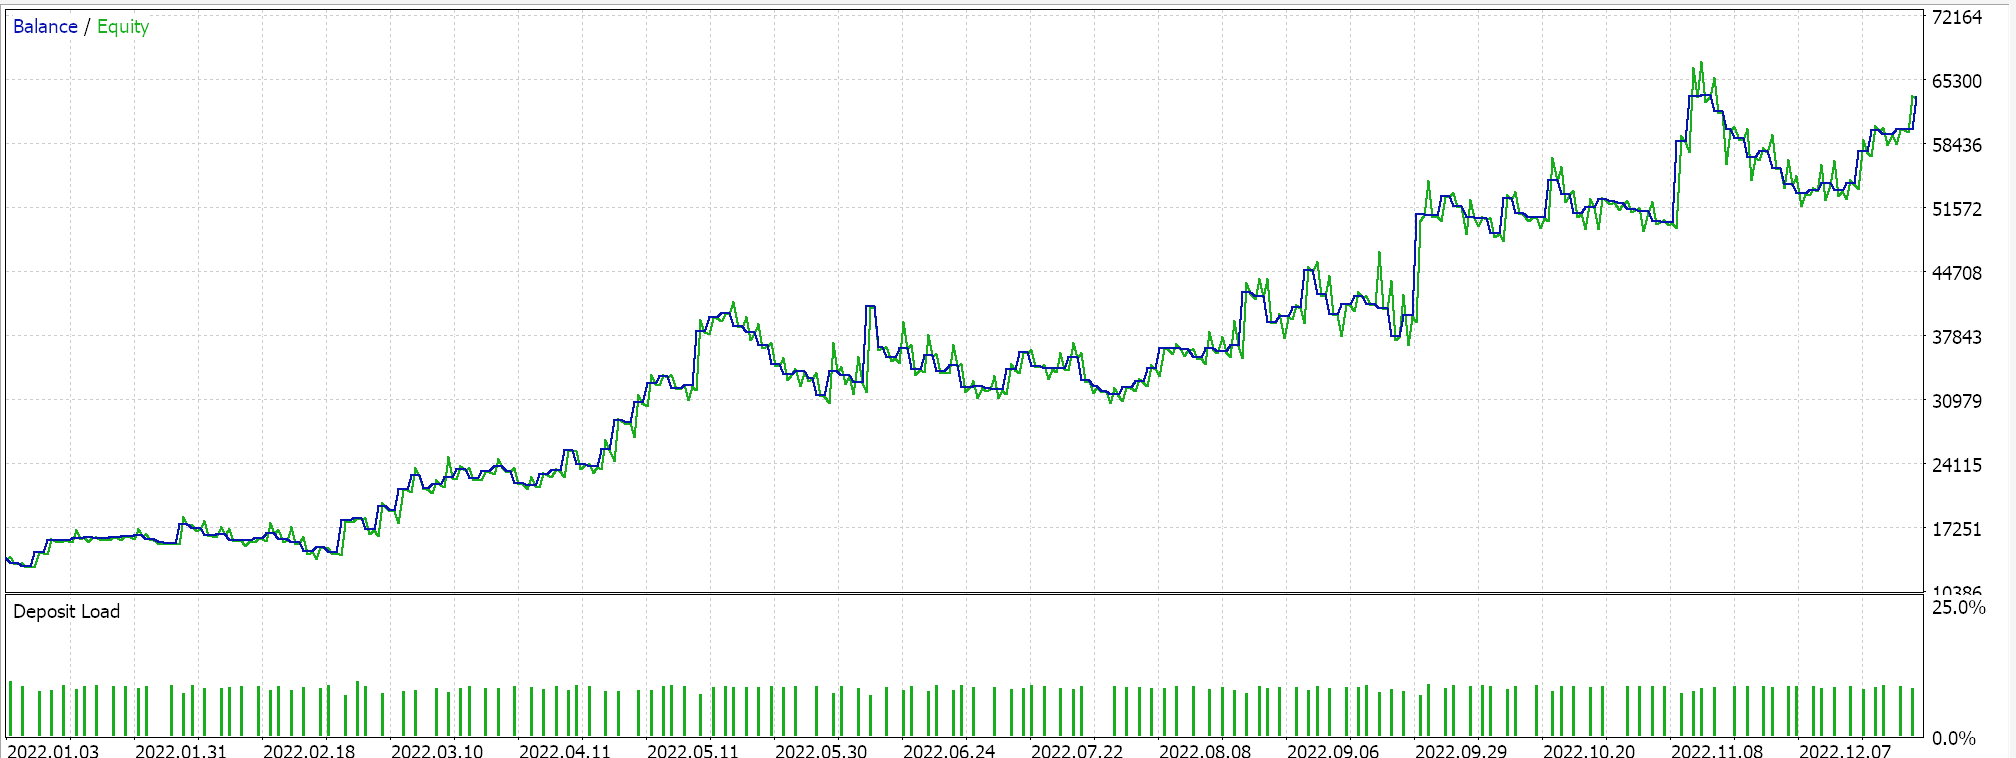
We then perform an optimization across all these signals when combined into one, with various weights, we do get the following test runs from one of the favourable optimization runs.
ATR in Trailing Class
We have considered how the ATR can be used to generate entry and exit signals for an Expert Advisor, even though this is not always the primary purpose or use. Primarily, ATR is used in stops placement or at most position sizing; therefore we have a look at these within custom classes that can still be assembled within an Expert Advisor via the MQL5 wizard.
We keep our implementation here simple, whereby in order to define a trailing stop-level, we simply increment a benchmark by a multiple of the ATR. Our benchmark, for our purposes, can take on 3 forms. Raw price, Moving-average price, and SAR indicator price levels. Each of these, in their own part, provide us with a pattern which we index 0, 1, & 2 and code as follows:
//+------------------------------------------------------------------+
//| Check for Pattern 0.                                             |
//+------------------------------------------------------------------+
void CTrailingATR::IsPattern_0(double &Price, ENUM_POSITION_TYPE T)
{  if(T == POSITION_TYPE_BUY)
   {  Price -= (m_stop_level * ATR(StartIndex()));
   }
   else if(T == POSITION_TYPE_SELL)
   {  Price += (m_stop_level * ATR(StartIndex()));
   }
}
//+------------------------------------------------------------------+
//| Check for Pattern 1.                                             |
//+------------------------------------------------------------------+
void CTrailingATR::IsPattern_1(double &Price, ENUM_POSITION_TYPE T)
{  if(T == POSITION_TYPE_BUY)
   {  Price = (MA(StartIndex()) - (m_stop_level * ATR(StartIndex())));
   }
   else if(T == POSITION_TYPE_SELL)
   {  Price = (MA(StartIndex()) + (m_stop_level * ATR(StartIndex())));
   }
}
//+------------------------------------------------------------------+
//| Check for Pattern 2.                                             |
//+------------------------------------------------------------------+
void CTrailingATR::IsPattern_2(double &Price, ENUM_POSITION_TYPE T)
{  if(T == POSITION_TYPE_BUY && SAR(StartIndex()) < Low(StartIndex()))
   {  Price = (SAR(StartIndex()) - (m_stop_level * ATR(StartIndex())));
   }
   else if(T == POSITION_TYPE_SELL && SAR(StartIndex()) > High(StartIndex()))
   {  Price = (SAR(StartIndex()) + (m_stop_level * ATR(StartIndex())));
   }
}
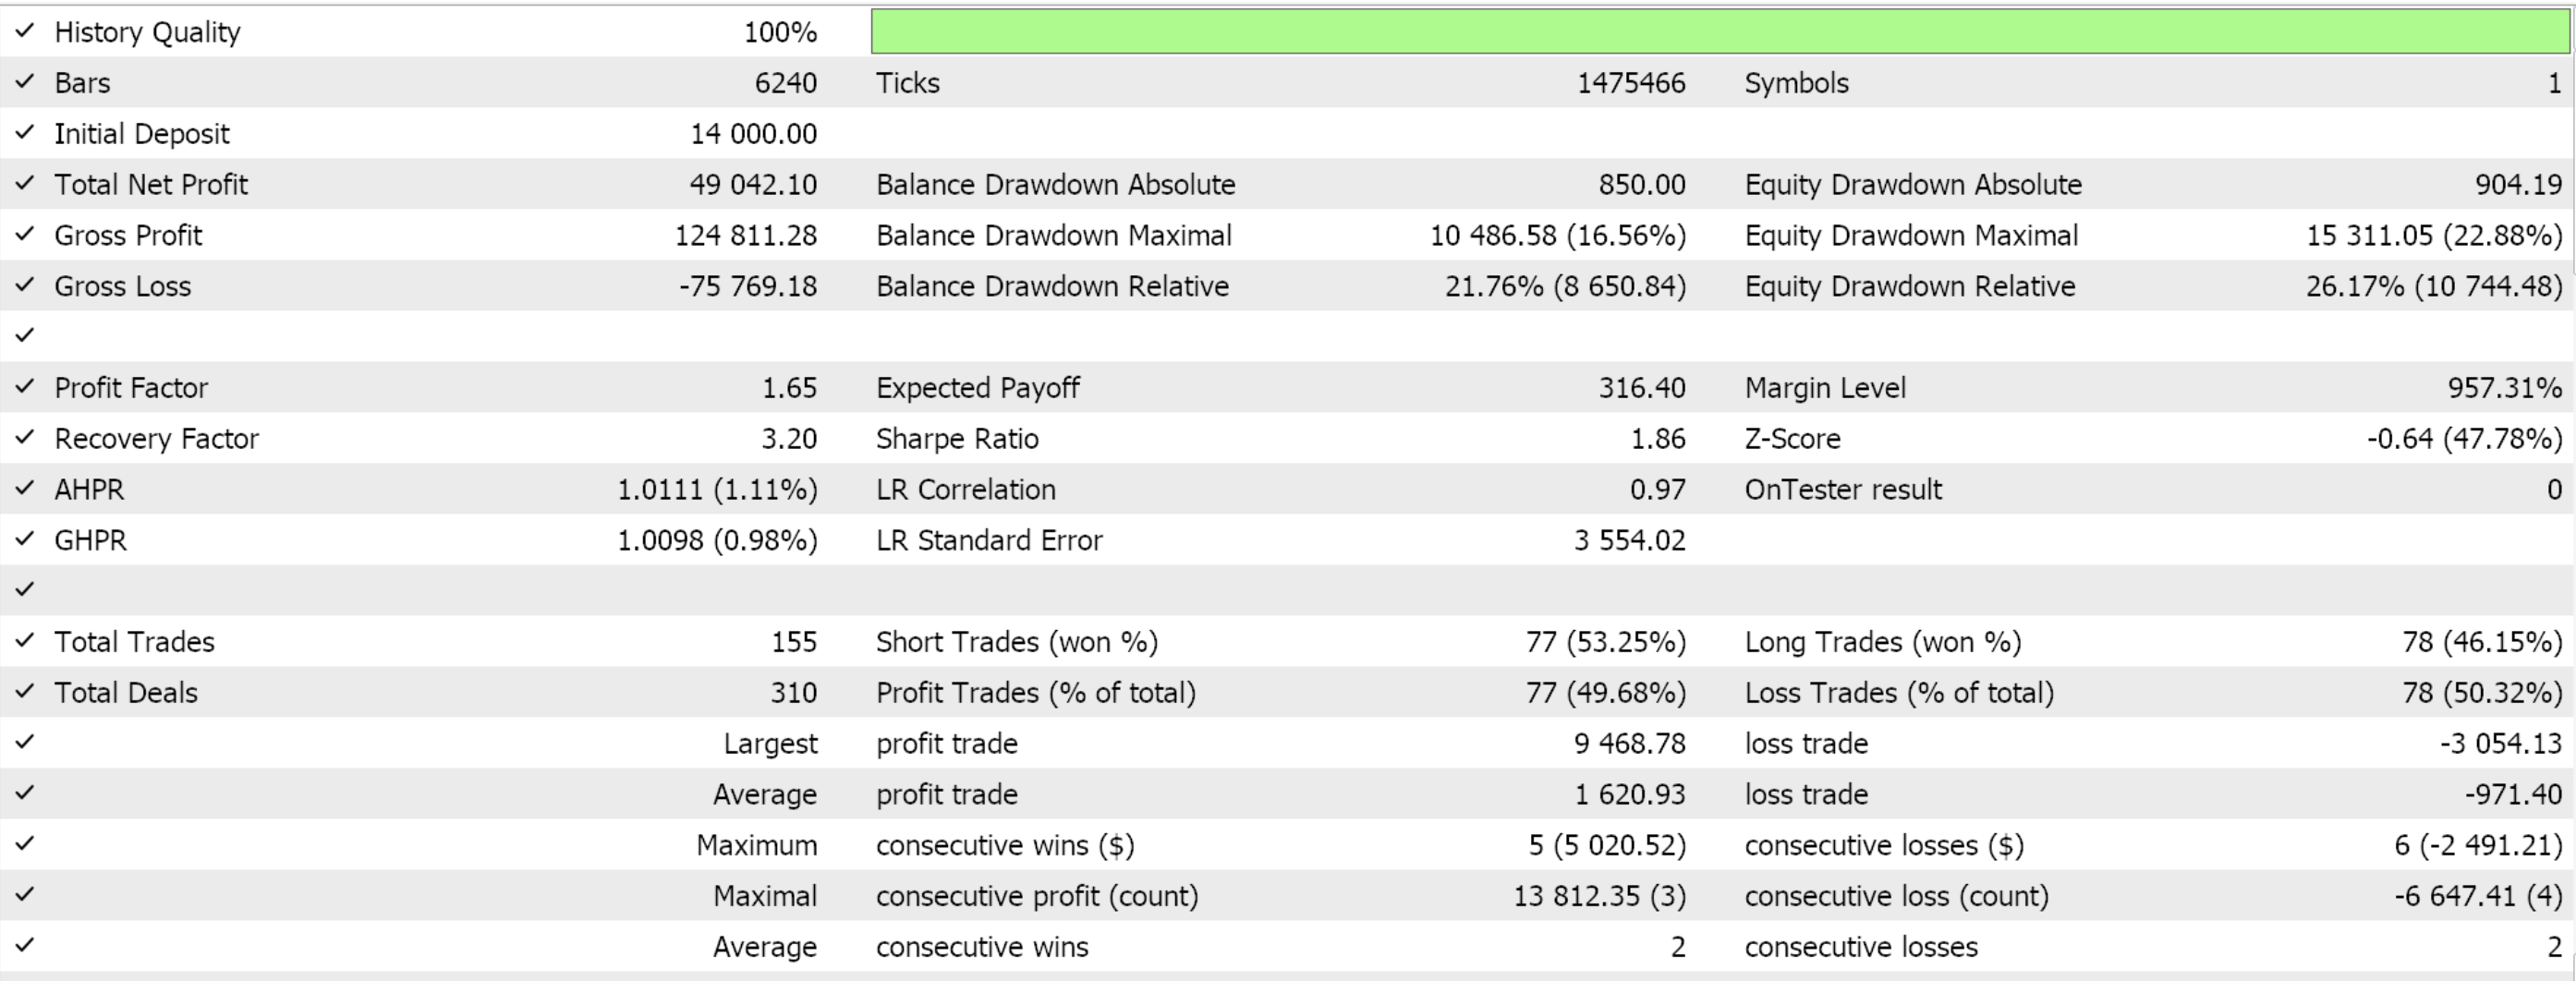
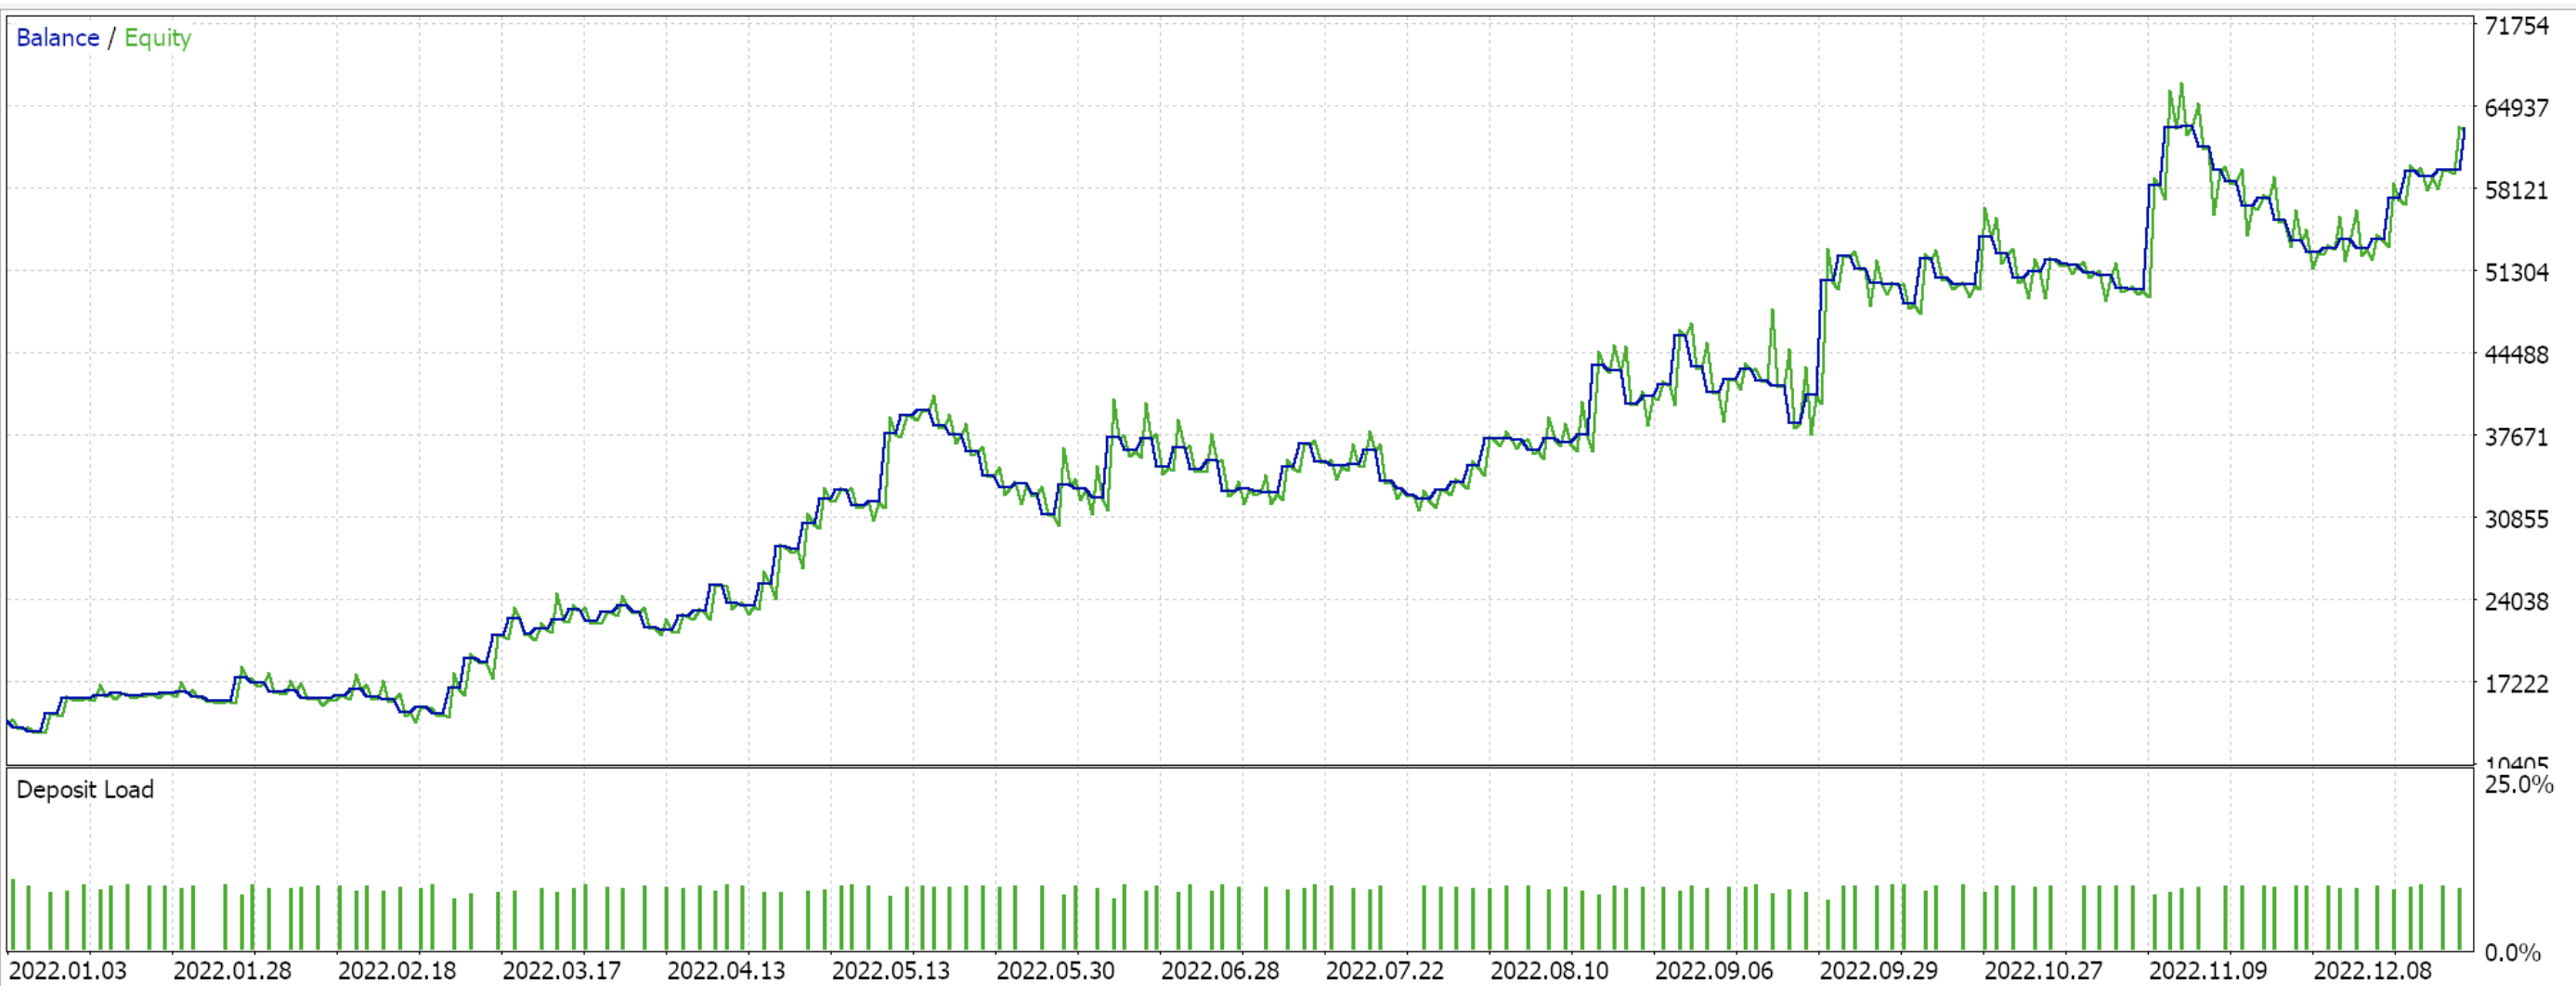
Optimization and test runs can be performed on a pattern by pattern basis as we have done above, however for brevity we are only going to do a single run that looks to optimize the use of all patterns at different weights. The results of these are presented below:
ATR in Money Management
Stop loss gaps can be useful in setting position size. This is because, the argument is, if one has an open position then the stop loss is what would cap the maximum loss they would incur in the position, should the trade go against them. Therefore, by measuring the tick value of a stop loss gap, one can come up with a notional value of a position size in lots that would trigger no more than that set percentage of their free margin at that time.
Once armed with a stop loss level and a maximum risk percent, we can get the lots which in theory would cap our losses. This is in theory because stops do not guarantee price. They are only triggered if that price is available, which is why January 2015 was devastating for traders of the CHF. What then is the best insurance? Minimal and responsible position sizing. If we adopt the same 3 different possible stop loss methods which we had above with the trailing stop, this is how we would implement 3 parallel patterns for a custom money management class:
//+------------------------------------------------------------------+
//| Getting lot size for open long position.                         |
//+------------------------------------------------------------------+
double CMoneyATR::CheckOpenLong(double price, double sl)
{  if(m_symbol == NULL)
      return(0.0);
//--- select lot size
   double lot;
   if(price == 0.0)
      lot = m_account.MaxLotCheck(m_symbol.Name(), ORDER_TYPE_BUY, m_symbol.Ask(), m_percent);
   else
      lot = m_account.MaxLotCheck(m_symbol.Name(), ORDER_TYPE_BUY, price, m_percent);
//---
   double result  = 0.0, results = 0.0;
   price =m_symbol.Bid();
//--- if the model 0 is used and "ATR-Based Stop Loss"
   if(((m_patterns_usage & 0x01) != 0))
   {  IsPattern_0(price, POSITION_TYPE_BUY);
      result += m_pattern_0 * price;
      results += m_pattern_0;
   }
//--- if the model 1 is used and "ATR-MA-Channel Stop Loss"
   if(((m_patterns_usage & 0x02) != 0))
   {  IsPattern_1(price, POSITION_TYPE_BUY);
      result += m_pattern_1 * price;
      results += m_pattern_1;
   }
//--- if the model 2 is used and "ATR-SAR-Channel Stop Loss"
   if(((m_patterns_usage & 0x04) != 0))
   {  IsPattern_2(price, POSITION_TYPE_BUY);
      result += m_pattern_2 * price;
      results += m_pattern_2;
   }
//---
   if(results > 0)
   {  result /= results;
      double _risk = (fabs(m_symbol.Bid()-result)/m_symbol.Point())*(m_symbol.TickSize()/m_symbol.Point())*m_symbol.TickValue();
      _risk /= m_account.FreeMargin();
      _risk *= 100.0;
      double _risk_lots = m_percent/_risk;// where m_percent is also max risk
      lot = fmin(2.0*lot, fmax(_risk_lots, m_symbol.LotsMin()));
   }
//--- return trading volume
   return(Optimize(lot));
}
//+------------------------------------------------------------------+
//| Getting lot size for open short position.                        |
//+------------------------------------------------------------------+
double CMoneyATR::CheckOpenShort(double price, double sl)
{  if(m_symbol == NULL)
      return(0.0);
//--- select lot size
   double lot;
//---
   if(price == 0.0)
      lot = m_account.MaxLotCheck(m_symbol.Name(), ORDER_TYPE_SELL, m_symbol.Bid(), m_percent);
   else
      lot = m_account.MaxLotCheck(m_symbol.Name(), ORDER_TYPE_SELL, price, m_percent);
//---
   double result  = 0.0, results = 0.0;
   price =m_symbol.Ask();
//--- if the model 0 is used and "ATR-Based Stop Loss"
   if(((m_patterns_usage & 0x01) != 0))
   {  IsPattern_0(price, POSITION_TYPE_SELL);
      result += m_pattern_0 * price;
      results += m_pattern_0;
   }
//--- if the model 1 is used and "ATR-MA-Channel Stop Loss"
   if(((m_patterns_usage & 0x02) != 0))
   {  IsPattern_1(price, POSITION_TYPE_SELL);
      result += m_pattern_1 * price;
      results += m_pattern_1;
   }
//--- if the model 2 is used and "ATR-SAR-Channel Stop Loss"
   if(((m_patterns_usage & 0x04) != 0))
   {  IsPattern_2(price, POSITION_TYPE_SELL);
      result += m_pattern_2 * price;
      results += m_pattern_2;
   }
//---
   if(results > 0)
   {  result /= results;
      double _risk = (fabs(result-m_symbol.Ask())/m_symbol.Point())*(m_symbol.TickSize()/m_symbol.Point())*m_symbol.TickValue();
      _risk /= m_account.FreeMargin();
      _risk *= 100.0;
      double _risk_lots = m_percent/_risk;// where m_percent is also max risk
      lot = fmin(2.0*lot, fmax(_risk_lots, m_symbol.LotsMin()));
   }
//--- return trading volume
   return(Optimize(lot));
}
This approach, besides having a weakness in being overly dependent on the stop loss price being available, does from time to time run the risk of assigning overly large lot sizes, in cases where the stop loss gap is very small. That’s why we normalize the lots to not exceed double the lots we would get at the default risk percent of the free-margin. This risk percent (m_percent) therefore serves 2 purposes, one it defines our lots' ceiling if we are to buy lots with it acting as a percentage of free margin, secondly it also defines the notional maximum percentage of free margin that we would lose if our stop loss was at an established level.
Test runs from some of the best optimization results, again with similar settings as above, do give us the following results:
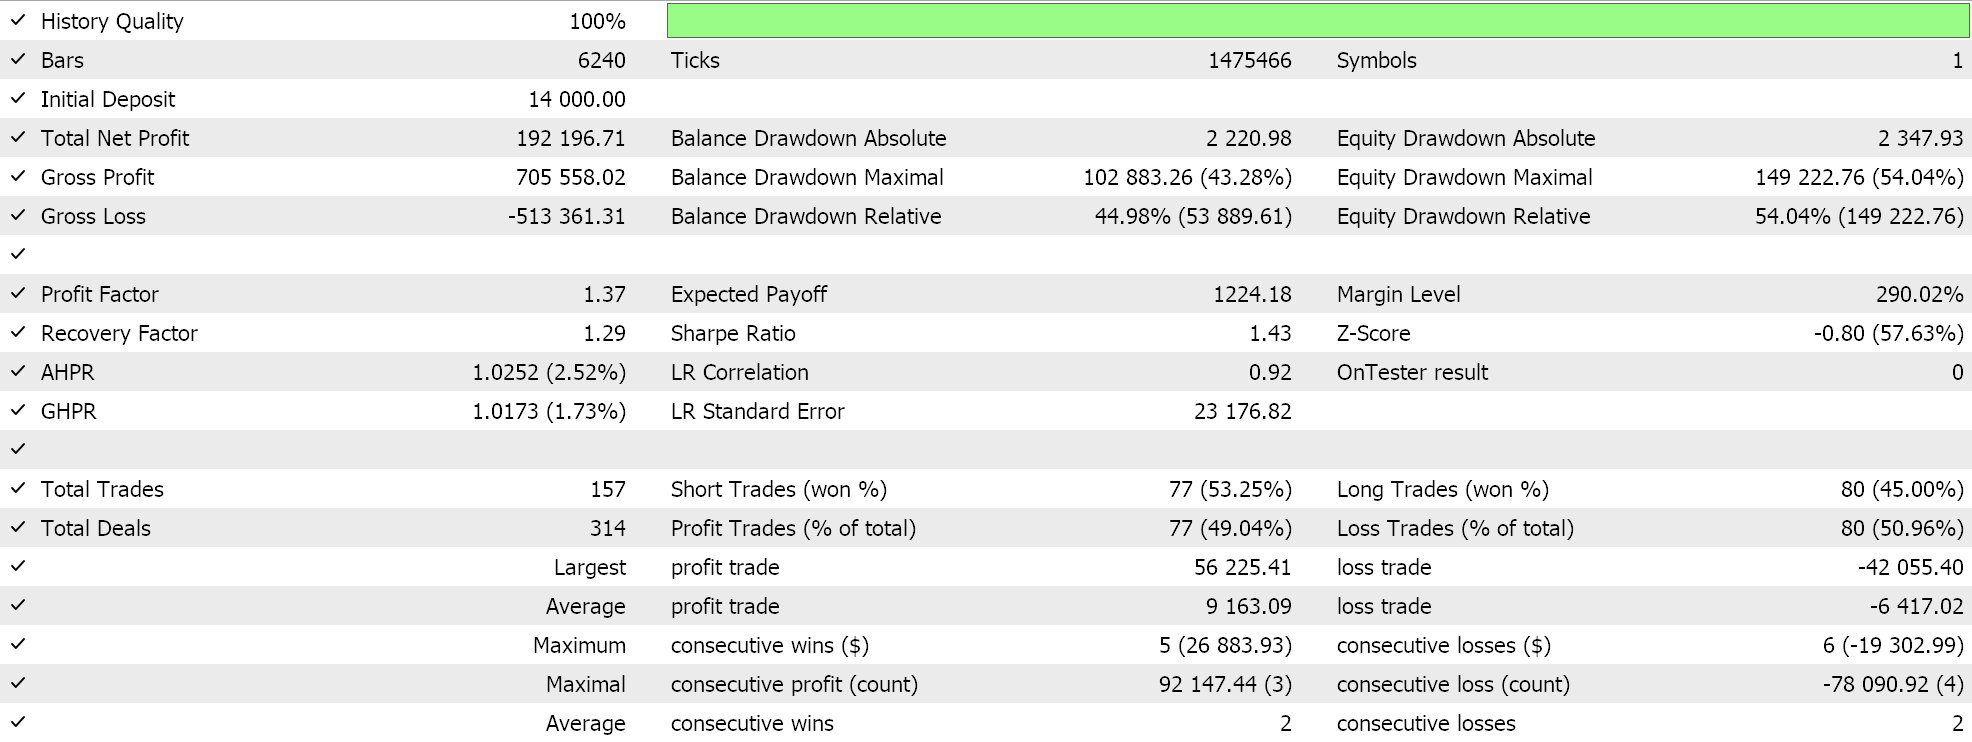
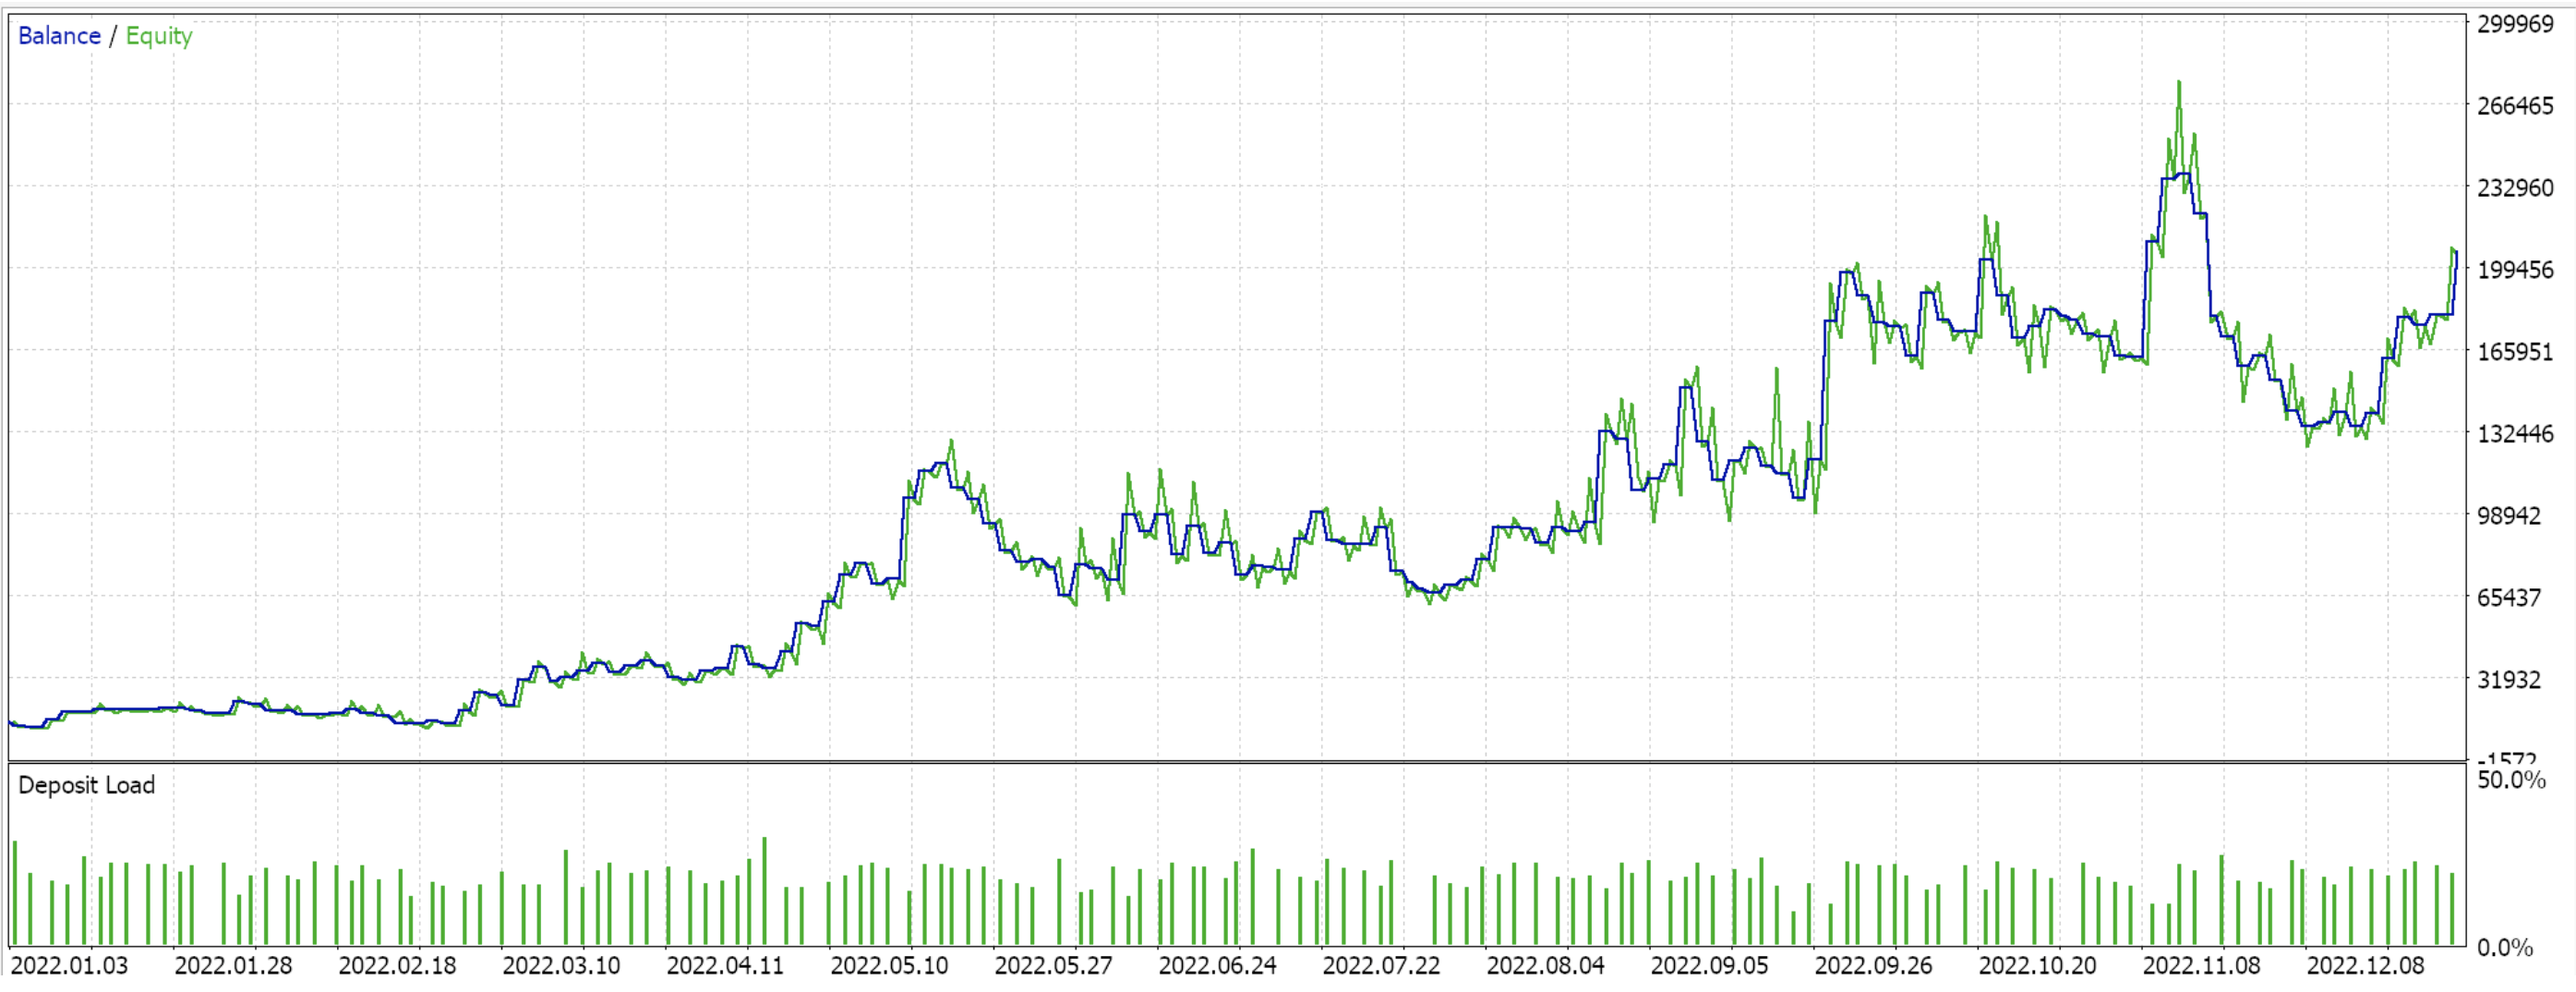
Once again, we did not make test runs on a per-pattern basis but simply optimized our Expert Advisor to use all patterns, albeit at different weights, as was the case above with the trailing stops.
Conclusion
We have wrapped up our look at the ADX indicator that we had considered in the last article, and have also started and concluded the ATR indicator. Quite a few different ideas and implementations of the ATR have been put forward in this article; however, they have not been coded or tested, for brevity. The reader therefore is welcome to take these further by having their own implementations and testing, ideally on an even wider variety of symbols and on more historical data, to get a better grasp of what is suitable to their circumstances.
Warning: All rights to these materials are reserved by MetaQuotes Ltd. Copying or reprinting of these materials in whole or in part is prohibited.
This article was written by a user of the site and reflects their personal views. MetaQuotes Ltd is not responsible for the accuracy of the information presented, nor for any consequences resulting from the use of the solutions, strategies or recommendations described.
 Neural Network in Practice: Straight Line Function
 Creating a Trading Administrator Panel in MQL5 (Part V): Two-Factor Authentication (2FA)
 Connexus Helper (Part 5): HTTP Methods and Status Codes
 Feature selection and dimensionality reduction using principal components
- Free trading apps
- Over 8,000 signals for copying
- Economic news for exploring financial markets
You agree to website policy and terms of use