
Synthetic Bars - A New Dimension to Displaying Graphical Information on Prices
Introduction
In technical analysis, the vast majority of active traders use traditional bar or candlestick charts. It is commonly known that they differ in time scale based on which they are plotted. In other words, one traditional time bar or candlestick reflects the range of price fluctuations over a certain period of time. They have four common base prices: open, high, low and close.
An impulse to studies in this direction was given by the fact that traditional bar charts, although very popular, have one quite substantial drawback. This drawback becomes very obvious when such charts are used in trading systems where trading signals are formed upon the completion of the last bar.
Synthetic Bars
A trading signal during strong and sudden movements is very often formed when the price has already passed its momentum stage and is giving traders a chance to "jump into the last car".
In most cases, this is a quite risky signal as the possibility of the price to bounce is considerable in comparison with the further movement in the direction of the initial impulse. A typical example of emergence of such a signal is shown below. Conditions for emergence of trading signals are represented by combinations of moving averages crossovers.
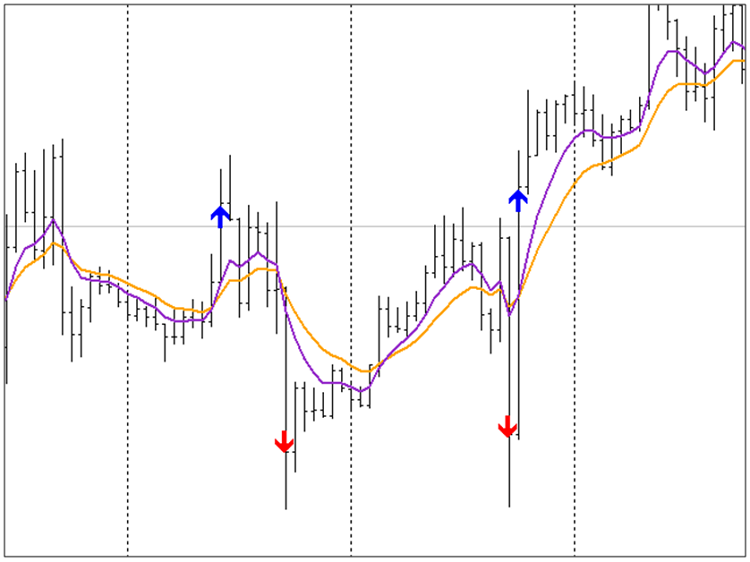
Fig. 1. Moving averages crossovers in the time bar chart
This problem was earlier solved by the development and implementation of such price display methods as Renko, Kagi or Point and Figure charts.
All of these charts are based on a single parameter - height of the displayed box or a fixed price move. However they haven't gained widespread acceptance as in spite of having an advantage in terms of good timing of trading signals, they also had a number of disadvantages of a somewhat different nature.
First, it is quite difficult to use these charts together with well-known and popular technical analysis indicators. Second, they are very peculiar in appearance which is quite different from that of a traditional bar chart. It was giving rise to a problem of getting used to another price display style.
Considering the above, it was decided to develop such a price display method that would combine the advantages of the fixed box height charts (Renko, Kagi or Point and Figure charts) and of the traditional bar chart. It was called a synthetic bar.
The main principle behind the synthetic bar is not the time factor like in traditional bars but the price movement factor. This means that there may be one synthetic bar in the chart (for hours) until the price starts moving, whereas a strong movement may result in a lot more than one bar over just a minute interval.
In other words, there is no time binding in this type of display, hence the time scale in the synthetic chart does not play any role. Besides, the resulting synthetic bars are not in the least different from traditional time bars in their appearance and can be used together with any MetaTrader 4 indicators.
These bars are almost identical to the usual time bars with the only difference being that they all have the same height. The figure below shows the same section of the chart as in the figure above, only using synthetic bars.
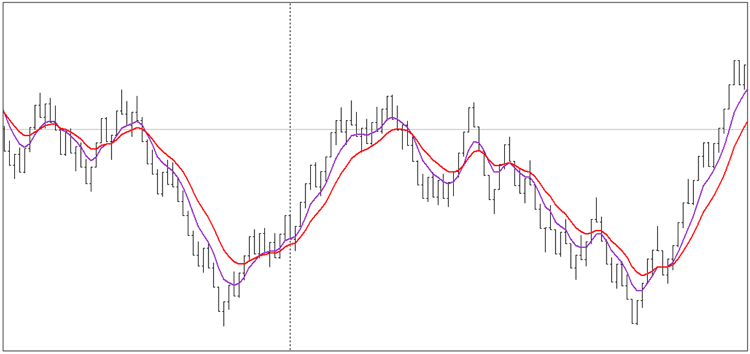
Fig. 2. Moving averages crossovers in the synthetic bar chart
How are synthetic bars plotted? To start off, the main and only parameter is set - bar height in points. Then a specially designed indicator begins to store and analyze all incoming ticks.
Synthetic Bar Plotting Algorithm
Let us have a look at the process of plotting synthetic bars. E.g. start with the first bar. The first tick is saved as the OPEN price. The next tick will either be HIGH or LOW price depending on whether the new price is higher or lower than the OPEN price level.
HIGH or LOW prices are further updated, provided that they break maximum or minimum values of the previous HIGH or LOW. That said, if the next price makes the difference between HIGH and LOW bigger than the specified bar height value, the bar will be closed and the new bar will start forming. A characteristic feature of this bar is that its CLOSE price will always be equal to either HIGH or LOW.
This indicator was developed on the basis of the Period Converter script included in the standard MetaTrader 4 terminal package. The code of the indicator is provided in the attached file.
Using the Indicator
This indicator is somewhat more complicated in use than standard indicators. The indicator should first be placed in the folder where you place your custom indicators. Then you need to open a 1-minute chart for a required currency pair and attach to it our indicator "synbar.mq4".

Fig. 3. Data preparation
Once the indicator has processed the history of 1-minute bars, it will generate a new chart of M9 time dimension. You can open it from the main menu "File - Open Offline" and then select the "Instrument Symbol", M9 - "Open".

Fig. 4. Opening a synthetic bar chart
You can further work with this chart as usual, provided that both M1 and M9 charts are open on your desktop.
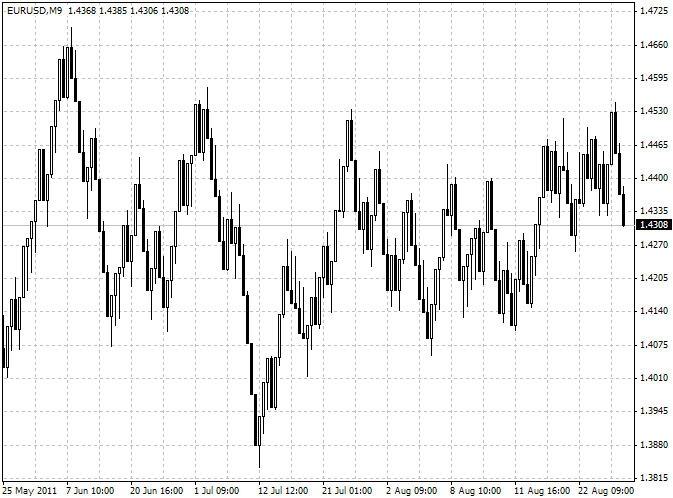
Fig. 5. EURUSD chart plotted using synthetic bars
You will be able to attach to it all sorts of indicators, draw lines on it, place graphical objects, etc., the only limitation being that Expert Advisors will not operate on this chart.
However this limitation was successfully addressed by the script with Expert Advisor functions. Scripts, curiously enough, function properly on this chart. Unfortunately, this article does not intend to cover M9 chart scripting issues and will not deal with them at this point.
To ensure proper operation of the indicator, you should allow DLL imports.

Fig. 6. Expert Advisor settings
The indicator has only two parameters. The first one, most critical and prime is the bar height.
- The parameter ExtBarHeight is set in points (points as defined by the trading server). E.g., if a point is a four-digit number, enter the usual integral number of points you would like to set. If a point is a five-digit number, multiply the integral number of points by 10.
- SplitOnLine is an auxiliary parameter that only determines the way the chart is displayed. If you want to get a static chart, set FALSE as the parameter value. If you want to get a chart with a dynamic formation of bars, set TRUE.
It is clear that the chart type depends on the bar height set by ExtBarHeight. This will also greatly affect the performance of your trading system signals. The bar height is in fact an additional parameter and can, in a number of cases, be the only one.
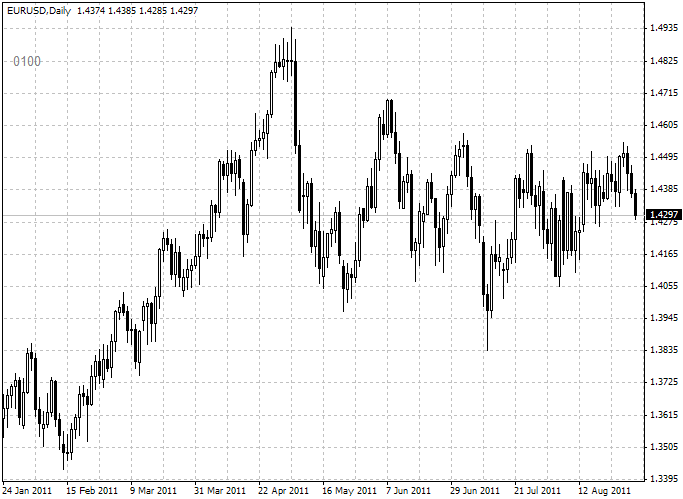
Fig. 7. EURUSD chart, daily bars
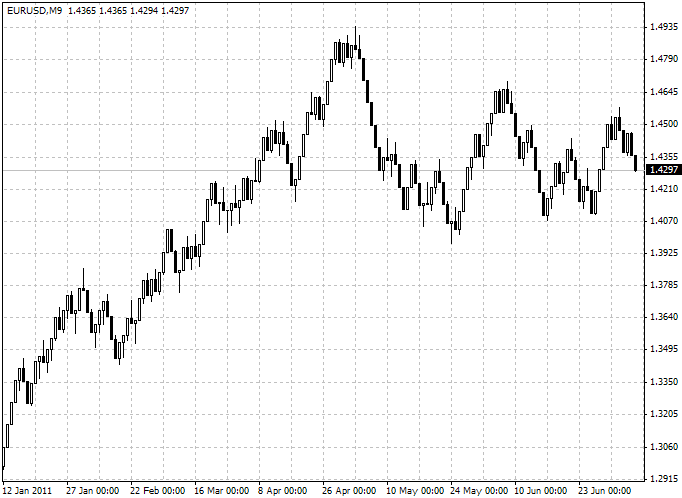
Fig. 8. EURUSD chart, synthetic bars
Conclusion
The fact that trading signals are bound to time can be avoided by using synthetic bars thus getting an opportunity to receive trading signals before the completion of the traditional time bar. In addition, these charts look "smoother", without strong jerky movements. We can point out the following feature:
- Since the trading signal can be formed at any moment, you need to ensure constant monitoring of such charts.
Among the disadvantages is the following: if the market "explodes" and forms a gap much greater than the height value of the synthetic bar, the chart might be rendered post factum. This means that:
- Even if trading signals shown in the chart under such circumstances are quite attractive, it will be impossible to work them out as there is no broker who would allow to trade within a gap.
Translated from Russian by MetaQuotes Ltd.
Original article: https://www.mql5.com/ru/articles/1353
 Trader's Kit: Drag Trade Library
 The Simple Example of Creating an Indicator Using Fuzzy Logic
 A Few Tips for First-Time Customers
 AutoElliottWaveMaker - MetaTrader 5 Tool for Semi-Automatic Analysis of Elliott Waves
- Free trading apps
- Over 8,000 signals for copying
- Economic news for exploring financial markets
You agree to website policy and terms of use
I couldnt get the EA version to compile. Im getting an error on the RegisterWindow call.
Chances are you didn't put the new WinUser32.mqh in the include directory.
This post is almost 2 years old. Can anyone tell me if any efforts have been made towards making it possible to trade from this synthetic bar charts. What is the ultimate point to build and test an EA that doesn't work on a non standard chart ?
Was at least a way to send signals from an offline chart ( like when to place a sell or a buy, close an order or all ) developed yet that I cannot find ?
Seriously, watching an offline chart working nicely and having an EA that performs acceptable in back test and not being able to use it doesn't bother anyone ?
I hope there is a way and someone will point me in the right direction.
Thanks