WaveTheory Fully automatic calculation
- Indikatoren
- Kaijun Wang
- Version: 7.10
- Aktualisiert: 11 April 2023
- Aktivierungen: 5
Bei diesem Indikator handelt es sich um einen Indikator für die automatische Wellenanalyse, der sich perfekt für den praktischen Handel eignet!
Hinweis: Ich bin es nicht gewohnt, westliche Namen für die Welleneinstufung zu verwenden. Aufgrund des Einflusses der Namenskonvention von Tang Lun (Tang Zhong Shuo Zen) habe ich die Grundwelle als Stift und das sekundäre Wellenband als Segment bezeichnet Gleichzeitig hat das Segment die Trendrichtung benannt (diese Benennungsmethode wird in zukünftigen Notizen verwendet, lassen Sie mich Ihnen zuerst sagen), aber der Algorithmus hat wenig mit der Windungstheorie zu tun und sollte es auch nicht sein verwirrt Es spiegelt die sich ständig ändernden und komplexen Betriebsregeln wider, die in meiner Marktanalyse zusammengefasst sind .
Das Band wurde standardisiert und definiert, sodass es für verschiedene Personen nicht mehr unterschiedlich ist. Die Zeichenmethode der künstlichen Interferenz wurde eliminiert, die eine Schlüsselrolle bei der strengen Analyse des Markteintritts spielt.
Die Verwendung dieses Indikators ist gleichbedeutend mit einer Verbesserung der Ästhetik der Handelsoberfläche, dem Verzicht auf den ursprünglichen K-Line-Handel und dem Aufstieg auf eine neue Handelsebene. Wenn er nicht für den Handel gedacht ist, wird er auch die Wahrnehmung der Kunden im Hinblick auf die Werbung verbessern.
Indikatorinhalt:
1. Grundwelle (Stift) : Zuerst finden wir den Wendepunkt der Grundschwankung im Preisschwankungsprozess. Natürlich ist seine Ordnung gering, was eine Grundlage für den nächsten Berechnungsschritt darstellt.
2. Sekundärwellenband ( Segment ) : Auf der Grundlage der Grundwelle wird durch Algorithmusanalyse ein offensichtlicheres Sekundärwellenband erhalten. Das Sekundärwellenband bietet eine Analysebasis für die Welle.
3. Welle ( Welle ): Sie hat einen klareren Trend und eine klarere und intuitivere Richtung. Um zu analysieren, ob eine Welle anhält, müssen Sie sich die Form des sekundären Bandes ansehen und die Zusammensetzung des sekundären Bandes analysieren, um nachfolgende Vorhersagen zu erhalten der Welle.
4. Kanal: Der Kanal wird mithilfe der linearen Regression berechnet.
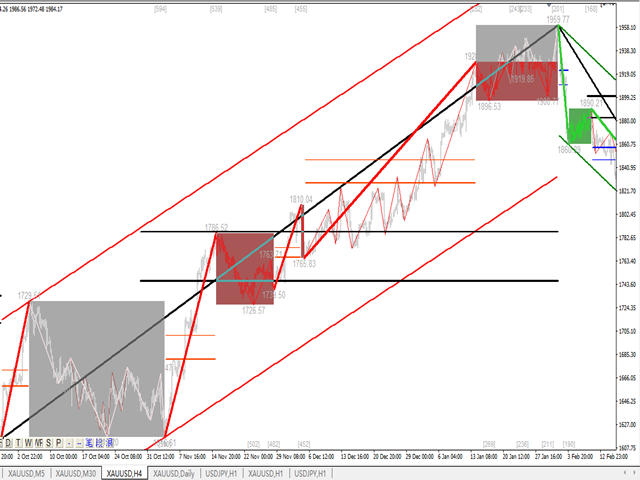
5. Retracement: Am Ende jedes Bandes werden zwei wichtige Retracements der Welle angezeigt. Die relative Stärke dieser wichtigen Retracements und der tatsächlichen Retracements, die durch den tatsächlichen Kampf bestimmt werden, bestimmt die Dynamik des Trends.
6. Schwingungsbereich: Der Schwingungsbereich ist in der Anzeige markiert.
Indikatoren in Aktion:
1. Die praktische Theorie basiert auf der grundlegenden Wellentheorie und der Tao-Theorie.
2. Die praktische Theorie entsteht aus der tatsächlichen Praxis. Sie werden etwas gewinnen, wenn Sie das Bild tausendmal lesen.
3. Ursprünglich wollte ich einige praktische Erfahrungen schreiben, aber nachdem ich dies geschrieben hatte, stellte ich fest, dass der Operationsplan für verschiedene Sorten und Stärken leicht angepasst wurde. Der Handel ist wie ein im Sand vergrabener Thread , auch wenn man das Seil fängt. Aber der Sand verändert ständig seine Form.
4. Nachdem Sie die Quantifizierung zur Definition von Wellen verwendet haben, wird der Handel einfach und effektiv, der Trend wird sehr deutlich, Sie haben den allgemeinen Trend vor Augen und alles wird einfach und effektiv.
5. Ob es sich um den Handel auf der linken oder rechten Seite handelt, ob es sich um einen Trendhandel oder einen Schockhandel handelt, jeder muss den Rhythmus, das Niveau, das potenzielle Niveau und den Zeitpunkt des Trends und Schocks spüren äußerst wichtig.
6. Um Wellen und Handelswellen zu verstehen, müssen Sie eine mehrstufige und mehrzyklische Analyse durchführen.
Praxiserfahrung:
1. Obwohl die Wellentheorie und die Tao-Theorie in Büchern niedergeschrieben wurden, handelt es sich nicht um Diagramme, die den Gesetzen natürlicher Schwankungen vollständig entsprechen. Während des eigentlichen Transaktionsanalyseprozesses werden viele schwierig zu handhabende Situationen auftreten.
2. Im Folgenden können wir den Markt in zwei Typen unterteilen: den geordneten und analysierbaren Markt und den ungeordneten Markt.
3. Es gibt Trends und Schocks im geordneten und analysierbaren Markt. Dieser Markt kann von uns analysiert werden, d. h. der Teil, der kartiert und handelbar ist, wird weiterhin die Merkmale aufweisen Ordnung, damit Wir damit genügend Gewinn machen können
4. Bei ungeordneten Marktbedingungen erscheinen Schwankungen ungeordnet, was sich von Schocks unterscheidet. Sie können nicht an ungeordneten Marktbedingungen teilnehmen und es in Unordnung vermeiden.
Es eignet sich besser für Gold, Rohöl, Pfund, Bitcoin und andere stark im Trend liegende Produkte.


这套波浪系统非常棒,解决了缠论的画线段问题,从级别的不断递推,分析行情有帮助,感谢作者