WaveTheory Fully automatic calculation
- Indicadores
- Kaijun Wang
- Versão: 7.10
- Atualizado: 11 abril 2023
- Ativações: 5
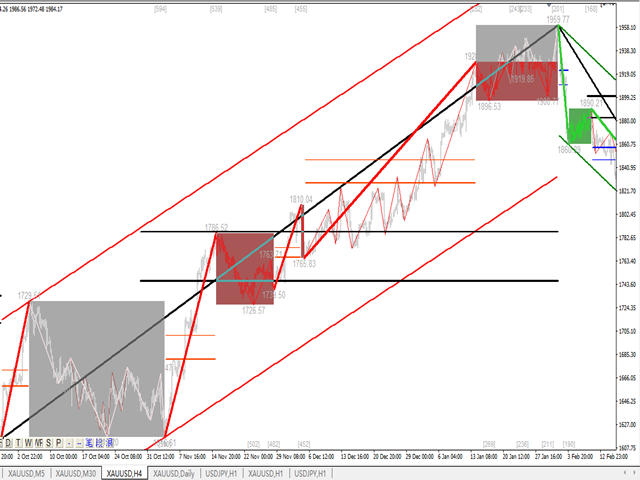
Este indicador é um indicador para análise automática de ondas que é perfeito para negociações práticas!
Nota: Não estou acostumado a usar nomes ocidentais para classificação de ondas. Devido à influência da convenção de nomenclatura de Tang Lun (Tang Zhong Shuo Zen), nomeei a onda básica como uma caneta e a banda de onda secundária como um segmento . ao mesmo tempo, o segmento tem a direção da tendência. O segmento de tendência principal é nomeado (esse método de nomenclatura será usado em notas futuras, deixe-me dizer primeiro), mas o algoritmo tem pouco a ver com a teoria do enrolamento e não deveria ser. confuso Reflete as regras operacionais complexas e em constante mudança resumidas pela minha análise do mercado.
A banda foi padronizada e definida para que não seja mais diferente para pessoas diferentes. Foi eliminado o método de desenho de interferência artificial, que desempenha um papel fundamental na análise rigorosa da entrada no mercado.
Usar este indicador equivale a melhorar a estética da interface de negociação, abandonando a negociação original da linha K e levando você a um novo nível de negociação. Se não for para negociação, também melhorará a percepção do cliente em termos de publicidade.
Conteúdo do indicador:
1. Onda básica (caneta) : Primeiro, encontramos o ponto de viragem da flutuação básica no processo de flutuação de preços.É claro que a sua ordem é baixa, o que fornece uma base para o próximo passo de cálculo.
2. Banda de onda secundária ( segmento ) : Com base na onda básica, uma banda de onda secundária mais óbvia é obtida através da análise de algoritmo. A banda de onda secundária fornece uma base de análise para a onda.
3. Onda ( onda ): Tem uma tendência mais clara e uma direção mais clara e intuitiva. Para analisar se uma onda continua, é necessário observar o formato da banda secundária e analisar a composição da banda secundária para obter previsões subsequentes. da onda.
4. Canal: O cálculo do canal utiliza regressão linear.
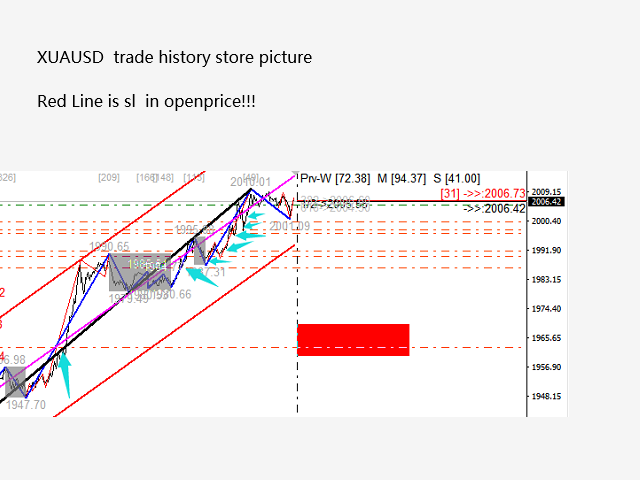
5. Retração: Duas retrações importantes na onda serão exibidas no final de cada banda. A força relativa dessas retrações importantes e as retrações reais determinadas pelo combate real determinam o impulso da tendência.
6. Faixa de oscilação: A faixa de oscilação está marcada no indicador.
Indicadores em ação:
1. A teoria prática vem da teoria básica das ondas e da teoria Tao.
2. A teoria prática vem da prática real. Você ganhará algo depois de ler a imagem mil vezes.
3. Originalmente, eu queria escrever alguma experiência prática, mas depois de escrever isto, descobri que o plano de operação foi ligeiramente ajustado para diferentes variedades e diferentes forças. A negociação está sendo constantemente escrita e atualizada. , mesmo que você pegue a corda, mas a areia continua mudando de formato.
4. Depois de usar a quantificação para definir ondas, a negociação se tornará simples e eficaz, a tendência ficará muito clara, você terá a tendência geral em mente e tudo se tornará simples e eficaz.
5. Quer se trate de negociação à esquerda ou à direita, quer se trate de negociação de tendência ou de choque, este conjunto de indicadores tem a sua resposta. extremamente importante.
6. Para compreender as ondas e as ondas comerciais, você deve realizar análises multiníveis e multiciclos.
Experiência prática:
1. Embora a teoria das ondas e a teoria do Tao tenham sido escritas em livros, não são diagramas que estejam completamente em conformidade com as leis das flutuações naturais. Durante o processo real de análise de transações, serão encontradas muitas situações difíceis de lidar.
2. Abaixo podemos dividir o mercado em dois tipos, o mercado ordenado e analisável e o mercado desordenado.
3. Existem tendências e choques no mercado ordenado e analisável. Este mercado pode ser analisado por nós, ou seja, a parte que pode ser mapeada e negociável. Uma vez estabelecida esta parte da ordem, continuará a ter as características de. ordem, para que possamos obter lucro suficiente com isso
4. Em condições desordenadas de mercado, as flutuações parecerão desordenadas, o que é diferente dos choques.Não se pode participar em condições desordenadas de mercado.
É mais adequado para ouro, petróleo bruto, libra, bitcoin e outros produtos de alta tendência.


这套波浪系统非常棒,解决了缠论的画线段问题,从级别的不断递推,分析行情有帮助,感谢作者