• Обзор
  • Отзывы (2)
  • Обсуждение (8)
  • Что нового

WaveTheory Fully automatic calculation

5

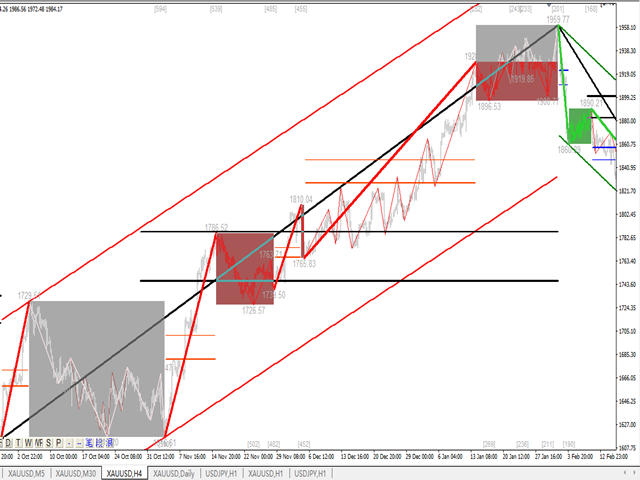
Этот индикатор представляет собой идеальный индикатор волнового автоматического анализа для практической торговли!

Стандартизированное определение диапазона больше не является волной для разных людей, и рисунок антропогенных помех устранен, что играет ключевую роль в строгом анализе подхода. =》Increase the choice of international style mode, (red fall green rise style)

⭐⭐⭐      На данный момент при покупке со скидкой! ⭐⭐⭐

Содержание индекса:

1.    Базовая волна: Сначала мы нашли точку перегиба основного колебания в процессе колебания цены.Конечно, его приказ не слишком силен, что дает основу для следующих расчетов.

2.    Вторичная полоса : на основе основной волны более очевидная вторичная полоса получается с помощью анализа алгоритма, а вторичная полоса обеспечивает основу для анализа волн.

3.    Волна: есть более четкий тренд и более четкое и интуитивно понятное направление. Чтобы проанализировать, продолжается ли волна, вам нужно посмотреть на форму вторичной волновой полосы и проанализировать состав вторичной волны, чтобы получить последующий прогноз волна.

4.    Канал: при расчете канала используется метод линейной регрессии.

5.    Ретрейсмент: два важных ретрейсмента в волне будут отображаться в конце каждой волны. Относительная сила этих важных ретрейсментов в реальном бою и фактический ретрейсмент определяют импульс тренда.

6.    Интервал колебаний: на индикаторе отмечается интервал колебаний.

Индикатор боя:

1. Источником реальной теории боя является основная теория волн, даосская теория.

2. Теория реального боя больше заимствована из реального боя, и вы всегда выиграете, прочитав картинки тысячу раз.

3. Изначально хотел написать некоторый практический опыт, но я обнаружил, что план операции был немного скорректирован в зависимости от разновидностей и сильных сторон. Транзакция постоянно пишется и обновляется. Транзакция похожа на линию, закопанную в песок, даже если она схватывает веревка, но песок все время меняет форму.

4. Когда волна будет определена количественным анализом, транзакция станет простой и эффективной, тенденция станет очень четкой, общая тенденция останется в сердце, и все станет простым и эффективным.

5. Независимо от того, торгуется ли он слева или справа, идет ли речь о торговле по тренду или колебательной торговле, у этого набора индикаторов есть свои ответы. Каждый должен чувствовать ритм, уровень, импульс и время тренда и шока. чрезвычайно важно.

6. Чтобы понять волны и торговые волны, мы должны анализировать многоуровневые и многопериодные.


Фактический боевой опыт:

1. Теория волн и даосская теория написаны, но они не полностью соответствуют законам естественных флуктуаций. В реальном процессе анализа транзакций будет обнаружено много сложных ситуаций.

2. Ниже мы можем разделить рынок на два типа: рынок с упорядоченным анализом и рынок с неупорядоченной структурой.

3. На упорядоченном и поддающемся анализу рынке наблюдаются тенденции и потрясения. Этот сегмент рынка может быть проанализирован нами, то есть часть, доступная на графике, и торгуемая часть. После того, как эта часть будет заказана, она сохранит обычные характеристики, поэтому Мы можем получить от этого достаточно прибыли

4. Беспорядочный рынок, колебания будут беспорядочными, отличными от потрясений, беспорядочный рынок не может участвовать, собирая деньги по порядку, избегая беспорядка.


Я надеюсь встретить людей, которым суждено, разделить радость совместной торговли и расти вместе!

Он больше подходит для золота, сырой нефти, фунта стерлингов, биткойнов и других популярных разновидностей.

пользователя kjoin.


Отзывы 2
Peng Jin
320
Peng Jin 2023.03.20 04:36 
 

这套波浪系统非常棒,解决了缠论的画线段问题,从级别的不断递推,分析行情有帮助,感谢作者

elite luis
3331
elite luis 2023.03.08 17:15 
 

Amazing indicator, another quality product from Author, Big Thank you! Author is super friendly and responsive, any issue he get it fix fast also he is open to idea suggestions and continously updating to improve his indicators, he is extremely passionate in what he is doing, deserved more than 5 stars for his dedication! Well Done!

Рекомендуем также
Disclaimer : Keep in mind that seasonal patterns are not always reliable. Therefore, thoughtful risk management is crucial to minimize losses.  Seasonal patterns in the financial world are like a well-guarded secret that successful investors use to their advantage. These patterns are recurring price movements that occur during specific periods or around special events. Additionally, there are also intraday patterns that repeat. For example, Uncle Ted from Forex Family suggests examining previou
Introduction to Fractal Pattern Scanner Fractal Indicator refers to the technical indicator that makes use of the fractal geometry found in the financial market. Fractal Pattern Scanner is the advanced Fractal Indicator that brings the latest trading technology after the extensive research and development work in the fractal geometry in the financial market. The most important feature in Fractal Pattern Scanner is the ability to measure the turning point probability as well as the trend probabil
Utilities
Douglas Lucio De Araujo
Indicator with 3 features - Clock : Clock independent of the chart, counting continues even when the market is closed. - Template : After setting up a configuration in any graphic, be it color patterns, indicators, zoom ... The configuration will be copied to all active graphics. - TimeFrame : Set the TimeFrame on a chart, and with just one click all the active charts will be changed to the same TimeFrame.
Market Chopper Indicator - is the manual system for market scalping. Indicator uses most accurate points to enter, when current trend has lost it's power and new one starts. Indicator shows : Enter points(buy/sell arrows), Exit points(Stoploss/Takeprofit arrows). Indicator makes market analysis and adapts to any market, any timeframe showing most relevant strategy for exact conditions. Main Indicator's Features Signals are NOT repaint, late or disappear; Every signal comes at the open of new bar
Introduction This indicator detects volume spread patterns for buy and sell opportunity. The patterns include demand and supply patterns. You might use each pattern for trading. However, these patterns are best used to detect the demand zone (=accumulation area) and supply zone (=distribution area). Demand pattern indicates generally potential buying opportunity. Supply pattern indicates generally potential selling opportunity. These are the underlying patterns rather than direct price action. T
Автоматическая система, которая определяет сигналы на вход по ценовому действию. Также устанавливает на определенном расстоянии от этого ордера другой стоп-ордер, противоположный сигналу на вход. Принцип работы советника Cobalto основан на волатильности рынка - он ищет сильные движения для покупки и продажи. Система предназначена для работы на ECN-счетах с плечом 1:300. Параметры Lot_Management - управление лотом Initial_lot: начальный размер лота для открытия первого ордера. (Размер следующих
To get access to MT4 version please click   here . This is the exact conversion from TradingView: QQE MT4 Glaz-modified by JustUncleL This is a light-load processing and non-repaint indicator. All input options are available. This is not a multi time frame indicator. Buffers are available for processing in EAs. You can message in private chat for further changes you need.
Descriptions A point point is a technical analysis indicator, or calculations, used to determine the overall trend of market over different time frames. This indicator calculate the highest or lowest pivots among left x and right y bars and show the high/low level during that period.   From that, you could clearly see the top resistance & bottom support level and how market goes break out. Instructions pivotLeft - pivot left bar count pivotRight - pivot right bar count pivotHighColor - c
【Super Scanner】Indicator Introduction : The color of the Super Scanner which is green and climbing up means that the price trend is going up.The color of the Super Scanner is red and going down means that the price trend is going down. It is very simple to use it to judge the market trend! What's even better is that the open parameters of the indicators allow investors to adjust. You can adjust【Super Scanner】according to your needs. Adjust it faster to be closer to short-term market fluctuati
Oneiroi
Oleksandr Powchan
5 (1)
Oneiroi trades hard oversold and overbought conditions. On M15 you can achieve a very high hitrate. The system does not trade a lot because meeting the three conditions is quite hard. It will work on any pair and any broker but some are better than others. The EA will work also on small accounts but i would highly recomend to use a 100kcent account. Our Goal is to help you be way more profitable and way more stress free, so you can enjoy the things that are important to you and your fa
Индикатор паттерна 21, 22, 34 ("Флаг") из книги Томас Н. Булковский "Полная энциклопедия графических ценовых моделей". Параметры: Alerts - Включение алертов при появлении стрелки Push - Отправка Push-уведомления при появлении стрелки (требуется настройка в терминале) PeriodBars - Период в барах K - Дополнительный параметр влияющий на точность распознавания и форму паттерна. Действие параметра будет заметно, если включенны не все варианты паттерна (не все три параметра Expanding, Tapered, Para
Hello Seasonal Traders! The seasonality trading strategy works because the smart money is doing the same thing every single year more often than not. The month of the year or the day of the week and the time of the day can call the shots in any market.   The seasonal cycle is another useful tool in your trading arsenal. I'm not saying to trade solely off of seasonality and forget anything else. I'm only giving you another trading tool that you can incorporate into your own trading strategy to ga
The Rainbow Multiple Moving Average (MMA) is a technical analysis tool used to identify trends and potential reversal points in financial markets. It is based on a system of moving averages that are designed to be used together, with each moving average having a different time frame. The Rainbow MMA consists of multiple exponential moving averages (EMAs) of different lengths, with each EMA plotted in a different color. Typically, the Rainbow MMA includes EMAs of 2, 3, 4, 5, 6, 7, 8, 9, 10, 11, a
Phoenix MT5
Vladimir Gribachev
Безындикаторный советник,  не использует индикаторы, сетку ордеров или мартингейл. Количество трейдов в день может быть строго ограничено, в рынке одновременно может находится только 1 ордер. Сделки защищены стоп-лоссом, он может быть как реальный так и виртуальный (скрытый от брокера). Работает во время азиатской сессии, на спокойном рынке. Имеет встроенную защиту от проскальзываний и расширения спреда. Не переносит сделки с Понедельника на Пятницу, имеет функцию  автоматического закрытия торго
Candle EA MT5
Mansour Babasafary
4.38 (45)
This expert is based on patterns The main patterns of this specialist are candlestick patterns Detects trends with candlestick patterns It has a profit limit and a loss limit, so it has a low risk The best time frame to use this expert is M30 time frame The best currency pairs to use with this expert is the EURUSD, GBPUSD, AUDUSD, USDCAD currency pairs Attributes: Can be used in the EURUSD, GBPUSD, AUDUSD, USDCAD  currency pairs Can be used in M30, H1, H4 time frames Has profit limit an
The indicator determines a special pattern of Joe Dinapoli. It gives very high probability buy and sell signals. Indicator does not repaint. Indicator Usage Buy Signal ''B'' Entry : Market buy order at signal bar close Stop : Low of signal bar Take Profit : First swing high Sell Signal ''S'' Entry : Market sell order at signal bar close Stop : High of signal bar Take Profit : First swing low Indicator Parameters Fast EMA : External Parameter (should be kept as default) Slow EMA: External Param
Индикатор Magneto Weekly Pro отображает: Недельные важные линии поддержки и сопротивления (выделены желтым, красным и синим цветами). Основные недельные цели (выделены белым цветом). Недельные паттерны возврата цены (обозначаются красными флажками). Применение индикатора Magneto Pro можно использовать и как дополнение к существующей стратегии, и как самодостаточную торговую стратегию. Данный продукт состоит из двух индикаторов, работающих на разных временных промежутках, и предназначен для скал
TrendDecoder Scanner MT5
Christophe Pa Trouillas
5 (1)
Получайте сигналы TrendDECODER для нескольких активов и нескольких временных единиц | Определите лучшую временную единицу для входа | Максимизируйте свою прибыль и выигрышные сделки Индикатор и скринер без перерисовки и задержки - идеален для ручной и автоматической торговли - для всех активов и всех временных единиц. 49$ за первые 50 копий - затем 99$ . После покупки, пожалуйста, оставьте комментарий или отзыв, и мы отправим вам ДОПОЛНИТЕЛЬНЫЙ индикатор стоимостью 99$. О чем это? Этот с
I do not have the exact indicator for MT4 but the nearest possible look alike can be downloaded from here . Also you may check this link . This is the exact conversion from TradingView: "Donchian Trend Ribbon" By "LonesomeTheBlue". One of the coolest indicators out there to detect trend direction and strength. As a trader you always need such indicator to avoid getting chopped in range markets. There are ten buffers as colors to use in EAs also. The indicator is loaded light and non-repaint. Not
The indicator will plot a line on the chart that corresponds to the closing price of the previous day, and based on this, it will plot the percentage levels of change in the price of the asset in question. It can be used on any asset. Period: Determine whether the closing price should be daily, weekly or monthly Minimum percentage: Determine the percentage for the indicator to plot the levels and sub-levels on the chart, eg 0.5 it will plot on the chart a line for every 0.5% variation and the su
Введение Индикатор Harmonic Volatility стал первым техническим инструментом, использующим уровни Фибоначчи для анализа волатильности на рынке. Индикатор объединяет коэффициенты Фибоначчи (0.618, 0.382 и т.д.) с торговой волатильностью. Изначально индикатор Harmonic Volatility разрабатывался как способ преодолеть ограничение и слабые стороны угла Ганна, также известного как "Веер Ганна". Мы продемонстрировали, что индикатор Harmonic Volatility можно использовать на графике аналогично углу Ганна (
Индикатор определяет паттерны гармоник (XABCD) согласно разработок H.M.Gartley ( "Profits in the Stock Market" , 1935г). Проецирует D-point -- как точку в перспективной проекции (в настройках указать параметр ProjectionD_Mode = true ). Не перерисовывает. На закрытии бара рабочего тайм-фрейма, если в течение Patterns_Fractal_Bars баров последняя обнаруженная точка паттерна не сдвинулась - возникает стрелка на графике (в направлении предполагаемого движения цены). С этого момента стрелка остается
Matreshka
Dimitr Trifonov
5 (1)
Самотестируемый и самооптимизируемый и ндикатор Matreshka: 1. Я вляется интерпретацией Теории Волнового Анализа Элиотта. 2. За основу взят принцип индикатора типа ZigZag, а волны строятся на принципе интерпретации теории ДеМарка. 3. Фильтрует волны по длине и высоте. 4. Рисует до шести уровней ZigZag одновременно , отслеживая волны разных порядков. 5. Отмечает Импульсные и Откатные волны. 6. Рисует стрелки для открытия позиций 7. Рисует три канала. 8. Отмечает уровни поддержки и сопротивления. 9
!! FLASH SALE !!   Over 80% off !!     For ONE week only. Now only $47 - normally $297! >>>      Ends on 30 June 2023 - Don't miss it! The Consolidation Breakout Alerts Indicator will revolutionize your trading strategy. Our innovative indicator offers unique buy and sell arrows when price breaks out from consolidation, allowing you to get in at the most optimal entry with minimal risk and maximum reward potential. Never again will you miss out on the lucrative trading opportunities available
Индикатор паттерна 31 ("Длинный остров") из книги Томас Н. Булковский "Полная энциклопедия графических ценовых моделей". Параметры: Alerts - Включение алертов при появлении стрелки   Push - Отправка Push-уведомления при появлении стрелки (требуется настройка в терминале) GapSize - Минимальный размер гэпа в пунктах ArrowType - Значок: от 1 до 17 ArrowVShift - Сдвиг значков по вертикали  ShowLevels - Показывать уровни ColUp - Цвет линий вверх ColDn - Цвет линий вниз   Auto5Digits - Автоматическ
Индикатор Elliott Wave Trend был разработан для научного подсчета волн на основе шаблонов и паттернов, впервые разработанных Чжон Хо Сео. Индикатор нацелен на максимальное устранение нечеткости классического подсчета волн Эллиотта с использованием шаблонов и паттернов. Таким образом индикатор Elliott Wave Trend в первую очередь предоставляет шаблон для подсчета волн. Во-вторых, он предлагает структурный подсчет волн Wave Structural Score, которые помогает определить точное формирование волны. Он
Представляем RSIScalperPro - революционный индикатор на основе RSI для MetaTrader 5, специально разработанный для скальпинга на графике одной минуты. С RSIScalperPro у вас будет мощный инструментарий для точных сигналов входа и выхода, чтобы повысить вашу торговую эффективность. RSIScalperPro использует два различных индикатора RSI, которые предоставляют четкие сигналы для уровней перекупленности и перепроданности. Вы можете настроить временные периоды и ограничительные значения двух RSI в соот
Impulse fractals indicator - is counter-trend oriented complex market fractal pattern.  Market creates bull/bear impulse, trend starts, fractals on impulsed wave are an agressive pullback signals. Buy arrow is plotted when market is bearish and it's impulse showed up-side fractal, and sell arrow is plotted when market is bullish and it's impulse showed dn-side fractal. Main indicator's adjustable inputs : impulsePeriod - main period of impulse histogram  filterPeriod  - smoothes impulse accordi
С этим продуктом покупают
Прежде всего стоит подчеркнуть, что этот торговый индикатор не перерисовывается, не перерисовывает и не отставает, что делает его идеальным как для ручной, так и для роботизированной торговли. Руководство пользователя: настройки, вводы и стратегия. Атомный аналитик - это индикатор ценового действия PA, который использует силу и импульс цены, чтобы найти лучший край на рынке. Оборудованный расширенными фильтрами, которые помогают убирать шумы и ложные сигналы, и повышают торговый потенциал. Испо
The AT Forex Indicator MT5 is a sophisticated trading tool designed to provide traders with a comprehensive analysis of multiple currency pairs. This powerful indicator simplifies the complex nature of the forex market, making it accessible for both novice and experienced traders. AT Forex Indicator uses advanced algorithms to detect trends, patterns and is an essential tool for traders aiming to enhance their forex trading performance. With its robust features, ease of use, and reliable signal
Reversal First Impulse levels (RFI)          INSTRUCTIONS     RUS      -      ENG          Рекомендуем использовать с индикатором - TPSpro  TREND PRO -  Version MT4             Важным ключевым элементом в трейдинге являются зоны или уровни, от которых принимаются решения о покупке или продаже торгового инструмента. Несмотря на попытки крупных игроков скрыть свое присутствие на рынке, они неизбежно оставляют следы. Наша задача заключалась в том, чтобы научиться находить эти следы и правильно их
Bill Williams Advanced предназначен для автоматического анализа графика по системе " Profitunity " Билла Уильямса. Индикатор анализирует сразу четыре таймфрейма. Инструкция/Мануал ( Обязательно читайте перед приобретением ) Преимущества 1. Автоматически анализирует график по системе "Profitunity" Билла Уильямса. Найденные сигналы помещает в таблицу в углу экрана. 2. Оснащён трендовым фильтром по индикатору Аллигатор. Большинство сигналов системы рекомендуется использовать только по тренду.
Currently Price  20% OFF  ( for unlimited use ) Indicator   USER MANUAL , trade setups, solving issues, etc :  Direct Download Here     (  for users only  ) Hello World! Introducing.. SMCpro tool and Indicator for  MetaTrader 5 , a cutting-edge feature designed to revolutionize your trading experience. With innovative ICT Smart Money Concept, you gain unparalleled insight into market dynamics, empowering you to make informed trading decisions like never before. SMC Indicator built on th
Следуйте тренду.  Да, дождитесь сигнала на вход, будь то покупка или продажа, и входите по цене, а прибыль берется при изменении линии рисования, фиксации прибыли или при появлении противоположного сигнала. Это очень просто и работает на всех. валюты, металлы, индексы и на всех кадрах.   Как войти?  Дождитесь сигнала на покупку или продажу и входите по нему. Зафиксировать или зарезервировать прибыль можно после изменения линии рисунка или появления противоположного сигнала.
IVISTscalp5
Vadym Zhukovskyi
5 (5)
Что нового в индикаторе прогнозов iVISTscalp5 (Версия 10)? iVISTscalp5 – это авторская система прогнозов для любого финансового инструмента на неделю вперед (для быстрого скальпинга по уровням времени). iVISTscalp5 – инструмент для простого изучения и понимания финансового рынка. 1)     Индикатор прогнозов iVISTscalp5 полностью переписан на другой язык программирования ( C ++), что ускорило загрузку и обработку данных. Разное графическое отображение прогнозов на графике будет еще проще для п
3 Indicators in 1 indicator Strategy based on price action Made specifically for the best forex currency pairs Can be used in the best time frame of the market at a very reasonable price This indicator is basically 3 different indicatos . But we have combined these 3 indicators in 1 indicator so that you can use 3 indicators at the lowest price. All three strategies are based on price action. But based on different trends. Long term, medium term and short term Attributes : No repaintin
note: this indicator is for METATRADER4, if you want the version for METATRADER5 this is the link:  https://www.mql5.com/it/market/product/108106 TRENDMAESTRO ver 2.4 TRENDMAESTRO recognizes a new TREND in the bud, he never makes mistakes. The certainty of identifying a new TREND is priceless. DESCRIPTION TRENDMAESTRO identifies a new TREND in the bud, this indicator examines the volatility, volumes and momentum to identify the moment in which there is an explosion of one or more of these data a
«Пиранья» - автономная торговая система, определяющая уровни перекупленности и перепроданности на графике. Красная и синяя зоны отображают уровни перекупленности и перепроданности соответственно. Вход в сделку обозначен стрелками: стрелка вниз в красной зоне для "sell" и стрелка вверх в синей зоне для "buy". Уровень Тейк профита обозначен зеленой средней скользящей. Важные особенности: Регулировка уровня Тейк профита при изменении положения зеленой средней скользящей. Возможность усреднения пр
40% СКИДКА НА РОЖДЕСТВО! ПОВЫШЕНИЕ ЦЕНЫ ДО $250 С 1 ЯНВАРЯ! Представляем GoldenGate Entries: Революционное Торговое Решение! Откройте для себя революционный подход к торговле с GoldenGate Entries (GGE), передовым индикатором, разработанным для повышения вашего опыта торговли. GGE предоставляет обширный набор функций, чтобы предоставить пользователям точность и уверенность в их торговых решениях. Пары: Любые (валюты - товары - акции - акции - криптовалюты) Таймфреймы: 15 минут до H1 Ос
Welcome to the world of SMC (Smart Money Concepts) Trading, where we empower traders with the tools and knowledge to make smarter trading decisions. Our latest addition to our suite of trading tools is the SMC Trading Pro indicator, version 1.0. Key Features: Major Market Structure Identification with BODY break. Order Block must be in Major Swing ( not Small Swing ). Order Block with Fair Value Gap Detection. Order Block in Discount | Premium zone. Filter for only Bullish, Bearish or All Order
Доброго времени суток! Представляю вам торговый технический индикатор для синтетических индексов брокера Deriv. Данный индикатор работает ТОЛЬКО с нижеуказанными индексами: Boom 300 Index Boom 500 Index Boom 1000 Index Crash 300 Index Crash 500 Index Crash 1000 Index Индикатор создан для подачи сигналов на открытие среднесрочных сделок в сторону Спайков. Но вы можете открывать сделки и в противоположную Спайкам сторону, на свой риск. Торговля только на М1. Другие ТФ не гарантируют корректную р
WHY IS OUR FXACCCURATE LS MT5 THE PROFITABLE ? PROTECT YOUR CAPITAL WITH RISK MANAGEMENT Gives entry, stop and target levels from time to time. It finds Trading opportunities by analyzing what the price is doing during established trends. POWERFUL INDICATOR FOR A RELIABLE STRATEGIES We have made these indicators with a lot of years of hard work. It is made at a very advanced level. Established trends provide dozens of trading opportunities, but most trend indicators completely ignore them!
Introduction to X3 Chart Pattern Scanner X3 Cherart Pattern Scanner is the non-repainting and non-lagging indicator detecting X3 chart patterns including Harmonic pattern, Elliott Wave pattern, X3 patterns, and Japanese Candlestick patterns. Historical patterns match with signal patterns. Hence, you can readily develop the solid trading strategy in your chart. More importantly, this superb pattern scanner can detect the optimal pattern of its kind. In addition, you can switch on and off individu
Introducing the South African Sniper indicator created by a small group of traders with a few years trading trading the financial market profitably . This is a plug and play indicator that provides you with  BUY and SELL (SNIPER ENTRY) signals with TARGET and trail stops. The indicator Works with all MT5 trading instruments. The indicator uses previous  chart data as receipt to speculate on future market moves.  "The South African Sniper indicator community are very happy with the indicator an
Сложно найти и дефицит по частоте, дивергенции являются одним из самых надежных торговых сценариев. Этот индикатор автоматически находит и сканирует регулярные и скрытые расхождения, используя ваш любимый осциллятор. [ Руководство по установке | Руководство по обновлению | Устранение неполадок | FAQ | Все продукты ] Легко торговать Находит регулярные и скрытые расхождения Поддерживает много известных генераторов Реализует торговые сигналы на основе прорывов Отображает подходящие уровни ст
Инструмент для скальпинга на Deriv Описание: Данный торговый индикатор разработан для трейдеров, специализирующихся на скальпинге. Он предоставляет сигналы для торговли в направлении краткосрочных ценовых движений. Индикатор оптимизирован для работы на таймфрейме М1 и поддерживает индексы Boom и Crash (300, 500, 1000). Осталось 3 копии по 350$ Следующая цена 5 ти копий 500$ Индикатор будет продан в ограниченном кол-ве. Особенности: Направление торговли: в сторону краткосрочных ценовых движени
Trend Trading - это индикатор, предназначенный для получения максимальной прибыли от трендов, происходящих на рынке, путем определения времени отката и прорыва. Он находит торговые возможности, анализируя, что делает цена во время установленных тенденций. [ Руководство по установке | Руководство по обновлению | Устранение неполадок | FAQ | Все продукты ] Торгуйте на финансовых рынках с уверенностью и эффективностью Прибыль от устоявшихся тенденций без проволочек Признать прибыльные откаты,
All in One package includes the  Oscillator Predictor ,  MACD Predictor ,  Thrust Scanner  and  Advanced Fibonacci  indicators which are mandatory for applying  Dinapoli  trade plans.  Please visit below links for detailed explanations of indicators. Advanced Fibonacci Indicator =>  https://www.mql5.com/en/market/product/107933 Thrust Scanner Indicator =>  https://www.mql5.com/en/market/product/52829 Overbought /Oversold Predictor indicator => https://www.mql5.com/en/market/product/52628 Macd
Свинг-трейдинг - это первый индикатор, предназначенный для обнаружения колебаний в направлении тренда и возможных разворотов. Он использует базовый подход свинговой торговли, широко описанный в торговой литературе. Индикатор изучает несколько векторов цен и времени для отслеживания направления совокупного тренда и выявляет ситуации, когда рынок перепродан или перекуплен и готов к исправлению. [ Руководство по установке | Руководство по обновлению | Устранение неполадок | FAQ | Все продукты ]
MetaForecast M5
Vahidreza Heidar Gholami
5 (2)
MetaForecast предсказывает и визуализирует будущее любого рынка на основе гармонии в данных о ценах. Хотя рынок не всегда предсказуем, если существует узнаваемый паттерн в ценах, то MetaForecast способен предсказать будущее с наибольшей точностью. По сравнению с другими аналогичными продуктами, MetaForecast способен генерировать более точные результаты, анализируя тренды на рынке. Входные параметры Past size (Размер прошлых данных) Указывает количество баров, которые MetaForecast использует дл
ЭТОТ ИНДИКАТОР, ОСНОВАННЫЙ НА ИСКУССТВЕННОМ ИНТЕЛЛЕКТЕ, определяет возможные точки разворота рынка, считывая следы, и ЗАРАНЕЕ сигнализирует о небольших движениях рынка до того, как они произойдут. В отличие от индикаторов цены и объема, которые генерируют «поздние» входы, т. е. когда подтверждение цены или объема уже произошло при изменении направления и, следовательно, часто движение уже закончилось, этот индикатор сигнализирует, основываясь на том, что он читает в след, «КОГДА ДВИЖЕНИЕ ДОЛЖНО
Этот индикатор обнаруживает разворот цены зигзагообразно, используя только анализ ценового действия и канал Дончиана. Он был специально разработан для краткосрочной торговли, без перекраски или перекраски вообще. Это фантастический инструмент для проницательных трейдеров, стремящихся увеличить сроки своих операций. [ Руководство по установке | Руководство по обновлению | Устранение неполадок | FAQ | Все продукты ] Удивительно легко торговать Это обеспечивает ценность на каждом таймфрейме Ре
Индикатор Volume Spread Analysis основан на оригинальном методе Volume Spread Analysis. Он был разработан для быстрого и легкого распознавания паттернов VSA. Несмотря на то, что индикатор выглядит очень просто, это самый сложный инструмент из всех, которые мы когда-либо создавали. Это действительно мощный аналитический инструмент, который генерирует очень надежные торговые сигналы. Поскольку он очень удобен и понятен, он подходит для любого типа трейдера, независимо от его опыта.
Noize Absorption Index - is the manual trading system that measures the difference of pressure between bears forces and bulls forces. Green line - is a noize free index that showing curent situation. Zero value of index shows totally choppy/flat market.Values above zero level shows how powerfull bullish wave is and values below zero measures bearish forces.Up arrow appears on bearish market when it's ready to reverse, dn arrow appears on weak bullish market, as a result of reverse expectation.
Индикатор формирует входные сигналы по БИНАРНЫМ ОПЦИОНАМ, рисуя стрелку на графике и издавая звуковой сигнал. ВРЕМЯ РАБОТЫ: 6.00 GMT/ 17.00 GMT (не рекомендуется после 17.00 GMT и ночью из-за слишком низкой волатильности и отсутствия объемов) ПАРЫ: EUR/USD (@EU6), GBP/USD (BP6). Таймфреймы: 1,2,3,5,10,15 минут Лучший таймфрейм: 3 минуты СРОК ГОДНОСТИ: 1 свеча Индикатору для работы нужны реальные объемы (без тиковых объемов): он не работает на спотовых парах EUR/USD, GBP/USD ECC, а на
Introducing the Power Trade Plus indicator designed by a small group of traders with a few years of experience trading the market profitably.  The Power Trade Plus is derived from the Power Trade indicator,  the indicator strive in powerful sniper entries and take profit levels,  with an algorithm that's can determine the markets volatility and Provides entries based on the current market volatility. This indicator is much more effective in stock ,currencies and indices.
Индикатор Gann Squares представляет собой мощный инструмент для анализа рынка, основанный на математических концепциях, представленных W.D. Gann в его статье "Математическая формула для прогнозирования рынка." Этот индикатор включает в себя техники Ганна, связанные с квадратными числами, такими как 144, 90 и 52, а также Квадрат 9. Кроме того, он включает метод по использованию Квадрата 9 в сочетании с каналами и паттерном звезды. Руководство пользователя и использование: Перед использованием это
EQ Cutrim Theory
Marco Aurelio Santos Costa
Ронал Кутрим в течение 14 лет был увлеченным математиком с более чем 10-летним опытом работы на финансовом рынке. Концепция теории проста - найти дисбаланс между покупателями и продавцами. В этом есть большой смысл, потому что ничто не растет вечно, ничто не падает вечно.   Когда вы находите актив с математической вероятностью неравновесного равновесия, это отличный способ заняться трейдингом:  Включите субтитры, видео сопровождается субтитрами
Другие продукты этого автора
[跟单系统] T he most friendly Copier interactive interface, the most abundant easy-to-use functions, and the best Copy solution.    EASY   : Easy to use, load and select the Master or SLAVE to use easily FAST:   Quickly copy orders, algorithmic optimal follow-up mechanism, priority calculation of new signals, priority queue processing received special signals Multiple:   1. Support multiple signals to be sent at the same time, multiple accounts can select multiple accounts to copy at the same time 2
The market price usually falls between the borders of the channel. If the price is out of range, it is a trading signal or trading opportunity. Basically, Fit Channel can be used to help determine overbought and oversold conditions in the market. When the market price is close to the upper limit, the market is considered overbought (sell zone). Conversely, when the market price is close to the bottom range, the market is considered oversold (buy zone). However, the research can be used to
KDJ Index 4   交易实用必备工具指标 波浪自动计算指标,通道趋势交易 完美的趋势-波浪自动计算通道计算 , MT4版本 完美的趋势-波浪自动计算通道计算 , MT5版本 本地跟单复制交易 Easy And Fast Copy , MT4版本 Easy And Fast Copy , MT5版本 本地跟单复制交易 模拟试用 Easy And Fast Copy , MT4 模拟账号运行 Easy And Fast Copy , MT5 模拟账号运行 "Cooperative QQ:556024  "  "Cooperation wechat:556024"  "Cooperative email:556024@qq.com" 强烈推荐趋势指标, 波浪的标准自动计算   和   波浪的标准自动计算MT5版本     KDJ指标又叫 随机指标 ,是一种相当新颖、实用的技术分析指标,它起先用于期货市场的分析,后被广泛用于股市的中短期趋势分析,是期货和股票市场上最常用的技术分析工具。 随机指标KDJ一般是用于股票分析的统计体系,根据统计学原理,通过一个特定的周期(常为9日、9周等
[跟单系统] T he most friendly Copier interactive interface, the most abundant easy-to-use functions, and the best Copy solution.    EASY   : Easy to use, load and select the Master or SLAVE to use easily  FAST:   Quickly copy orders, algorithmic optimal follow-up mechanism, priority calculation of new signals, priority queue processing received special signals Multiple:   1. Support multiple signals to be sent at the same time, multiple accounts can select multiple accounts to copy at the same time
Necessary for traders: tools and indicators Waves automatically calculate indicators, channel trend trading Perfect trend-wave automatic calculation channel calculation , MT4 Perfect trend-wave automatic calculation channel calculation , MT5 Local Trading copying Easy And Fast Copy , MT4 Easy And Fast Copy , MT5 Local Trading copying For DEMO Easy And Fast Copy , MT4 DEMO Easy And Fast Copy , MT5 DEMO 砖图 Renko PRO->>>   The display of the brick map on the main map. The Renko chart ideal
FREE
Торговля пивотами: 1.pp pivot 2. r1 r2 r3, s1 s2 s3 Necessary for traders: tools and indicators Waves automatically calculate indicators, channel trend trading Perfect trend-wave automatic calculation channel calculation , MT4 Perfect trend-wave automatic calculation channel calculation , MT5 Local Trading copying Easy And Fast Copy , MT4 Easy And Fast Copy , MT5 Local Trading copying For DEMO Easy And Fast Copy , MT4 DEMO Easy And Fast Copy , MT5 DEMO Сотрудничество QQ: 556024 " Со
FREE
лучший партнер для трейдеров!       Торговый помощник: Это очень многофункциональное торговое пособие. Разработка непростая, пожалуйста, поддержите Pro Click to jump K Торговый помощник Pro MT5 Инструкция по работе с торговым помощником Основные настройки использования Базовый: Переключатель выбора языка поддержки (в настоящее время поддерживает китайский и английский языки)           автоматическое распознавание языка Поддержка привязки       горячая клавиша для открытия
FREE
Necessary for traders: tools and indicators Waves automatically calculate indicators, channel trend trading Perfect trend-wave automatic calculation channel calculation , MT4 Perfect trend-wave automatic calculation channel calculation , MT5 Local Trading copying Easy And Fast Copy , MT4 Easy And Fast Copy , MT5 Local Trading copying For DEMO Easy And Fast Copy , MT4 DEMO Easy And Fast Copy , MT5 DEMO MACD называется скользящей средней конвергенции и расхождения, которая создается на основе дво
FREE
Necessary for traders: tools and indicators Waves automatically calculate indicators, channel trend trading Perfect trend-wave automatic calculation channel calculation , MT4 Perfect trend-wave automatic calculation channel calculation , MT5 Local Trading copying Easy And Fast Copy , MT4 Easy And Fast Copy , MT5 Local Trading copying For DEMO Easy And Fast Copy , MT4 DEMO Easy And Fast Copy , MT5 DEMO Расширенные полосы Боллинджера: 1. Рельс Боллинджера изменит цвет в зависимости от направлен
FREE
Торговля пивотами: 1.pp pivot 2. r1 r2 r3, s1 s2 s3 Necessary for traders: tools and indicators Waves automatically calculate indicators, channel trend trading Perfect trend-wave automatic calculation channel calculation , MT4 Perfect trend-wave automatic calculation channel calculation , MT5 Local Trading copying Easy And Fast Copy , MT4 Easy And Fast Copy , MT5 Local Trading copying For DEMO Easy And Fast Copy , MT4 DEMO Easy And Fast Copy , MT5 DEMO Настоятельно рекомендую трендовые ин
FREE
The market price usually falls between the borders of the channel    .   If the price is out of range , it is a trading signal or trading opportunity  . Basically , Fit Channel can be used to help determine overbought and oversold conditions in the market. When the market price is close to the upper limit, the market is considered overbought (sell zone). Conversely, when the market price is close to the bottom range, the market is considered oversold (buy zone). However, the research can
MACD divergence signals   MACD is called Convergence and Divergence Moving Average, which is developed from the double exponential moving average. The fast exponential moving average (EMA12) is subtracted from the slow exponential moving average (EMA26) to get the fast DIF, and then 2× (Express DIF-DIF's 9-day weighted moving average DEA) Get the MACD bar. The meaning of MACD is basically the same as the double moving average, that is, the dispersion and aggregation of the fast and slow moving a
Necessary for traders: tools and indicators Waves automatically calculate indicators, channel trend trading Perfect trend-wave automatic calculation channel calculation , MT4 Perfect trend-wave automatic calculation channel calculation , MT5 Local Trading copying Easy And Fast Copy , MT4 Easy And Fast Copy , MT5 Local Trading copying For DEMO Easy And Fast Copy , MT4 DEMO Easy And Fast Copy , MT5 DEMO 砖图Renko PRO->>> The display of the brick map on the main map. The Renko chart ideally remo
FREE
K Trade Assistant
Kaijun Wang
4.76 (25)
Лучший партнер для трейдеров!     Торговый помощник: Это очень многофункциональное торговое пособие. Разработка непростая, пожалуйста, поддержите Pro Click to jump K Торговый помощник Pro     Инструкция по работе с торговым помощником Основные настройки использования Базовый: Переключатель выбора языка поддержки (в настоящее время поддерживает китайский и английский языки)       для автоматического определения языка Поддержка привязки       горячая клавиша для отк
FREE
Necessary for traders: tools and indicators Waves automatically calculate indicators, channel trend trading Perfect trend-wave automatic calculation channel calculation , MT4 Perfect trend-wave automatic calculation channel calculation , MT5 Local Trading copying Easy And Fast Copy , MT4 Easy And Fast Copy , MT5 Local Trading copying For DEMO Easy And Fast Copy , MT4 DEMO Easy And Fast Copy , MT5 DEMO «Кооператив QQ: 556024»  "Сотрудничество WeChat: 556024"  «Совместная электронная почта: 55602
FREE
Necessary for traders: tools and indicators Waves automatically calculate indicators, channel trend trading Perfect trend-wave automatic calculation channel calculation , MT4 Perfect trend-wave automatic calculation channel calculation , MT5 Local Trading copying Easy And Fast Copy , MT4 Easy And Fast Copy , MT5 Local Trading copying For DEMO Easy And Fast Copy , MT4 DEMO Easy And Fast Copy , MT5 DEMO Расширенные полосы Боллинджера: 1. Рельс Боллинджера изменит цвет в зависимости от направлен
FREE
Necessary for traders: tools and indicators Waves automatically calculate indicators, channel trend trading Perfect trend-wave automatic calculation channel calculation , MT4 Perfect trend-wave automatic calculation channel calculation , MT5 Local Trading copying Easy And Fast Copy , MT4 Easy And Fast Copy , MT5 Local Trading copying For DEMO Easy And Fast Copy , MT4 DEMO Easy And Fast Copy , MT5 DEMO «Кооператив QQ: 556024»  "Сотрудничество WeChat: 556024"  «Совместная электронная почта: 55602
FREE
Индикаторы для трендовых! Торговая система, построенная на трех скользящих средних. Торгуйте по тренду и позвольте прибыли расти. Necessary for traders: tools and indicators Waves automatically calculate indicators, channel trend trading Perfect trend-wave automatic calculation channel calculation , MT4 Perfect trend-wave automatic calculation channel calculation , MT5 Local Trading copying Easy And Fast Copy , MT4 Easy And Fast Copy , MT5 Local Trading copying For DEMO Easy And Fast Copy , M
FREE
Necessary for traders: tools and indicators Waves automatically calculate indicators, channel trend trading Perfect trend-wave automatic calculation channel calculation , MT4 Perfect trend-wave automatic calculation channel calculation , MT5 Local Trading copying Easy And Fast Copy , MT4 Easy And Fast Copy , MT5 Local Trading copying For DEMO Easy And Fast Copy , MT4 DEMO Easy And Fast Copy , MT5 DEMO Can set the cycle for other varieties of K line graph covered this window, fluctuations obse
FREE
Necessary for traders: tools and indicators Waves automatically calculate indicators, channel trend trading Perfect trend-wave automatic calculation channel calculation , MT4 Perfect trend-wave automatic calculation channel calculation , MT5 Local Trading copying Easy And Fast Copy , MT4 Easy And Fast Copy , MT5 Local Trading copying For DEMO Easy And Fast Copy , MT4 DEMO Easy And Fast Copy , MT5 DEMO Fibo: from KTrade 1. Automatically calculate and analyze the band. -> Get the desired band 2.
FREE
XM Channel
Kaijun Wang
4.67 (3)
The market price usually falls between the borders of the channel . If the price is out of range, it is a trading signal or trading opportunity . Basically, Fit Channel can be used to help determine overbought and oversold conditions in the market. When the market price is close to the upper limit, the market is considered overbought (sell zone). Conversely, when the market price is close to the bottom range, the market is considered oversold (buy zone). However, the research can be used
The market price usually falls between the borders of the channel  . If the price is out of range, it is a trading signal or trading opportunity. Basically, Fit Channel can be used to help determine overbought and oversold conditions in the market. When the market price is close to the upper limit, the market is considered overbought (sell zone). Conversely, when the market price is close to the bottom range, the market is considered oversold (buy zone). However, the research can be used
Necessary for traders: tools and indicators Waves automatically calculate indicators, channel trend trading Perfect trend-wave automatic calculation channel calculation , MT4 Perfect trend-wave automatic calculation channel calculation , MT5 Local Trading copying Easy And Fast Copy , MT4 Easy And Fast Copy , MT5 Local Trading copying For DEMO Easy And Fast Copy , MT4 DEMO Easy And Fast Copy , MT5 DEMO The homeopathic indicator is also called the CCI indicator. The CCI indicator was propos
FREE
Donchian通道(唐奇安通道指标)是用于交易突破的最古老、最简单的技术指标之一。   一般来说,唐奇安通道的宽度越宽,市场波动就越大,而唐奇安通道越窄,市场波动性也就越小 。此外,价格走势可以穿过布林带,但你看不到唐奇安通道的这种特征,因为其波段正在测量特定时期的最高价和最低价。 交易实用必备工具指标 波浪自动计算指标,通道趋势交易 完美的趋势-波浪自动计算通道计算 , MT4版本 完美的趋势-波浪自动计算通道计算 , MT5版本 本地跟单复制交易 Easy And Fast Copy , MT4版本 Easy And Fast Copy , MT5版本 本地跟单复制交易 模拟试用 Easy And Fast Copy , MT4 模拟账号运行 Easy And Fast Copy , MT5 模拟账号运行 唐奇安通道指标计算: 唐奇安上阻力线 - 由过去N天的当日最高价的最大值形成。 唐奇安下支撑线 - 由过去N天的当日最低价的最小值形成。 中心线 - (上线 + 下线)/ 2   唐奇安通道信号   唐奇安通道常用作突破指标。它提供了两种主要类型的突破信号,一个是上阻力线或下支
FREE
Necessary for traders: tools and indicators Waves automatically calculate indicators, channel trend trading Perfect trend-wave automatic calculation channel calculation , MT4 Perfect trend-wave automatic calculation channel calculation , MT5 Local Trading copying Easy And Fast Copy , MT4 Easy And Fast Copy , MT5 Local Trading copying For DEMO Easy And Fast Copy , MT4 DEMO Easy And Fast Copy , MT5 DEMO MACD называется скользящей средней конвергенции и расхождения, которая создается на основе дво
FREE
Лучший партнер для трейдеров!       Инструкция по работе с торговым помощником Основные настройки использования Базовый: Переключатель выбора языка поддержки (в настоящее время поддерживает китайский и английский языки)           автоматическое распознавание языка Поддержка привязки       горячая клавиша для открытия и закрытия позиций       , используйте сочетания клавиш для быстрого открытия и закрытия позиций...       горячие клавиши для закрытия позиций. Разблокировка подд
KTrade Fibo
Kaijun Wang
4.89 (9)
Necessary for traders: tools and indicators Waves automatically calculate indicators, channel trend trading Perfect trend-wave automatic calculation channel calculation , MT4 Perfect trend-wave automatic calculation channel calculation , MT5 Local Trading copying Easy And Fast Copy , MT4 Easy And Fast Copy , MT5 Local Trading copying For DEMO Easy And Fast Copy , MT4 DEMO Easy And Fast Copy , MT5 DEMO Fibo: from KTrade 1. Automatically calculate and analyze the band. -> Get the desired band 2.
FREE
九转序列,源自于TD序列,是因TD序列的9天收盘价研判标准而得名。 汤姆·德马克(Tom DeMark)技术分析界的着名大师级人物,创建了以其名字首字母命名的TD系列的很多指标,价格反转的这个指标就是其中重要的一个,即TD序列。 德马克原版TD序列指标要复杂一些,想研究就自行看关于德马克的资料吧。 这里只说简单的TD序列(九转序列)。 九转序列分为两种结构,低九买入结构和高九卖出结构。 TD高九卖出结构:连续出现的九根K线,这些K线的收盘价都比各自前面的第四根K线的收盘价高,如果满足条件,就在各K线上方标记相应的数字,最后1根就标记为9,如果条件不满足,则K线计数中断,原计数作废重新来数K线。如出现高9,则股价大概率会出现转折。 TD低九买入结构:连续出现的九根K线,这些K线的收盘价都比各自前面的第四根K线的收盘价低,如果满足条件,就在各K线下方标记相应的数字,最后1根就标记为9,如果条件不满足,则K线计数中断,原计数作废重新来数K线。如出现低9,则股价大概率会出现转折。 结构的本质是时间和空间的组合,时间是横轴,空间是纵轴,不同的时间周期和空间大小的组合,形成不同的结构形态,不同
九转序列,源自于TD序列,是因TD序列的9天收盘价研判标准而得名。 汤姆·德马克(Tom DeMark)技术分析界的着名大师级人物,创建了以其名字首字母命名的TD系列的很多指标,价格反转的这个指标就是其中重要的一个,即TD序列。 德马克原版TD序列指标要复杂一些,想研究就自行看关于德马克的资料吧。这里只说简单的TD序列(九转序列)。 九转序列分为两种结构,低九买入结构和高九卖出结构。 TD高九卖出结构:连续出现的九根K线,这些K线的收盘价都比各自前面的第四根K线的收盘价高, 如果满足条件,就在各K线上方标记相应的数字,最后1根就标记为9,如果条件不满足,则K线计数中断,原计数作废重新来数K线。如出现高9,则股价大概率会出现转折。 TD低九买入结构:连续出现的九根K线,这些K线的收盘价都比各自前面的第四根K线的收盘价低,如果满足条件,就在各K线下方标记相应的数字,最后1根就标记为9,如果条件不满足,则K线计数中断,原计数作废重新来数K线。如出现低9,则股价大概率会出现转折。 结构的本质是时间和空间的组合,时间是横轴,空间是纵轴,不同的时间周期和空间大小的组合,形成不同的结构形态,不同
Фильтр:
Peng Jin
320
Peng Jin 2023.03.20 04:36 
 

这套波浪系统非常棒,解决了缠论的画线段问题,从级别的不断递推,分析行情有帮助,感谢作者

elite luis
3331
elite luis 2023.03.08 17:15 
 

Amazing indicator, another quality product from Author, Big Thank you! Author is super friendly and responsive, any issue he get it fix fast also he is open to idea suggestions and continously updating to improve his indicators, he is extremely passionate in what he is doing, deserved more than 5 stars for his dedication! Well Done!

Kaijun Wang
135566
Ответ разработчика Kaijun Wang 2023.03.09 03:04
Thank you for your support.
Ответ на отзыв
Версия 7.10 2023.04.11
>>>>>>>>>>>>>>>
Версия 6.83 2023.03.17
>>>>>>>>>>
Версия 6.82 2023.03.09
>>>>>>>>>>>
Версия 6.81 2023.03.08
>>>>>>>>>>>>>>
Версия 6.8 2023.03.08
>>>>>
1.增加动态组件的大小调整,和自适应大小
2.增加小组件控制,可以删除屏幕中的各项组件,可以多样化加载图表
3.增加国际交易风格的自动切换,自适应国际交易习惯
4.增加震荡区闪烁控制,可以设置关闭.
5.优化更新算法逻辑,优化判断条件细节
6.增加主趋势浪显示
Версия 3.3 2022.03.21
>>>>>>>>>>>
Версия 3.2 2022.03.19
>>>>
1.算法更新
2.纠错更新
Версия 3.1 2021.11.22
>>>>>>>>>>>>
Версия 2.88 2021.06.19
>>>>>
1.更新第一次图表计算计算K限制,0为取消限制....
2.更新指标加载后,关闭指标后复原图表的各项设置
Версия 2.6 2021.03.29
>>>>>>
修复长时间间隔运行未计算的空白段
Версия 2.5 2020.12.28
>>>>>>>>>>
Версия 2.2 2020.12.27
>>>>>>增加风格自动设置为白底,可关闭
Версия 2.0 2020.12.19
>>>>>>>>>>
updata alert function...
Версия 1.20 2020.12.06
>>>>>>>>>算法优化
Версия 1.10 2020.10.20
>>>>更新通道显示不友好