Chart Patterns All in One
- Indikatoren
- Davit Beridze
- Version: 2.2
- Aktualisiert: 16 August 2024
- Aktivierungen: 5
`All in One Chart Patterns`
Chartmuster sind unter Tradern ein kontroverses Thema; einige glauben, dass sie zuverlässige Signale liefern, während andere dies nicht tun. Unser "Chart Patterns All-in-One"-Indikator zeigt verschiedene Chartmuster an, damit Sie diese Theorien selbst testen können. Die Rentabilität dieser Muster spiegelt nicht die Effektivität des Indikators wider, sondern bewertet vielmehr die Muster selbst. Der "Chart Patterns All-in-One"-Indikator ist ein hervorragendes Werkzeug, um diese Muster zu visualisieren, sodass Sie Ihre eigenen Schlussfolgerungen über ihre Gültigkeit in Ihrer Handelsstrategie ziehen können. Dieser Indikator kombiniert mehrere Chartmuster in einem einzigen, einheitlichen Werkzeug für MetaTrader 4 (MT4). Er bietet die Möglichkeit, jedes Muster direkt vom Chart aus ein- oder auszuschalten, was eine anpassbare und effiziente Analyse ermöglicht. Hier ist eine detaillierte Beschreibung des Indikators und der darin enthaltenen Muster:
#### Enthaltene Muster:
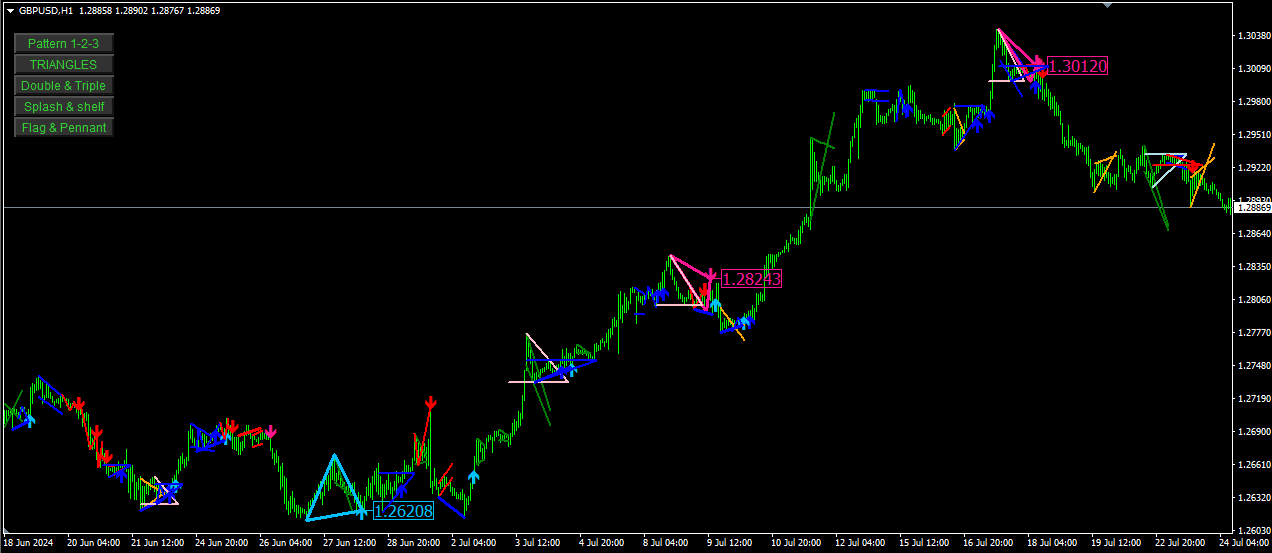
1. **Muster 1-2-3**
- **Beschreibung**: Dieses Muster wird verwendet, um potenzielle Umkehrungen auf dem Markt zu identifizieren. Es sucht nach einer Sequenz von drei Punkten (Hochs oder Tiefs), die auf eine Trendänderung hinweisen.
- **Signale**:
- Kaufsignal: Entsteht, wenn zwei aufeinanderfolgende Tiefs vorhanden sind, wobei das zweite Tief höher als das erste ist, gefolgt von einem Hoch, das niedriger als das vorherige Hoch ist.
- Verkaufssignal: Entsteht, wenn zwei aufeinanderfolgende Hochs vorhanden sind, wobei das zweite Hoch niedriger als das erste ist, gefolgt von einem Tief, das höher als das vorherige Tief ist.
- **Visualisierung**: Zeichnet Linien, die die Punkte des Musters auf dem Chart verbinden, und platziert Pfeile an den Abschlussstellen.
2. **Doppel-Top und Doppel-Bottom**
- **Beschreibung**: Dieses Muster hilft, potenzielle Umkehrpunkte zu identifizieren, bei denen der Preis zwei aufeinanderfolgende Hochs (Doppel-Top) oder Tiefs (Doppel-Bottom) bildet, die ungefähr gleich sind und auf eine mögliche Umkehr hinweisen.
- **Signale**:
- Doppel-Top: Bärisches Umkehrsignal.
- Doppel-Bottom: Bullisches Umkehrsignal.
- **Visualisierung**: Zeichnet Linien, die die Hochs oder Tiefs verbinden, und platziert Pfeile an den Umkehrpunkten.
3. **Dreifach-Top und Dreifach-Bottom**
- **Beschreibung**: Ähnlich wie das Doppel-Top und Doppel-Bottom, aber mit drei aufeinanderfolgenden Hochs oder Tiefs. Dieses Muster gilt als stärker als das Doppel-Top und Doppel-Bottom.
- **Signale**:
- Dreifach-Top: Bärisches Umkehrsignal.
- Dreifach-Bottom: Bullisches Umkehrsignal.
- **Visualisierung**: Zeichnet Linien, die die Hochs oder Tiefs verbinden, und platziert Pfeile an den Umkehrpunkten.
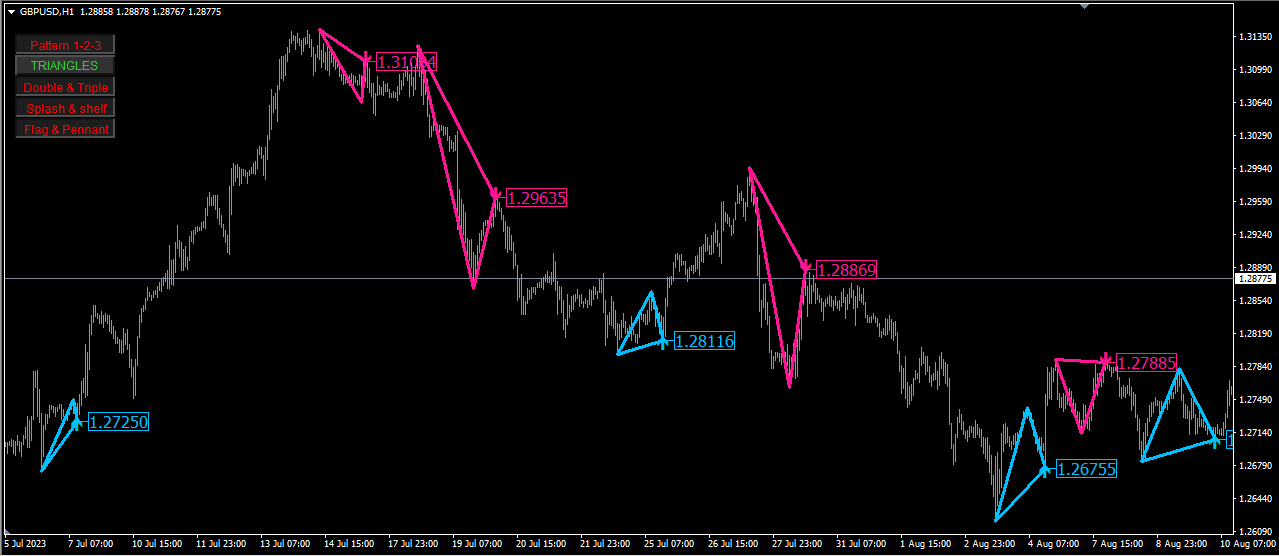
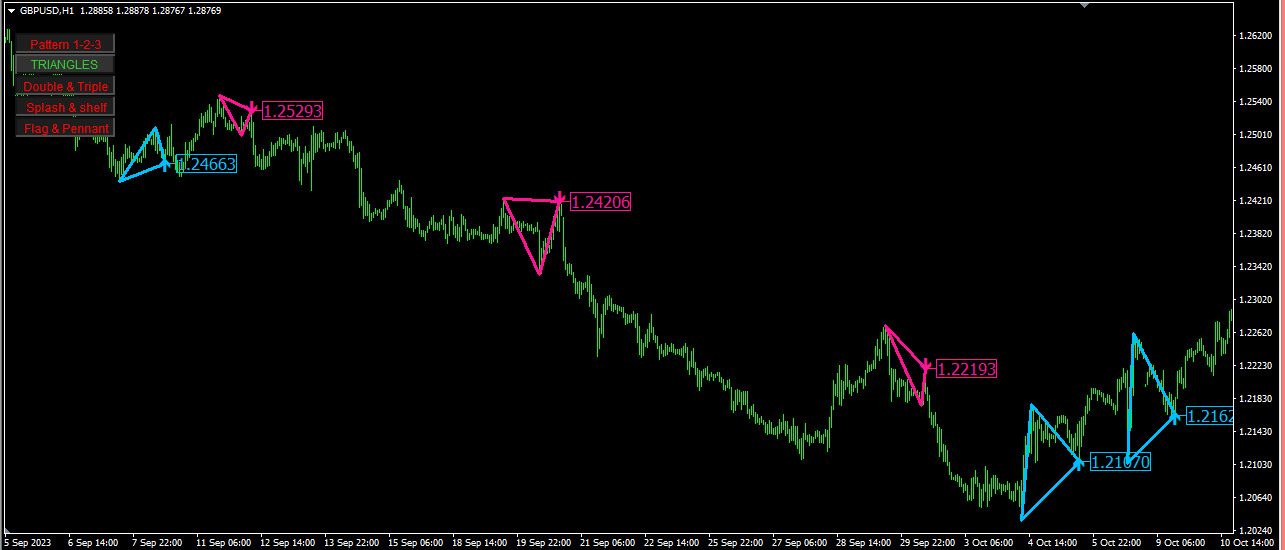
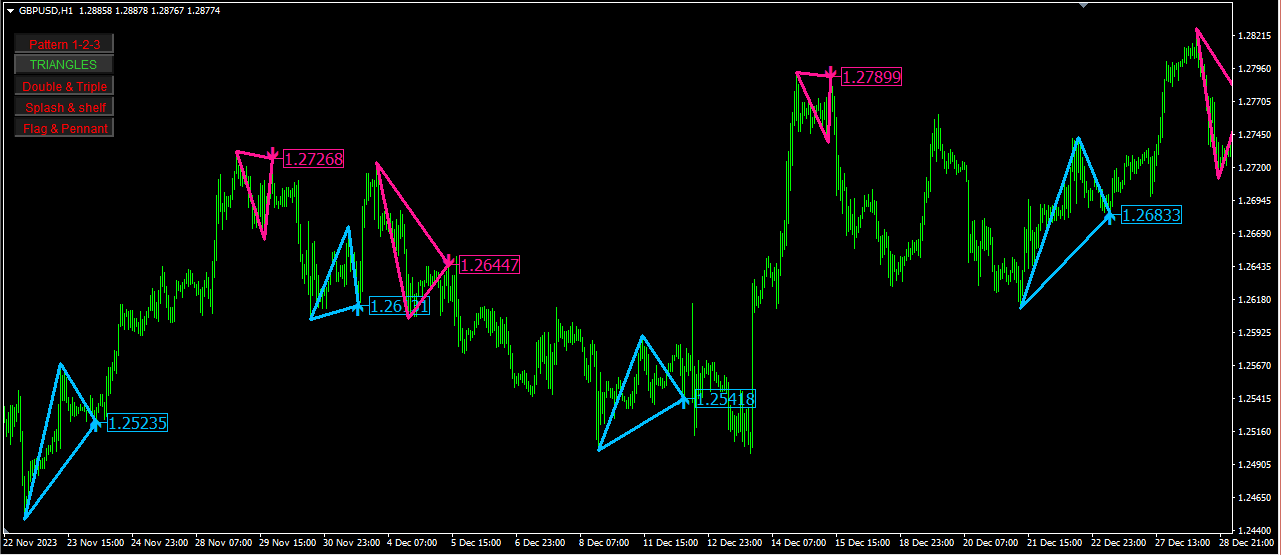
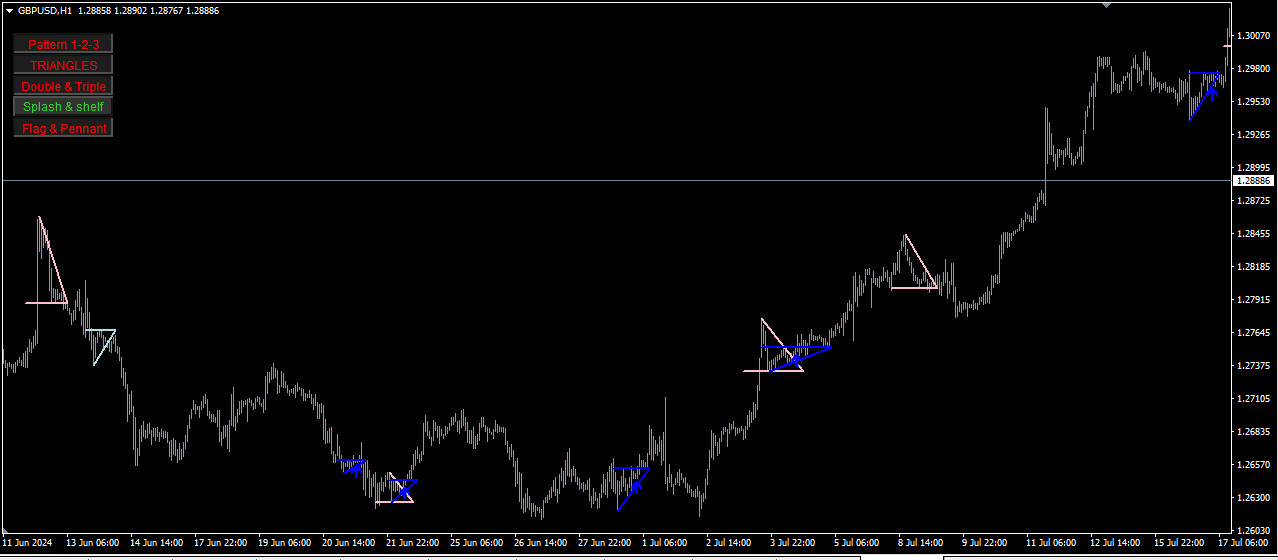
4. **Dreiecke**
- **Beschreibung**: Dreiecke sind Fortsetzungsmuster, die auf eine Konsolidierungsphase hinweisen, bevor der Preis in Richtung des vorherrschenden Trends weitergeht. Dieser Indikator erkennt aufsteigende, absteigende und symmetrische Dreiecke. Da er auf dem ZigZag-Indikator basiert, können die Dreiecke manchmal ein paar Balken zurück auf dem Chart erscheinen. Dies geschieht, weil der ZigZag-Indikator seine Linien etwas später als der tatsächliche Höhepunkt zeichnet. Dies geschieht jedoch nicht oft.
- **Signale**:
- Aufsteigendes Dreieck: Bullisches Fortsetzungssignal.
- Absteigendes Dreieck: Bärisches Fortsetzungssignal.
- Symmetrisches Dreieck: Fortsetzungssignal, das in beide Richtungen ausbrechen kann.
- **Visualisierung**: Zeichnet die Dreiecksformen auf dem Chart und platziert Pfeile an den Ausbruchspunkten.
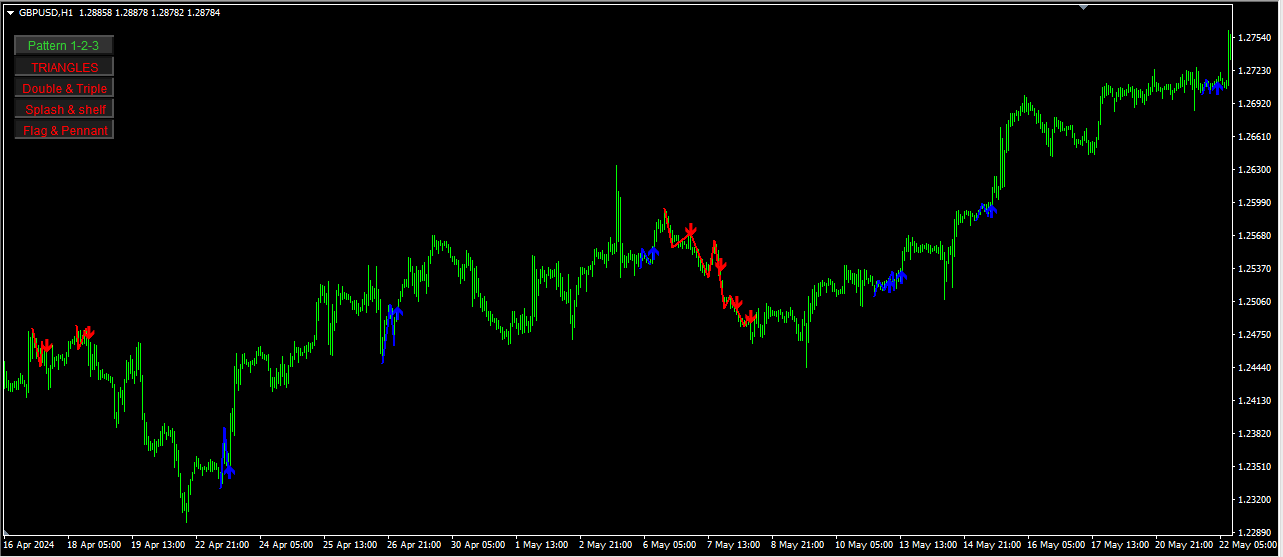
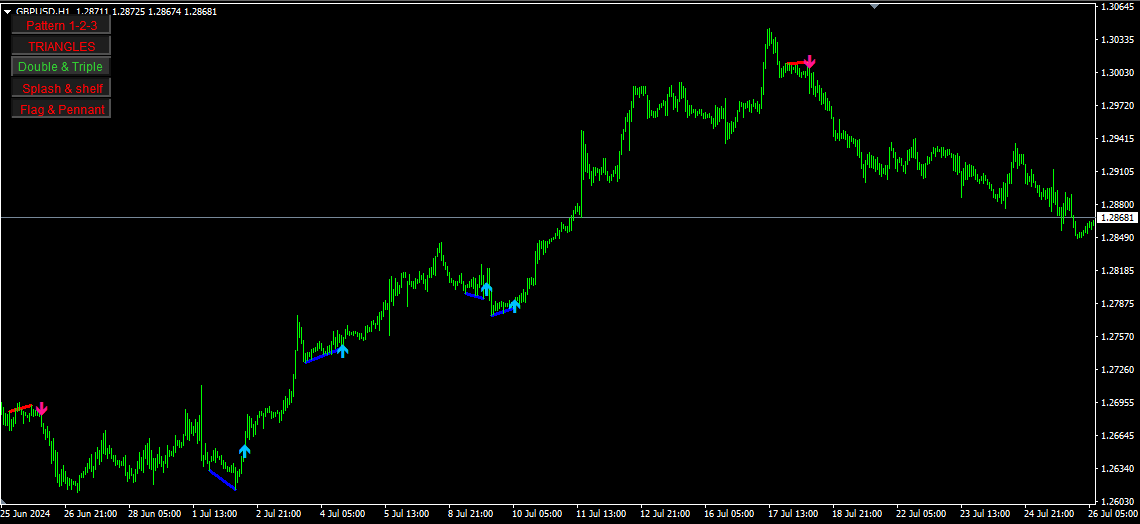
5. **Splash und Shelf**
- **Beschreibung**: Dieses Muster erkennt plötzliche Preisspitzen (Splash) gefolgt von Konsolidierungsphasen (Shelf). Es ist nützlich, um potenzielle Ausbrüche oder Umkehrungen zu erkennen.
- **Signale**:
- Splash: Weist auf eine scharfe Preisbewegung hin.
- Shelf: Weist auf eine Konsolidierungsphase nach einem Splash hin.
- **Visualisierung**: Zeichnet Trendlinien für den Splash und horizontale Linien für das Shelf.
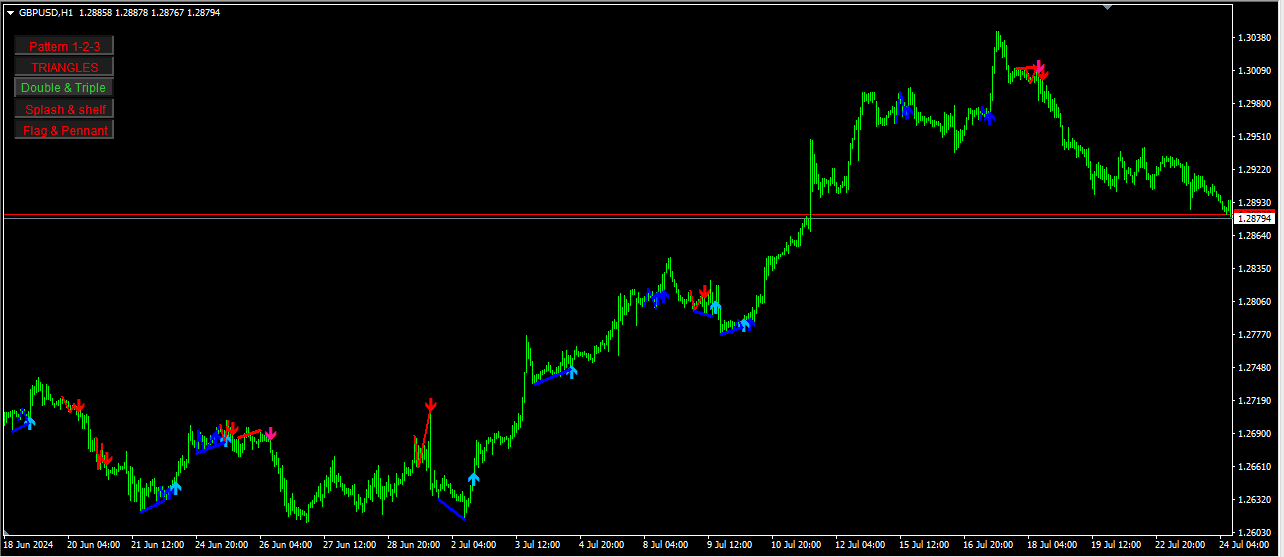
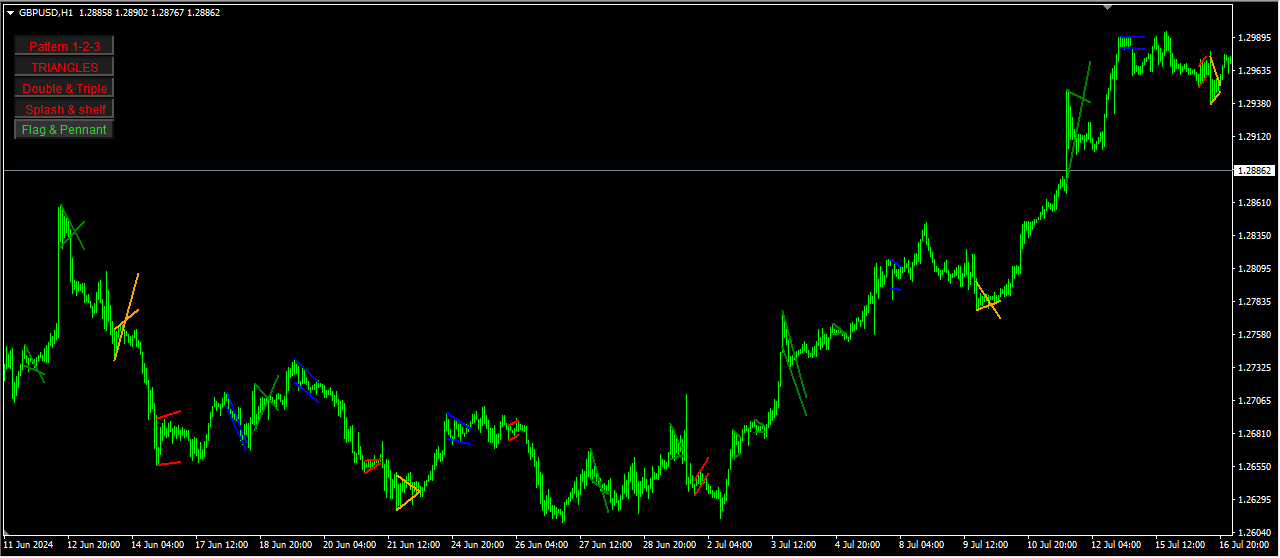
6. **Flagge und Wimpel**
- **Beschreibung**: Flaggen und Wimpel sind kurzfristige Fortsetzungsmuster, die auf eine kurze Pause im vorherrschenden Trend hinweisen, bevor er weitergeht.
- **Signale**:
- Bullische Flagge: Bullisches Fortsetzungssignal.
- Bärische Flagge: Bärisches Fortsetzungssignal.
- Wimpel: Fortsetzungssignal, das ein kleines symmetrisches Dreieck bildet.
- **Visualisierung**: Zeichnet Flaggen- und Wimpelformen auf dem Chart und platziert Pfeile an den Ausbruchspunkten.
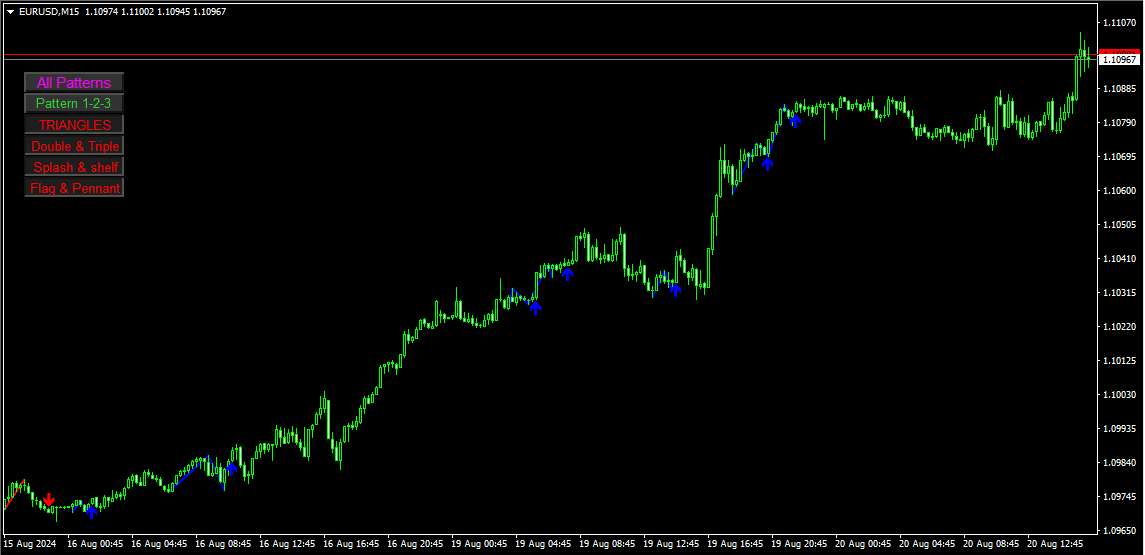
#### Funktionen:
- **Muster ein-/ausschalten**: Der Indikator bietet Schaltflächen auf dem Chart, um jedes Muster ein- oder auszuschalten. Dies ermöglicht eine flexible und effiziente Analyse.
- **Anpassbare Farben und Einstellungen**: Benutzer können die Farben, Breiten und andere Einstellungen für jedes Muster anpassen.
- **Warnungen und Benachrichtigungen**: Der Indikator kann so konfiguriert werden, dass bei der Identifizierung von Mustern Warnungen, Push-Benachrichtigungen und E-Mails gesendet werden.
#### Eingaben:
- **Allgemeine Einstellungen**: Beinhaltet Farben, Breiten und andere Anzeigeeinstellungen für die Muster.
- **Musterspezifische Einstellungen**:
- `Double_Triple_and_1_2_3`: Einstellungen für Doppel-Top/Bottom und Muster 1-2-3.
- `Pattern_TRIANGLES`: Einstellungen für Dreiecksmuster.
- `Splash_and_shelf`: Einstellungen für Splash- und Shelf-Muster.
- `Flag_and_Pennant`: Einstellungen für Flaggen- und Wimpelmuster.
- **Warnungseinstellungen**: Konfigurieren Sie Warnungen, Benachrichtigungen und E-Mails.
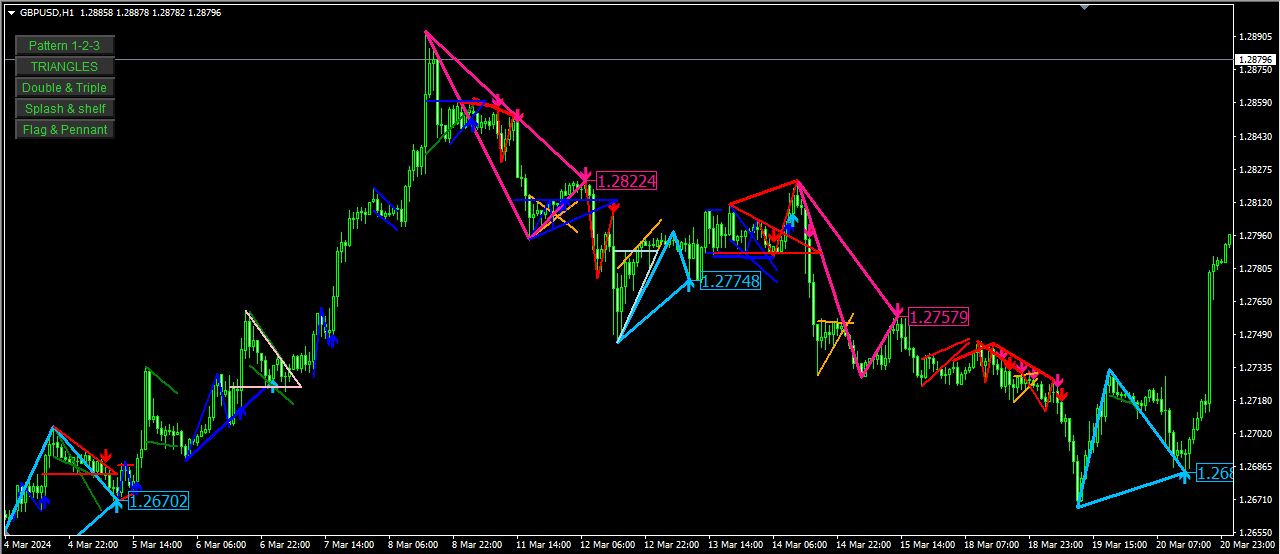
#### Visualisierung:
- **Pfeile und Linien**: Jedes Muster wird durch Pfeile und Linien auf dem Chart visualisiert, was es einfach macht, Muster auf einen Blick zu erkennen.
- **Interaktive Schaltflächen**: Auf dem Chart sind Schaltflächen vorhanden, um die Sichtbarkeit jedes Musters umzuschalten.
Dieser All-in-One-Indikator ist ein leistungsstarkes Werkzeug für Händler, die mehrere Chartmuster in ihrer technischen Analyse verwenden. Durch die Kombination dieser Muster in einem einzigen Indikator wird der Analyseprozess vereinfacht und Händlern geholfen, fundierte Handelsentscheidungen zu treffen.


It is a very accurate indicator. I'm waiting for a sign on the 4-hour timeframe and looking for an entry point on the 15-minute timeframe, and both signs are valid.